

Abstract
We present an extensive comparison of short-range order and short wavelength dynamics of a hydrated phospholipid bilayer derived by molecular dynamics simulations, elastic x-ray, and inelastic neutron scattering experiments. The quantities that are compared between simulation and experiment include static and dynamic structure factors, reciprocal space mappings, and electron density profiles. We show that the simultaneous use of molecular dynamics and diffraction data can help to extract real space properties like the area per lipid and the lipid chain ordering from experimental data. In addition, we assert that the interchain distance can be computed to high accuracy from the interchain correlation peak of the structure factor. Moreover, it is found that the position of the interchain correlation peak is not affected by the area per lipid, while its correlation length decreases linearly with the area per lipid. This finding allows us to relate a property of the structure factor quantitatively to the area per lipid. Finally, the short wavelength dynamics obtained from the simulations and from inelastic neutron scattering are analyzed and compared. The conventional interpretation in terms of the three-effective-eigenmode model is found to be only partly suitable to describe the complex fluid dynamics of lipid chains.
INTRODUCTION
Lipid membranes in the fluid Lα phase have since long been studied by elastic x ray and inelastic neutron scattering as model systems for the more complex and multicomponent biological membranes (1–9). Quantitative information on molecular packing, self-assembly, and thermal fluctuations can be obtained (10). Recent studies on such model membranes have been extended to address the collective dynamics by using inelastic x ray (11,12) and neutron scattering (13), providing dispersion relations for propagating density modes. Together, elastic and inelastic scattering lead to a quite detailed and quantitative description of lipid bilayers in the reciprocal space. Parallel to experimental techniques, molecular dynamics (MD) simulations have been used to study the structure and dynamics of lipid bilayers (14,15). MD simulations are routinely used to study the dynamics and energetics of phase behavior, permeation, undulation, membrane self-assembly, and collective dynamics at a molecular level (16–22).
In this work, we will show that the simultaneous use of MD and diffraction data can be used to refine the structural knowledge of lipid bilayer systems. Simulations can help to interpret diffraction signals in more detail and accuracy than was possible before. At the same time, starting parameters and interatomic potentials used in MD can be verified and refined by comparison with diffraction data.
Elastic x-ray scattering experiments of lipid bilayers usually yield the modulus square of the Fourier transform of the electron density, and thus yield spatial correlations in the electron density rather than the density itself. This fact is well known as the “phase problem” in crystallography. In some cases, e.g., structurally simple liquids, the correlation functions themselves—such as structure factors—are the main quantity of interest, from which the nearest-neighbor distance and correlation length can be inferred. Already for complex fluids, however, a much more detailed description beyond mere correlation functions is required. Detailed structural information can be obtained by MD simulations. Simulation results can be compared to experiments via a Fourier transformation of the MD coordinates, and can thus facilitate interpretation of the experimental results at a molecular level.
Recently, a number of approaches have been introduced to correlate experimentally measured structure factors (SFs) with SFs extracted from MD simulations to aid molecular interpretation of the experiments. Spaar et al. related measured SFs to the interchain distance extracted from MD (23). Additionally, the issue of extracting the area per lipid has been an active field of research (24,25). Klauda et al. (26) addressed this nontrivial issue by relating the area per lipid from simulations to measured density correlations perpendicular to the membrane.
In this work, we combine MD simulations of the well-known phospholipid model system 1,2-dimyristoyl-sn-glycero-3-phosphocholine (DMPC) in the fluid Lα phase with elastic x-ray and inelastic neutron scattering experiments. We present an analysis of the experimental observables, allowing an extensive comparison of the MD results to a set of scattering data, including x-ray reflectivity, x-ray reciprocal space mappings, and inelastic neutron scattering by triple-axis-spectrometry. Accordingly, details of the vertical density profile ρ(z) of the acyl chain packing and radial distribution functions, as well as the dispersion relation of the density fluctuations in the plane of the bilayer are addressed. Moreover, the relationship between the experimentally measurable chain correlation peak and the area per headgroup extracted from MD is investigated. In contrast to Klauda et al. (26), who addressed density correlations perpendicular to the membrane, we primarily focus at lateral short-range order of lipids.
In addition to static properties of the bilayer, we present an analysis of collective dynamics of the lipid tails. These have been argued to be crucial for the transport of small molecules through the bilayer (27), and have been investigated experimentally (11–13) and by MD (21). Generally, collective chain dynamics are interpreted in terms of the three-effective-eigenmode model, which has, however, been derived and verified to describe short wavelength density fluctuations of simple liquids like fluid inert gases (28–31). So far, it is not obvious whether the collective dynamics of lipid tails can be quantitatively described by three effective modes.
The following presentation of our results is organized in three parts:
The electron density profile, the structure factor parallel to the membrane plane, and the reciprocal space mapping of the DMPC bilayer are calculated from equilibrium MD simulation and quantitatively compared to x-ray scattering results.
Next, the relationship between the area per lipid and the interchain correlation peak is addressed by employing results derived from simulations at different fixed areas per lipid. Additionally, the MD coordinates are used to verify quantitative relations between the structure factor and the radial distribution function, i.e., between a signal in reciprocal space with structure in real space.
Finally, we compare collective chain dynamics in simulation and experiment by analyzing the dynamic structure factor derived from inelastic neutron scattering and MD simulations. The dynamic structure factor is interpreted in terms of the three-effective-eigenmode model.
METHODS
Simulations
An equilibrated simulation box of 128 DMPC lipids and 2944 water molecules (Fig. 1 a) was chosen as starting configuration for the simulations. Parameters for DMPC were taken from Berger et al. (32) and the Tip4p water model (33) was applied. All simulations were carried out using the GROMACS simulation software (34,35). Electrostatic interactions were calculated at every step with the particle-mesh Ewald method (36,37). Short-range repulsive together with attractive dispersion interactions were described by a Lennard-Jones potential, which was cut off at 1.0 nm. The SETTLE (38) algorithm was used to constrain bond lengths and angles of water molecules, and LINCS (39) was used to constrain the bond lengths of the lipids, allowing a time step of 2 fs. The simulation temperature was kept constant by weakly (τ = 0.1 ps) coupling the lipids and solvent separately to a temperature bath (40) of 313 K. Likewise, the pressure was kept constant by weakly coupling the system to a pressure bath of 1 bar. In simulations with fixed area per lipid, the pressure coupling in x-y direction (membrane plane) was turned off and the box was coupled to a pressure bath only in z direction (perpendicular to the membrane). In total, the simulations cover a time of 230 ns.
FIGURE 1.

(a) A patch of 128 DMPC lipids and 2944 water molecules was used as starting configuration for all simulations. To calculate structure factors and radial distribution functions, a four-times larger patch was simulated. (b) Electron density determined by x-ray diffraction (shaded), by simulation (black), and by convolving the simulation result with a Gaussian (dashed). (c) Electron density extracted from the simulation and decomposed in contributions from headgroups (shaded solid), lipid tails (shaded dashed), water (black dashed), and the complete system (black solid).
Density profiles
The number of water molecules per lipid (nw/nℓ) to be used in the simulation was determined from the experimental density profile, yielding an estimated ratio nw/nℓ of 27.6. To accomplish this ratio, a simulation box of 128 lipids and 3529 water molecules was set up, but used only for comparison of the electron density profiles. The electron density was extracted from a 50-ns trajectory where the first 10 ns were removed for equilibration. The atomic electron densities were approximated by a sum of Gaussians,  The parameters
  and
and  were estimated from the Cromer-Mann parameters ai and bi (see also next paragraphs) using the fact that a Gaussian form factor in reciprocal space refers to a Gaussian electron density in real space. Fourier transformation yields
  = ai(4π/bi)3/2 and
  = 4π2/bi.
Structure factors (SF)
To achieve a resolution in reciprocal space comparable to the experiments (see below), we combined four of the preequilibrated patches of 128 lipids to obtain a simulation system of 512 DMPC lipids and 11,776 water molecules (nw/nℓ = 23). This system was then equilibrated for 12 ns, and simulated for another 18 ns for production. Structure factors were calculated every 10 ps, yielding the SF averaged over 1800 frames. The scattering amplitudes at the reciprocal space coordinate q, s(q), were calculated by a direct evaluation of the sum  Here, rn denotes the position of atom n, and fn(k) the nondispersive part of the atomic form factor of atom n where k = sin θ/λ with the incident angle θ and the wavelength λ of the x-ray beam. The fn(k) values were calculated using the approximation
 |
(1) |
where c(n),  and
and  are the Cromer-Mann parameters which are available in the literature (41). Parameters for N = 4 and N = 2 Gaussians are available. We used the latter ones. The structure factor is given by
  The value S(q) was averaged in the qx-qy plane along circles of constant
  giving the structure factor S(qlat, qz) as a function of qlat and qz, corresponding to the components of momentum transfer parallel (in lateral direction) and perpendicular to the membrane, respectively.
The periodic boundary conditions applied in all simulations give rise to an infinite and strictly periodic system in which the resolution in reciprocal space is limited to 2π/L where L is the box size. In our case, the simulation setup of 512 lipids rendered a resolution of ∼0.05 Å−1 parallel and ∼0.1 Å−1 perpendicular to the bilayer.
Radial distribution functions (RDF)
Following the notation in Spaar and Salditt (23), the RDF is defined by
 |
(2) |
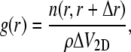
where ΔV2D = 2πr Δr is the volume of a shell with radius r and thickness Δr, and n(r, r + Δr) is the number of the considered molecules/subgroups in this shell. The value ρ denotes their two-dimensional density and r is the distance in lateral direction only.
The simulation of 512 DMPC lipids was used to calculate RDFs of (parts of) the headgroups and of the lipid tails. Headgroup RDFs were calculated for each monolayer separately, and subsequently averaged over the two monolayers. For the RDF of the chains the tail region was cut into 60 slices of width dsl = 0.5 Å. For each atom in a slice, neighboring atoms were counted to contribute to the RDF of the slice if their distance perpendicular to the bilayer was smaller than dsl/2. The first maximum in the RDF of the lipid tails a was extracted after slightly smoothing the RDF by a Savitzky-Golay method. A robust measure of the periodicity of the RDF λRDF could be achieved by fitting the maxima of the RDF to quadratic functions.
Correction in relations between RDF and SF
When calculating properties of the RDF of the lipid tails from their SF, a distinction should be made between the RDF of the electron density and the RDF of the centers of the carbon atoms of the lipid tails. The small difference between the two is due to the normalization of the RDF with ΔV2D (Eq. 2): Assuming a carbon atom C located at a distance r0 from the origin, with its electron density distributed like a Gaussian with standard deviation σ at around r0, then the factor of 1/r due to the normalization (Eq. 2) renders the maximum of the RDF of the electron density to be located at
 |
(3) |
rather than at r = r0. The Cromer-Mann parameters were used to estimate σ in the simulations. A fit of a single Gaussian to the electron density of a united CH2 atoms yielded σ ≃ 0.89 Å. As the united CH2 atoms are the most frequent atom type in the lipid tails they are the most suitable choice for this estimation. This correction of ∼3% has been incorporated in Fig. 6 c.
FIGURE 6.

(a) Radial distribution function (RDF) and (b) structure factor (SF) of lipid tails from simulations at constant area per lipid AL. AL was constrained between 100% and 140% of the equilibrium area per lipid and increased in steps of 5% (Aeq = 62.3 Å2). (c) The position of the first maximum a of the RDF (black solid line, circles), a calculated from the SF using Eq. 9 (black dashed line, circles), periodicity λRDF of the RDF (shaded solid line, diamonds), λRDF calculated from the SF using Eq. 10 (shaded dashed line, diamonds), and the mean interchain distance am (dashed black line). The quantities are plotted versus the area per lipid in units of Aeq.
Statistical errors for the correlation length
All trajectories were subdivided in short trajectories of 1 ns. The SF was calculated for every subtrajectory separately and fitted to a Lorentzian allowing us to extract the mean and the standard deviation of the correlation length (assuming a normal distribution).
Dynamic structure factor (DSF)
To clarify the nomenclature we first review some definitions needed to investigate collective dynamics of bilayers. The spatial and temporal density correlation function is given by  where N is the particle number, and the brackets denote the ensemble average. In the case of neutron scattering, the corresponding density is given by
  with the position rn(t) of particle n at time t, and fn its nuclear scattering length.
The “intermediate scattering function” (in some publications termed “density correlation function”) is the spatial Fourier transform of G(r, t), 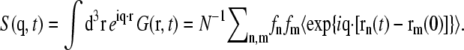 The scattering function in turn is defined as the temporal Fourier transform of S(q, t), i.e., by
 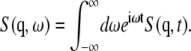 Note that S(q, ω) is real since S(q, t) = S*(q, −t) holds for the complex intermediate scattering function.
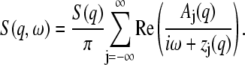
For a fluid, it has been shown (29) that, according to kinetic theory, S(q, ω) can be decomposed into an infinite set of Lorentzians:
 |
(4) |
Here, S(q) is the static structure factor, and the parameters Aj and zj are real or appear in complex conjugate pairs: A−j = Aj* and z−j = zj*. The values Aj and zj are not independent but obey sum rules,
 |
(5) |
where R0(q) = S(q), R1(q) = 0, and R2(q) = −kBTq2/M with the temperature T, the Boltzmann constant kB, and the particle mass M.
In the hydrodynamic limit, i.e., for wavelengths much larger than the diameter of the particles, only three Lorentzians contribute to S(q, ω), and the parameters Aj and zj can be expressed in terms of hydrodynamic quantities, which are, e.g., summarized in de Schepper et al. (29). Then the model consists of a central Rayleigh line (j = 0), and two Brillouin lines (j = ±1), which correspond to the heat mode and two sound modes, respectively. Therefore, it is usually referred to as the three-effective-eigenmode model. It has been argued that it is not the particle diameter σ but the mean free path ℓ that limits the validity of the hydrodynamic equations. Therefore, for σ−1 < q < ℓ−1, S(q, ω) can still be well approximated by three Lorentzians. In this case, however, Aj and zj are no longer determined by hydrodynamic quantities.
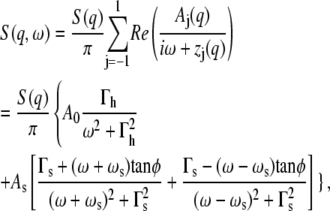
In summary, for all cases q < ℓ−1,
 |
(6) |
where A0(q) is the area of the Rayleigh line and As(q) = Re A±1(q) the area of the Brillouin lines. Γh(q) = z0(q) and Γs(q) = Re z±1 are their corresponding line widths, ωs = Im z1 is the sound mode frequency, and tan φ = Im A1/Re A1 determines the asymmetry of the Brillouin lines.
A 10-ns simulation of a well-equilibrated patch of 128 DMPC lipids and 2944 water molecules was performed to calculate the lateral DSF of the lipid tails. During the simulation, the nuclear form factor 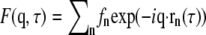 was calculated every 4 fs. Here, fn denotes the nuclear scattering length of atom n, and rn(τ) its position at time τ. As in the samples used for corresponding experiments (see below), all CH2 and CH3 groups of the lipid tails were assumed to be deuterated. The intermediate scattering function was calculated by S(q, t) = N−1〈F*(q, τ + t)F(q, τ)〉τ, where N denotes the number of atoms, and the brackets the average over the 10-ns simulation, i.e., over ∼2.5 million pairs of frames, yielding a well-converged DSF. S(q, t) was calculated up to a time displacement of t ≤ 100 ps. Finally, S(q, t) was averaged along circles of equal qlat (lateral plane) and Fourier-transformed, yielding the scattering function S(q, ω), and the lateral spectrum Cℓ(q, ω) = (ω2/q2)S(q, ω). To suppress artifacts from the cutoff at 100 ps, S(q, t) was turned off smoothly by a Gaussian of width σ = 20 ps, which corresponds to a resolution of 0.05 meV. The fit to the three-eigenmode model was performed by a least-square Trust-Region algorithm, restricted to ω < 30 meV.
Experiments
For all experiments, DMPC and deuterated DMPC were purchased from Avanti Polar Lipids (Birmingham, AL). Density profiles and structure factors were measured at the bending magnet beamline D4 of HASYLAB/DESY in Hamburg, Germany.
Density profiles
The experimental density profile was obtained from x-ray reflectivity measurements and analysis described in Mennicke et al. (42). For the experiments, highly oriented oligo-membranes were prepared using the spin-coating method (43). The DMPC was used without further purification. The lipid was dissolved in chloroform at a concentration of 10 mg/ml. An amount of 100 μl of the solution was pipetted onto carefully cleaned silicon substrates of a size of 15 × 25 mm2 cut from standard commercial silicon wafers. The substrate was then immediately accelerated to rotation (3000 rpm), using a spin-coater. After 30 s the samples were dry and subsequently exposed to high vacuum to remove any remaining traces of solvent. The samples were then stored at T = 277 K until the measurement. For the x-ray measurements the samples were kept in a stainless steel chamber with kapton windows, which were filled with ultra-pure water (Millipore, Billerica, MA). Thus, the samples were fully hydrated, immersed in excess water. To measure the samples in this environment, x rays of 20 keV photon energy were used, to minimize absorption loss in the water. Temperature was controlled by an additional outer chamber at T = 313 K. The settings of the x-ray reflectivity measurements are described in Mennicke et al. (42). Least-square fits of the Fresnel reflectivity have been carried out over a range of qz ≤ 0.65 Å−1, taking into account thermal fluctuations (44). For the modeling, the density profile was parameterized by Fourier coefficients, as described in Salditt et al. (45).
Structure factors: elastic scattering of the acyl chains
Experimental structure factors and reciprocal space mapping were obtained from elastic x-ray scattering of oriented multilamellar films at partial hydration using the grazing incidence diffraction geometry as described in Spaar and Salditt (23). DMPC was dissolved in Isopropanol at a concentration of 20 mg/ml and used without purification. After drying, remaining traces of solvent in the sample were removed by exposing the samples to high vacuum over 24 h. The films were then rehydrated in a hydration chamber from a water reservoir. The orientational alignment of the multilamellar stack with respect to the substrate (mosaicity) was typically better than 0.01°. A very low mosaicity is a prerequisite to apply interface-sensitive x-ray scattering techniques for structural studies of solid-supported bilayers. During the x-ray experiments, the solid-supported multilamellar films were kept in a closed temperature-controlled chamber at T = 318 K. The DMPC bilayers were typically only swollen up to a repeat distance of d ≃ 50 Å in the fluid Lα-phase, i.e., they were only partially hydrated. Note that full hydration by immersing the samples in excess water as for the reflectivity measurements described above was not possible, since in this case the chain correlation peak is dominated by the scattering peak of excess water. The hydration conditions were controlled in situ by measuring the lamellar repeat distance d, from which the osmotic pressure or the relative humidity can be obtained. The grazing incidence diffraction experiments have been carried out as described in Münster (46).
Dynamic structure factors: inelastic neutron scattering
Data on the collective dynamics of the acyl chains were obtained from inelastic neutron scattering using the cold triple-axis spectrometer IN12 at the high flux reactor of the Institut Laue Langevin in Grenoble, France, as described in Rheinstädter et al. (13). Oriented membrane stacks were deposited on 2" silicon wafers with a thickness of twafer = 300 μm by spreading from a solution of DMPC-d54 (deuterated DMPC) in trifluoroethylene/chloroform (1:1) at a concentration of 35 mg/ml. To increase the scattering volume, 10 of these wafers were stacked on top of each other to create a sandwich sample consisting of several thousands of highly oriented lipid bilayers with a total mass of ∼300 mg of deuterated DMPC. The samples were hydrated from a heavy water reservoir, thermally isolated against the sample. Aluminum spacers between the substrates allow the heavy water to vapor in between the wafers to hydrate the bilayers. The humidity inside the stack can be controlled by independently adjusting the temperature of the chamber and the temperature of the reservoir using two bath controllers. A temperature and a humidity sensor were installed close to the sample. The lamellar repeat distance was d ≃ 53 Å. Measurements were performed in the fluid phase at T = 303 K. The use of a triple-axis spectrometer offers the unique possibility to measure reflectivity, the static structure factor in the plane of the membranes, S(qlat), and in-plane dynamics, S(qlat, ω) on the same instrument in the same run without changing setup.
RESULTS AND DISCUSSION
Electron density
Since this study mainly focuses on the lipid structure parallel to the bilayer, and as the influence of force fields and finite size effects on the electron density have already been investigated in detail (26,47,48), we present here only a brief comparison between the electron density perpendicular to the bilayer, ρ(z), determined by simulation and x-ray scattering experiments.
Fig. 1 b shows the electron density profile along the membrane normal of a DMPC bilayer. The density from MD simulations (black solid line) is in good agreement with the density profile from experiment (shaded line). Small differences are observed in form of the more pronounced maxima and minima in the simulation, and a slightly faster decay of the electron density between headgroups and bulk water. These differences can be explained either by 1), limitations in the force field, i.e., some aspects of the bilayer structure are not reproduced well; 2), by finite size effects due to the limited size of the simulation box; or 3), by an experimental effect leading to a smearing out of the profile. Smearing out of the experimental profile may be caused by thermal fluctuations, which are taken into account on the level of a continuum model (44), but residual fluctuation amplitudes on molecular scales may still lead to a flattening of the profile. To test whether smearing can indeed account for the differences between profiles from scattering and simulation, we mimicked smearing by convolving the electron density from simulation with a Gaussian. The best agreement was found by convolving the density from simulation with a Gaussian of width σ = 1.4 Å (Fig. 1 b, dashed line). As expected, the convolution decreases the differences observed at the maxima and minima. The difference in the decay of the density between headgroups and water remained. As a next step, we investigated whether the difference in the slope near the headgroups is due to finite size effects. A simulation of a bilayer system four times larger than the one shown in Fig. 1 a did, however, not improve the agreement (data not shown). This may be taken as an indication that although the applied force field reproduces the overall measured electron density favorably, not all aspects of the bilayer structure are perfectly reproduced.
Static structure factors
Static structure factors at qz = 0
Fig. 2 shows the static SF S(qlat, qz = 0) representing correlations of the electron density parallel to the membrane. The experimental result from x-ray diffraction (23,49) is shown in cyan, the simulation result in black. The most pronounced feature of the SF is the chain correlation peak at qlat ≃ 1.39 Å−1. Additionally, a shoulder at ∼0.8 Å−1 is visible.
FIGURE 2.

Static structure factor S(qlat, qz = 0) revealing density correlations parallel to the bilayer. The interchain correlation peak at qlat = 1.39 Å−1 is clearly visible in both the experimental (cyan line) and simulation results (black line). Additionally, a shoulder at qlat ≈ 0.8 Å−1 that corresponds to the electron density of the headgroups is visible in both curves. Properties of the structure factor are easier to identify after decomposing it into contributions from the lipid tails (green), the headgroups (blue), or the complete DMPC lipids (red). The solid orange line indicates where the headgroup peak is expected when assuming that the headgroups are arranged on a two-dimensional hexagonal lattice. The dashed orange line is the corresponding line for the lipid tails.
Taking advantage of the possibility to omit atoms when calculating the SF from the simulation we can isolate the contributions from individual groups to the SF. To this end, we decomposed the SF into contributions from the lipid tails (Fig. 2, green), the headgroups (blue), or the complete DMPC lipids (red). All curves except the headgroups show the peak at ∼1.39 Å−1. The observation that the headgroup curve (blue) does not show this peak, whereas the lipid tails (green) produces this peak only, clearly confirms the common interpretation of this peak as the chain correlation maximum.
To quantify the comparison between experiment and simulation, we fitted the interchain correlation peak in the range of 1.2–1.8 Å−1 to a Lorentzian,
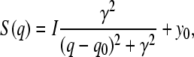 |
(7) |
where I denotes the intensity, γ the half width at half-maximum, and q0 the center. In simple cases only, a peak at q0 refers to a regular ordering of the density with spacing 2π/q0. The value y0 is the baseline of the peak and is generated by, e.g., thermal fluctuations and contributions from inelastic scattering. For a Lorentzian the correlation length is given by ξ = 1/γ. The fit of the chain correlation peak to a Lorentzian (Eq. 7) was carried out by applying a least-squares method using a Trust-Region algorithm, yielding the peak position q0 and the correlation length ξ. This fit has been performed for 1), the experiment; 2), the coordinates of the lipid tails; 3), of the complete lipids; and 4), of lipid and water. The results are summarized in Table 1. The peak position as well as the correlation length is in favorable agreement with experiment. Since the level of hydration was slightly lower in experiment compared to simulation, we performed an additional simulation with a water/lipid ratio of nw/nℓ = 15, which reproduces the experimental bilayer repeat distance of 50 Å. The results differ <1% compared to the results in Table 1 (data not shown), showing that in the regime of partial hydration the exact level of hydration has no significant influence on the lipid tail packing.
TABLE 1.
Positions of the peak maxima q0 and the corresponding correlation lengths ξ of the chain-chain and the headgroup correlation peak, extracted from x-ray diffraction experiments and MD simulations
| Peak | Data | q0/Å−1 | ξ/Å | Color in Fig. 2 |
|---|---|---|---|---|
| Chains | Experiment | 1.385 | 5.7 | Cyan |
| Simulation (lipid tails) | 1.396 | 5.6 | Green | |
| Simulation (complete lipids) | 1.392 | 5.1 | Red | |
| Simulation (lipids and water) | 1.411 | 6.0 | Black | |
| Headgroups | Simulation (headgroups) | 0.73 | 3.2 | Blue |
A second feature in the experimental SF (Fig. 2, cyan line) and the SF of the simulation system (black line) is the headgroup peak, which is only visible as a shoulder at ∼0.8 Å−1. Omitting the water (red line) leads to a significantly more pronounced peak, indicating that gaps between headgroups are filled by water, smearing out the electron density correlation. When taking only the DMPC headgroups into account (blue line) the headgroup correlation is visible as a single peak, which can again be fitted to a Lorentzian (Eq. 7) giving the position of the peak maximum and the correlation length. The fit in the range of 0.4 Å−1–1.4 Å−1 yields q0 = 0.72 Å−1 and ξ = 3.2 Å (see also Table 1)—showing that, although the headgroup correlation is present, it is weak.
In summary, the simulation result agrees favorably with experiment and confirms the common interpretation of the chain correlation peak and the headgroup shoulder. Having identified and analyzed the SF, the following questions arise: How do these structure factor maxima relate to specific configurations of lipids in real space? In particular, to which degree is the picture of a simple two-dimensional fluid valid to describe the short-range order of the lipid tails or the headgroups?
In a first step, we compare the lipid headgroup distribution to a grid of spheres arranged on a two-dimensional hexagonal lattice. The distance between the centers of adjacent headgroups is then 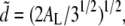 where AL is the area per lipid, and a peak at
  is expected in the SF. In our simulations, AL equaled 62.3 Å2, resulting in
 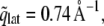 as indicated by a solid orange line in Fig. 2.
And indeed, the true position of the headgroup peak at 0.72 Å−1 is in good agreement with the position expected from this simplistic hexagonal lattice model.
In contrast, the idea of a densely packed two-dimensional fluid does not hold for the lipid tails. Using the same model, the chain correlation peak would be expected at 1.05 Å−1 (dashed orange line), which is far off the peak at 1.39 Å−1. Hence, the distance between lipid tails is shorter than expected from the homogeneous hexagonal lattice model. This short distance may be due to formation of local clusters of lipid tails. Apparently, in the fluid Lα phase, it is not possible to relate the area per lipid straightforwardly to the interchain distance. It would be interesting to investigate this issue in the gel phase as well, where the area per lipid is more reduced, thus shifting the dashed orange line in Fig. 2 to higher 
Reciprocal space mapping (RSM) in the qlat-qz plane
So far, we have considered S(qlat, qz = 0), reflecting the lateral correlations in the plane of the bilayer in a range of qlat corresponding to molecular length scales. However, S(qlat, qz = 0) characterizes only the two-dimensional order of lipid molecules, after projection of the electron density into the plane of the membrane. A full description of the fluid structure is obtained, by considering the three-dimensional structure of the tails, including their tilt degree of freedom. To this end, S(qlat, qz = 0) needs to be complemented by a fully two-dimensional reciprocal space mapping (RSM) S(qlat, qz) around the chain correlation peak (23). Experimentally, this is only possible for highly aligned membranes, where powder averaging does not destroy the separation of the different q components.
The RSM of the DMPC bilayer is displayed in Fig. 3 a. The simulation results are shown as a contour plot. For comparison, the x-ray data are shown as a color-coded plot. Again, favorable agreement is found in the full range of available experimental data. Both the simulation and x-ray data show the extension of the interchain correlation peak along a circle with radius ∼1.4 Å−1 around the origin of reciprocal space, indicated by a dashed line in Fig. 3 a. The bent peak shape originates from lipid tail populations (or segments) which are tilted against the membrane normal.
FIGURE 3.

(a) Reciprocal space mapping (RSM) of DMPC, i.e., the two-dimensional structure factor S(qlat, qz) representing density correlations parallel and perpendicular to the bilayer: simulation result as contour, x-ray data as color-coded plot. (b) Radial slices of the RSM from simulation along angles φ as indicated by the line in panel a. The value of φ is varied from φ = 0° (highest maximum, solid line) to φ = 80° (lowest maximum). (c) Peak maximum of radial slices versus the angle φ, extracted from simulation (shaded) and experiment (black line).
A more quantitative comparison is possible by analyzing S(qlat, qz) along radial slices in the qlat-qz plane. Fig. 3 b shows the simulation RSM along these slices at angles φ (as defined in Fig. 3 a) between 0° and 80° in steps of 5°. The maximum of the chain correlation peak clearly decreases and its half width at half-maximum increases with increasing φ. This is an indication that the lateral correlation length of the tail decreases the more the tails are tilted with respect to the membrane normal. The decay of the chain correlation peak along φ can be quantified by fitting the experimental and simulation data to a Lorentzian (Eq. 7) at various angles φ. The resulting peak maxima I(φ) are displayed in Fig. 3 c. Simulation and experiment may only be compared in the 10° ≲ φ ≲ 40° range. In this range, good agreement is observed. For φ < 10° corresponding to exit angles equal to the critical angle αf = αc, the Fresnel transmission function leads to an enhancement of intensity, which is a well-known optical effect in grazing incidence diffraction, rendering higher experimental than theoretical values.
Radial distribution functions (RDFs)
Headgroup structure
The RDF (Eq. 2) of the lipid headgroups yields a more detailed picture of their short-range order. Here, we present the RDFs computed from the centers of mass, which is more pronounced and less smeared out than the RDF computed from the electron densities. Thus, it helps to identify features in the structure.
The RDF of the complete headgroups (Fig. 4, green) reveals that there is not one but rather two or more typical distances of adjacent headgroups (note that “distance” always refers to COM distances). Apparently, the structure of lipid headgroups is more complex than that of spheres in a two-dimensional liquid and is not well described by the RDF of the COM of the complete headgroups. Therefore, we proceed to calculate the RDF of three subgroups of the headgroup: the phosphate group  the trimethylammonium (TMA) group
  and the central carbon atom of the glycerol (denoted C-β), i.e., the carbon atom to which the lipid tails are bound. Interestingly, these three subgroups show very different short-range correlations.
FIGURE 4.

Radial distribution functions g(r) of the centers of mass of molecular components of the headgroups: complete headgroups (green), phosphate (red), trimethylammonium groups (blue), and the central carbon atom of the glycerol (black, denoted by C-β). The radial distribution functions reveal complex structural determinants for the packing of (components of) the headgroup. The distance that is expected if the headgroups were ordered on a two-dimensional hexagonal lattice is indicated in orange.
The simplest short-range structure is formed by the TMA groups producing a single peak in the RDF at a lateral distance of  (Fig. 4, blue). Presumably this is due to the situation that the TMA group at the very top of the headgroup is least constricted in its motion by interactions with other lipid molecules. In the same fashion as above, we compare our results to the two-dimensional hexagonal lattice model (orange line in Fig. 4). For the TMA group, we find that its peak maximum is only slightly below the lipid distance in the hexagonal lattice model
  indicating that the TMA groups show a weak tendency to arrange in a nonhomogenous distribution.
The RDFs of the phosphate (red line) and the C-β atoms (black line) show more complex behavior with two and three maxima for adjacent headgroups, respectively. This behavior is related to the fact that 1), these atoms are confined by steric interactions with other lipid molecules; and 2), that lipid molecules are not rotationally symmetric.
To illustrate the complex short-range order of the headgroups we selected representative pairs of lipid molecules from MD snapshots that contribute to the peaks in the RDFs. They are displayed in Fig. 4 with arrows indicating to which peak they contribute. The first peak in the phosphate RDF at r ≃ 5.6 Å can be assigned to two directly neighboring phosphates (Fig. 4 a), whereas the second one at r ≃ 8.7 Å corresponds to two phosphates separated by a TMA group (Fig. 4 c). This TMA can either belong to one of the two lipids or be part of a third lipid. The first maximum in the C-β RDF at r ≃ 5.5 Å corresponds to pairs of lipids that are tightly packed with their lipid tails relatively parallel (Fig. 4 a). Although the peak is clearly present, its maximum is quite low, indicating that this configuration is rare. The second and most prominent maximum of the C-β RDF at r ≃ 7.2 Å belongs to a broad set of disordered adjacent lipid molecules. Fig. 4 b shows a representative configuration for this group of poorly packed, but very frequent structures. The third peak at ∼r ≃ 9.5 Å usually corresponds to two lipid molecules being separated by either a few water molecules (Fig. 4 d), or a tail of a third lipid molecule (not shown).
In summary, these results indicate that the picture of headgroups (in contrast to the lipid tails structure) being ordered like a dense two-dimensional liquid is a reasonable first-order approximation. On a closer look, however, packing effects of the asymmetric lipids and interactions of the headgroup subunits render the energy landscape of the lipids much more complex than that of a simple liquid. The impact of this complex energy landscape on dynamic processes like bilayer formation or lipid diffusion remains a topic for future studies.
Radial distribution function of lipid tails
Fig. 5 a shows the RDF of the lipid tails in slices parallel to the bilayer extracted from a 20-ns equilibrium simulation of 512 DMPC molecules. For the calculation, the C atoms of the tails have been treated as points, to determine the RDF of the tail center positions. A pair of C atoms contributing to the RDF may be part of the same lipid molecule, but not of the same tail. The results show that the RDF is a robust function for −10 Å ≲ z ≲ 10 Å, i.e., it is almost independent of the distance from the center of the bilayer at z = 0. This confirms the findings of a previous study (14,23) on 1-palmitoyl-2-oleoyl-sn-glycero-3-phosphocholine that was based on only a single MD snapshot. Hence, averaging the RDF around the central region of the bilayer, i.e., for |z| < 7.5 Å leads to a robust RDF of the lipid tails, as shown in Fig. 5 b.
FIGURE 5.

(a) Radial distribution function g(r) of the lipid tails in slices parallel to the DMPC bilayer. The value z = 0 corresponds to the center of the membrane. The value of g(r) is almost independent of z. In particular, the positions of the maxima and minima are robust properties of the lipid bilayer. (b) Slice-wise radial distribution function in panel a averaged over |z| < 7.5 Å around the center of the bilayer.
Lipid tail packing and area per lipid
The main goal of this section is to relate the experimentally measured SF to intrinsic structural quantities of the bilayer, in particular to the area per lipid AL and the radial distribution function of the lipid tails. Two problems are addressed: First, we investigate how the chain correlation peak of the SF depends on AL, and whether the latter can be estimated from the peak position and shape; and second, quantitative relations between properties of the SF and RDF shall be tested at varied AL.
RDF and SF at different AL
A patch of 512 DMPC and 11776 water molecules was first simulated for 20 ns at constant pressure, allowing us to extract the equilibrium area per lipid Aeq = 62.3 Å2 under the simulation conditions. Then, the system was simulated with the area per lipid AL being constrained between 100% and 140% of Aeq with steps of 5%. Each of these nine systems was simulated for another 20 ns. We restricted to AL ≥ Aeq, since bilayers of the size of our simulation box were found to form bends within only a few 100 ps when being constrained to AL < Aeq, rendering the simulations unsuitable for the following quantitative analysis.
Fig. 6 a shows the RDF g(r) of the nine simulations at different areas per lipid. The first maximum in the RDF a is the most likely interchain distance, which must be distinguished from the mean interchain distance 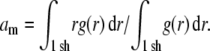 Here,
Here,  is an integral over the first shell of lipid tails, i.e., up to the first minimum of g(r). λRDF denotes the periodicity of the RDF as depicted in Fig. 6 a.
Interestingly, only the value of g(r) at the maxima and minima of the RDF depends on the area per lipid AL, but not the position of the maxima and minima or the periodicity λRDF of the RDF. This is also shown in Fig. 6 c where the position of the first maximum a of the RDF is plotted as a black solid line versus the relative increase of the area per lipid showing that a is independent of AL. Similarly, the periodicity λRDF (shaded solid line) is independent of AL. The same trend can be observed in the structure factor of the lipid tails (Fig. 6 b); with increasing AL the chain correlation becomes less pronounced, but the position of the maximum in reciprocal space q0 is almost constant. Apparently, when increasing AL, the lipid bilayer does not undergo a uniform expansion. Instead, lipid tails remain at constant relative positions and only the population of interchain distances is reduced. In other words, the bilayer responds in a lateral inhomogeneous manner to the decrease of pressure. This can be understood from the fact that the interaction between the chains is predominantly attractive.
Although interchain distances are obviously not explicitly dependent on AL, we cannot exclude that under environmental conditions (temperature, humidity, salt) that induce a different AL the chain correlation might also be affected. From our results we conclude that it is not the area per lipid itself that determines the periodicity of the RDF (or the position of the interchain correlation peak of the SF). This finding underlines the fact that for a given type of lipid (and a given temperature) the q0, a, am, and λRDF are robust properties of the bilayer. It also rules out any possibilities to deduce AL experimentally from the measured peak position of the SF.
While AL thus does not determine a and the corresponding q0, it does have an effect on the correlation length ξ = 1/γ of the chain-chain ordering as shown in Fig. 7. When increasing AL from 62.3 Å2 (1Aeq) to 74.8 Å2 (1.2Aeq), ξ decreases linearly from 5.7 Å to 4.85 Å. When pushing the bilayer even further away from equilibrium we reach a nonlinear regime where ξ seems to saturate at ∼4.8 Å. Visual inspection of the simulation trajectories showed that under such extreme conditions, the bilayer starts to rupture. Lipid molecules form clusters and water molecules penetrate into the membrane between the clusters. For  the membrane remains intact and allows us to quantify the ξ-AL dependence empirically by a simple linear model ξ(AL) = αAL + ξ0. From the simulation data, we estimate ξ0 = 9.78 Å (±0.4%), and α = −0.0674/Å (±0.8%) (Fig. 7, shaded line) by a simple linear least-squares fit. (Errors correspond to standard deviations.) This linear ξ-AL dependence can be applied to estimate the experimental area per lipid
  from the correlation length ξexp determined from the SF. A least-squares fit of the experimental SF to a Lorentzian results in ξexp = 5.74 Å (±1.4%) (see also Table 1) yielding
  ≈ 59.9 Å2 (±2.4%). Note that the value of
  refers to the experimental conditions (temperature, humidity) and not to our simulation setup. The uncertainty of 2.4% has been determined by usual error propagation and accounts for statistical errors only. Within the reported uncertainty,
  agrees with the experimentally determined value of 59.6 Å2 (25) as well as with experimental results that have been refined by simulation methods (60.6 Å2, (26)). This analysis shows that the interchain correlation length is an observable that can be quantitatively related to the area per lipid.
FIGURE 7.

Correlation length ξ = 1/γ versus the area per lipid AL in units of the equilibrium area per lipid Aeq (solid line). The error bars display standard deviations. For AL ≲ 1.20 Aeq, the membrane stays intact, allowing us to extrapolate the ξ-AL dependence (shaded line).
Determination of a and λRDF from the experimental SF
Assuming that the SF is a Lorentzian (Eq. 7), and γ/q0 ≪ 1 holds, the RDF in two dimensions can be well approximated by (23)
 |
(8) |
In our case, the term of order γ/q0 is a correction of only 7% to the first cosine. From this expression the position of the first maximum of g(r) is calculated to be at
 |
(9) |
and the period of the RDF is
 |
(10) |
To verify these relations, we employ the RDFs and SFs obtained from our simulations at different areas per lipid. The values a and λRDF as calculated by Eqs. 9 and 10 are compared to the corresponding values obtained directly from the RDF. Fig. 6 c shows these structural parameters as a function of AL in units of the average area per lipid in the equilibrium simulation Aeq. The black solid line (with circles) shows the most likely interchain distance a. The black dashed line (with circles) depicts a calculated from the SF of the lipid tails using Eqs. 9 and 3. We find favorable agreement with a deviation of ∼0.5%. In addition, the dashed black line (no symbols) shows the mean interchain distance am, which is found to be ∼9.5% larger than a and does also not depend on AL. The shaded lines in Fig. 6 c show the periodicity λRDF of the RDF as determined either from the local maxima of the RDF itself (shaded solid line), or from the SF of the lipid tails (shaded dashed line). For the latter we corrected Eq. 10 according to Eq. 3. Again, good agreement within 4% is found indicating that, indeed, the period of the RDF can be determined to high accuracy from the SF of the lipid tails.
Hence, it is straightforward to calculate the structural properties a, λRDF, and am from the measured SF. Applying the validated Eqs. 9 and 10 to the experimental SF (see Table 1) gives aexp = 5.07 Å and λexp ≃ 4.5 Å. Using the result that am is 9.5% larger than a renders the mean interchain distance under the experimental conditions to be  ≃ 5.6 Å.
Dynamic structure factor
The dynamic structure factor S(q, ω) of lipid bilayers is usually interpreted in terms of the effective three-eigenmode model, i.e., as a sum of a heat and two sound modes (see Methods for more details). Unfortunately, the sound modes are often difficult to observe in S(q, ω) as they show up only as a soft shoulder in the tails of the heat mode, rather than as a clear excitation maximum. In contrast, in the longitudinal spectrum defined by Cℓ(q, ω) = (ω2/q2)S(q, ω), the multiplication of ω2 makes the excitation (sound modes) more easily visible for analysis. Therefore we focus here on Cℓ(q, ω) as in the literature on simple fluids (30).
The longitudinal spectrum of the chains of a DMPC bilayer in the fluid Lα phase extracted from an MD simulation is shown color-coded in Fig. 8 a. In this plot, Cℓ(q, ω) has been normalized with respect to its maximum at ωm in the case of a free gas, Cℓ, f (q, ωm) = (2/π)1/2e−1v0/q, where  = kBT/M. As the spectrum is plotted in arbitrary units the normalization only corresponds to a factor of q. The mode is dispersive, with a minimum at q ∼1.4 Å−1, i.e., near the interchain correlation peak of the static SF, and its shape is in agreement with experimental (11,13) and previous molecular dynamics studies (21).
FIGURE 8.

(a) Longitudinal spectrum Cℓ(q, ω) normalized with respect to its maximum in the case of a free gas, Cℓ,f (q, ωm). (b) Dispersion curve ωm(q) determined by inelastic neutron scattering (blue) and extracted from the simulation (black), and sound mode frequency ωs(q) determined by a fit to the three-effective-eigenmode model (red). The width of the sound modes are indicated as a red-shaded area of width 2Γs(q) at around ωs(q).
The maxima of Cℓ(q, ω) yield the dispersion curve ωm(q) (Fig. 8 b, black line), which must be distinguished from the sound mode frequency ωs(q) in Eq. 6. In the same plot, the corresponding dispersion curve determined by neutron scattering (13) is shown as a blue curve, and we find good agreement in the q < 2 Å−1 range. For wavelengths shorter than typical interchain distances (q ≳ 2 Å−1), we find higher frequencies in the simulation compared to experiment. Since the force field applied in the simulation has not been parameterized to reproduce short wavelength dynamics, the agreement for q < 2 Å−1 is an important cross validation for the accuracy of MD simulations. The discrepancy between simulation and experiment in the very short wavelength regime is presumably due to the united-atom force field applied for the aliphatic carbons in the simulation. The short-range energy landscape of the force field might lack roughness due to the absence of explicit hydrogen or deuterium atoms, rendering the dynamics too rapid.
To interpret the spectrum in terms of the three-eigenmode model we have fitted the spectrum extracted from the simulation to Eq. 6. The fits turned out to be nontrivial. To perform the fit, it is necessary to choose which of the sum rules (Eq. 5) should be applied as constraints during the fit. The choice is somewhat arbitrary and has also been investigated in experimental studies on short-wavelength modes in liquid argon (29) and neon (31). The spectrum and the corresponding fits are shown for three representative wavenumbers q in Fig. 9 as black and shaded lines. We found that the shape and position of the fitted peak agrees best with the simulation results if we apply Eq. 5 with n = 0 and n = 1. In this case, we observed some difference between fit and simulation only for small ω, indicating that the narrow heat mode decays rather like 1/ω than 1/ω2 in the simulation. When additionally applying the sum rule n = 2, the three-eigenmode model is not suitable to fit the data. Applying n = 1 (Fig. 9, dotted line) or n = 0 only renders an unstable fit which is difficult to reproduce, or the shape of the fitted peak does not match the simulation.
FIGURE 9.

Longitudinal spectrum Cℓ(q, ω) (black solid line) for three representative wavenumbers: close to the hydrodynamic limit (top), at the dispersion minimum, i.e., at the reciprocal interchain distance (center), and in the very short wavelength regime (bottom). The corresponding fits to the three-effective-eigenmode model applying constraint in Eq. 5 with n = 0, 1 (shaded dashed line), or n = 1 only (shaded dotted line).
The sound mode frequency ωs(q) resulting from the fit of the three-eigenmode model to Cℓ(q, ω) from simulation is plotted as a red line in Fig. 8 b. The corresponding line width is given as a red shaded area of width 2Γs(q) around the ωs(q). Three regimes should be distinguished:
For q ≲ 1.2 Å−1, the sound mode frequency ωs(q) equals the dispersion maximum ωm(q) of Cℓ(q, ω) indicating that the peak is due to propagation of sound. In the q < 0.7 Å−1 regime, ωs increases approximately linearly with q as expected in the hydrodynamic limit.
In the q ≈ 1.4 Å−1 regime, i.e., for wavelengths similar to a typical interchain distance, the fit tends to ωs = 0, i.e., to three Lorentzians centered at ω = 0. This indicates a dispersion gap and has also been found experimentally in liquid neon (31) and liquid argon (29), and has been proposed theoretically for a system of hard spheres (28). From our results, the propagation of sound is likely to show a dispersion gap also in a lipid bilayer. (It should be noted that the fit does not tend to a propagation gap when applying constraint n = 1 only. In this case, however, the fit was more unstable and its result was unsatisfactory at the dispersion minimum q ∼ 1.4 Å−1; compare Fig. 9, center.)
In the range q ≳ 2.0 Å, the fit turned out to be unstable, and dependent on the fitted ω-range and the starting points. Therefore, we refrained from analyzing the spectrum with respect to the three-eigenmode model for the high q-range.
CONCLUSIONS
We have probed the short-range order and short wavelength dynamics of a hydrated DMPC bilayer by elastic x-ray diffraction, inelastic neutron scattering, and MD simulations. The combination of experiment and simulation offers a powerful set of tools to investigate the lipid structure and dynamics in both reciprocal and real space. Whereas experiments are essential for force-field validation and developments, simulations help to interpret and complement scattering experiments and can, in turn, initiate further experimental studies.
We stress that the methodology developed here in refining the analysis of scattering experiments by MD simulation can be used in a much more general sense, in particular also for multicomponent membranes.
We have found that the electron density as well as the SF in lateral direction as determined by simulations agree favorably with experimental results. In particular, position and correlation length of the interchain correlation peak at ≃1.39 Å were well reproduced in all simulations. Good agreement was also found for the reciprocal space mapping of the bilayer, representing correlations between tilted lipid tails and their tilt angle distribution.
The headgroups were found to display correlation, producing a peak at 0.72 Å in the SF which is, however, hard to observe in x-ray experiments. To elucidate structural determinants of the headgroups of the bilayer we analyzed RDFs of different components of headgroups and identified frequent arrangements of adjacent lipid molecules. We found that although the headgroups, in a first approximation, are arranged like a densely packed two-dimensional liquid, their asymmetry induces more complex structural arrangements. These act on the sub-headgroup level and lead to a complex effective energy landscape in which the lipids move. Experimentally, selective deuteration of the molecular components of the headgroups and corresponding contrast variation in neutron scattering of oriented membrane stacks may be used to further study this issue.
Simulations of DMPC at different areas per lipid could validate analytical expressions that relate the RDF of the lipid tails to their SF. The most likely interchain distance a, the mean interchain distance am, and period λRDF of the lipid tail RDF can be determined from the SF to very high accuracy. These three quantities proved to be robust properties of the bilayer, and surprisingly, are independent of the area per lipid. In contrast, the interchain correlation length ξ is linearly dependent on the area per lipid, and might therefore turn out to be a new observable to quantify the area per lipid.
We found the dispersive mode of the lateral spectrum as determined by MD simulations to compare well with inelastic neutron scattering experiments, in particular around the dispersion minimum. At very short wavelengths, the dynamics in the simulations are presumably slightly too rapid due to the united atom force field applied. A quantitative analysis of the spectrum in terms of the three-effective-eigenmode model is possible, although we do not find agreement over the complete q-ω range. This could be taken as an indication that the collective dynamics of the lipid chains cannot be fully described by the theory developed for simple liquids. The issue of a dispersion gap in the propagation of sound remains challenging.
Acknowledgments
We thank I. Tremmel for carefully reading the manuscript. T.S. is grateful for fruitful related collaborations with C. Münster and A. Spaar on the topic of reciprocal space mappings of lipids, and with U. Mennicke on the topic of membrane reflectivity. J.S.H. and B.L.d.G. thank R. Böckmann for support in the calculation of SFs at an early state of the project.
J.S.H. and B.L.d.G. acknowledge support by European Union grant No. LSHP-CT-2004-012189. T.S. and M.C.R. acknowledge financial support from the Deutschen Forschungsgemeinschaft through SA No. 772/8-2, and from the European Union network of excellence SOFTCOMP.
Editor: Robert Callender.
References
- 1.Warren, B. E. 1933. X-ray diffraction in long chain liquids. Phys. Rev. 44:0969–0976. [Google Scholar]
- 2.Luzzati, V. 1968. X-ray diffraction studies of lipid-water systems. In Biological Membranes. D. Chapman, editor. Academic Press, New York.
- 3.Levine, Y. K., and M. H. F. Wilkins. 1971. Structure of oriented lipid bilayers. Nature (Lond.). 230:69–72. [DOI] [PubMed] [Google Scholar]
- 4.Parsegian, V. A., R. P. Rand, N. L. Fuller, and D. C. Rau. 1986. Osmotic stress for the direct measurement of intermolecular forces. In Methods in Enzymology, Vol. 127. L. Packer, editor. Academic Press, New York. [DOI] [PubMed]
- 5.Pfeiffer, W., T. Henkel, E. Sackmann, W. Knoll, and D. Richter. 1989. Local dynamics of lipid bilayers studied by incoherent quasi-elastic neutron-scattering. Europhys. Lett. 8:201–206. [Google Scholar]
- 6.Wiener, M. C., and S. H. White. 1992. Structure of a fluid dioleoylphosphatidylcholine bilayer determined by joint refinement of x-ray and neutron diffraction data. III. Complete structure. Biophys. J. 61:434–447. [DOI] [PMC free article] [PubMed] [Google Scholar]
- 7.Lemmich, J., K. Mortensen, J. H. Ipsen, T. Hønger, R. Bauer, and O. G. Mouritsen. 1996. Small-angle neutron scattering from multilamellar lipid bilayers: theory, model, and experiment. Phys. Rev. E. 53:5169–5180. [DOI] [PubMed] [Google Scholar]
- 8.Katsaras, J., and T. Gutberlet. 2000. Lipid Bilayers: Structure and Interactions. Springer, New York.
- 9.Fragneto, G., T. Charitat, F. Graner, K. Mecke, L. Perino-Gallice, and E. Bellet-Amalric. 2001. A fluid floating bilayer. Europhys. Lett. 53:100–106. [Google Scholar]
- 10.Fattal, D. R., and A. Ben-Shaul. 1994. Mean-field calculations of chain packing and conformational statistics in lipid bilayers: comparison with experiments and molecular dynamics studies. Biophys. J. 67:985–995. [PMC free article] [PubMed] [Google Scholar]
- 11.Chen, S. H., C. Y. Liao, H. W. Huang, T. M. Weiss, M. C. Bellisent-Funel, and F. Sette. 2001. Collective dynamics in fully hydrated phospholipid bilayers studied by inelastic x-ray scattering. Phys. Rev. Lett. 86:740–743. [DOI] [PubMed] [Google Scholar]
- 12.Weiss, T. M., P.-J. Chen, H. Sinn, E. E. Alp, S.-H. Chen, and H. W. Huang. 2003. Collective chain dynamics in lipid bilayers by inelastic x-ray scattering. Biophys. J. 84:3767–3776. [DOI] [PMC free article] [PubMed] [Google Scholar]
- 13.Rheinstädter, M. C., C. Ollinger, G. Fragneto, F. Demmel, and T. Salditt. 2004. Collective dynamics of lipid membranes studied by inelastic neutron scattering. Phys. Rev. Lett. 93:108107. [DOI] [PubMed] [Google Scholar]
- 14.Heller, H., M. Schäfer, and K. Schulten. 1993. Molecular-dynamics simulation of a bilayer of 200 lipids in the gel and in the liquid-crystal phases. J. Phys. Chem. 97:8343–8360. [Google Scholar]
- 15.Egberts, E., S. J. Marrink, and H. J. C. Berendsen. 1994. Molecular-dynamics simulation of a phospholipid membrane. Eur. Biophys. J. 22:423–436. [DOI] [PubMed] [Google Scholar]
- 16.Marrink, S.-J., and H. J. C. Berendsen. 1994. Simulation of water transport through a lipid-membrane. J. Phys. Chem. 98:4155–4168. [Google Scholar]
- 17.Tieleman, D. P., and H. J. C. Berendsen. 1996. Molecular dynamics simulations of fully hydrated DPPC with different macroscopic boundary conditions and parameters. J. Chem. Phys. 105:4871–4880. [Google Scholar]
- 18.Marrink, S. J., and H. J. C. Berendsen. 1996. Permeation process of small molecules across lipid membranes studied by molecular dynamics simulations. J. Phys. Chem. 100:16729–16738. [Google Scholar]
- 19.Lindahl, E., and O. Edholm. 2000. Mesoscopic undulations and thickness fluctuations in lipid bilayers from molecular dynamics simulations. Biophys. J. 79:426–433. [DOI] [PMC free article] [PubMed] [Google Scholar]
- 20.Marrink, S.-J., E. Lindahl, O. Edholm, and A. E. Mark. 2001. Simulation of the spontaneous aggregation of phospholipids into bilayers. J. Am. Chem. Soc. 123:8638–8639. [DOI] [PubMed] [Google Scholar]
- 21.Tarek, M., D. J. Tobias, S.-H. Chen, and M. L. Klein. 2001. Short wavelength collective dynamics in phospholipid bilayers: a molecular dynamics study. Phys. Rev. Lett. 87:238101. [DOI] [PubMed] [Google Scholar]
- 22.Hub, J. S., and B. L. de Groot. 2006. Does CO2 permeate through aquaporin-1? Biophys. J. 91:842–848. [DOI] [PMC free article] [PubMed] [Google Scholar]
- 23.Spaar, A., and T. Salditt. 2003. Short-range order of hydrocarbon chains in fluid phospholipid bilayers studied by x-ray diffraction from highly oriented membranes. Biophys. J. 85:1576–1584. [DOI] [PMC free article] [PubMed] [Google Scholar]
- 24.McIntosh, T. J., and S. A. Simon. 1986. Area per molecule and distribution of water in fully hydrated dilauroylphosphatidylethanolamine bilayers. Biochemistry. 25:4948–4952. [DOI] [PubMed] [Google Scholar]
- 25.Nagle, J. F., and S. Tristram-Nagle. 2000. Structure of lipid bilayers. Biochim. Biophys. Acta. 1469:159–195. [DOI] [PMC free article] [PubMed] [Google Scholar]
- 26.Klauda, J. B., N. Kucerka, B. R. Brooks, R. W. Pastor, and J. F. Nagle. 2006. Simulation-based methods for interpreting x-ray data from lipid bilayers. Biophys. J. 90:796–807. [DOI] [PMC free article] [PubMed] [Google Scholar]
- 27.Paula, S., A. G. Volkov, A. N. V. Hoek, T. H. Haines, and D. W. Deamer. 1996. Permeation of protons, potassium ions, and small polar molecules through phospholipid bilayers as a function of membrane thickness. Biophys. J. 70:339–348. [DOI] [PMC free article] [PubMed] [Google Scholar]
- 28.de Schepper, I. M., and E. G. D. Cohen. 1982. Very-short-wavelength collective modes in fluids. J. Stat. Phys. 27:223–281. [Google Scholar]
- 29.de Schepper, I. M., P. Verkerk, A. A. van Well, and L. A. de Graaf. 1983. Short-wavelength sound modes in liquid argon. Phys. Rev. Lett. 50:974–977. [Google Scholar]
- 30.van Well, A. A., P. Verkerk, L. A. de Graaf, J.-B. Suck, and J. R. D. Copley. 1985. Density fluctuations in liquid argon: coherent dynamic structure factor along the 120-K isotherm obtained by neutron scattering. Phys. Rev. A. 31:3391–3414. [DOI] [PubMed] [Google Scholar]
- 31.van Well, A. A., and L. A. de Graaf. 1985. Density fluctuations in liquid neon studied by neutron scattering. Phys. Rev. A. 32:2396–2412. [DOI] [PubMed] [Google Scholar]
- 32.Berger, O., O. Edholm, and F. Jähnig. 1997. Molecular dynamics simulations of a fluid bilayer of dipalmitoylphosphatidylcholine at full hydration, constant pressure, and constant temperature. Biophys. J. 72:2002–2013. [DOI] [PMC free article] [PubMed] [Google Scholar]
- 33.Jorgensen, W. L., J. Chandrasekhar, J. D. Madura, R. W. Impey, and M. L. Klein. 1983. Comparison of simple potential functions for simulating liquid water. J. Chem. Phys. 79:926–935. [Google Scholar]
- 34.Lindahl, E., B. Hess, and D. Van der Spoel. 2001. GROMACS 3.0: a package for molecular simulation and trajectory analysis. J. Mol. Model. (Online). 7:306–317 (Internet). [Google Scholar]
- 35.Van der Spoel, D., E. Lindahl, B. Hess, G. Groenhof, A. E. Mark, and H. J. C. Berendsen. 2005. GROMACS: fast, flexible and free. J. Comput. Chem. 26:701–719. [DOI] [PubMed] [Google Scholar]
- 36.Darden, T., D. York, and L. Pedersen. 1993. Particle mesh Ewald: an N·log(N) method for Ewald sums in large systems. J. Chem. Phys. 98:10089–10092. [Google Scholar]
- 37.Essmann, U., L. Perera, M. L. Berkowitz, T. Darden, H. Lee, and L. G. Pedersen. 1995. A smooth particle mesh Ewald potential. J. Chem. Phys. 103:8577–8592. [Google Scholar]
- 38.Miyamoto, S., and P. A. Kollman. 1992. SETTLE: An analytical version of the SHAKE and RATTLE algorithms for rigid water models. J. Comput. Chem. 13:952–962. [Google Scholar]
- 39.Hess, B., H. Bekker, H. J. C. Berendsen, and J. G. E. M. Fraaije. 1997. LINCS: a linear constraint solver for molecular simulations. J. Comput. Chem. 18:1463–1472. [Google Scholar]
- 40.Berendsen, H. J. C., J. P. M. Postma, A. DiNola, and J. R. Haak. 1984. Molecular dynamics with coupling to an external bath. J. Chem. Phys. 81:3684–3690. [Google Scholar]
- 41.Prince, E. 2004. International Tables for Crystallography, Vol. C, 3rd Ed. Springer, New York.
- 42.Mennicke, U., D. Constantin, and T. Salditt. 2006. Structure and interaction potentials in solid-supported lipid membranes studied by x-ray reflectivity at varied osmotic pressure. Eur. Phys. J. E. 20:221–230. [DOI] [PubMed] [Google Scholar]
- 43.Mennicke, U., and T. Salditt. 2002. Preparation of solid-supported lipid bilayers by spin-coating. Langmuir. 18:8172–8177. [Google Scholar]
- 44.Constantin, D., U. Mennicke, C. Li, and T. Salditt. 2003. Solid-supported lipid multilayers: structure factor and fluctuations. Eur. Phys. J. E. 12:283–290. [DOI] [PubMed] [Google Scholar]
- 45.Salditt, T., C. Li, A. Spaar, and U. Mennicke. 2002. X-ray reflectivity of solid-supported, multilamellar membranes. Eur. Phys. J. E. 7:105–116. [Google Scholar]
- 46.Münster, C. 2000. Antibiotic peptides in phospholipids. Structure analysis using diffraction methods. PhD thesis. Sektion Physik, Ludwig-Maximilians-Universität München.
- 47.Benz, R. W., F. Castro-Román, D. J. Tobias, and S. H. White. 2005. Experimental validation of molecular dynamics simulations of lipid bilayers: a new approach. Biophys. J. 88:805–817. [DOI] [PMC free article] [PubMed] [Google Scholar]
- 48.Castro-Román, F., R. W. Benz, S. H. White, and D. J. Tobias. 2006. Investigation of finite system-size effects in molecular dynamics simulations of lipid bilayers. J. Phys. Chem. B. 110:24157–24164. [DOI] [PubMed] [Google Scholar]
- 49.Münster, C., J. Lu, B. Bechinger, and T. Salditt. 2000. Grazing incidence x-ray diffraction of highly aligned phospholipid membranes containing the antimicrobial peptide magainin 2. Eur. Biophys. J. 28:683–688. [DOI] [PubMed] [Google Scholar]