

Abstract
Latent profile analysis was used to summarize profiles of depressive symptoms among a nationally representative sample of U.S.-born and Caribbean-born Blacks. Analyses are based on the responses of 4,915 African Americans and Caribbean Blacks from the National Survey of American Life. A high symptoms and a low symptoms class were identified. Age, gender, negative social interaction within the individual's social network (e.g., conflict demands, criticism) and racial discrimination were associated with depressive symptoms in the low symptoms class, whereas socioeconomic status, gender, emotional support and negative interaction were associated with depressive symptoms in the high symptoms class. The findings demonstrate the heterogeneity within the Black population in the USA and the distinct sociodemographic, family network and stress correlates of depressive symptoms for each latent class.
Keywords: mental health, depressive symptoms, race, socioeconomic status, USA, Caribbean, African-American
Introduction
The Black population in the United States is becoming more diverse each year, fueled in large part, by the immigration of Blacks of Caribbean descent. In 1990, Blacks in the U.S. totaled about 30 million; in 2000, the total increased to 36.2 million (U.S. Census, 2005b). The 2000 census estimated that there were almost 1,320,000 Americans of English-speaking West Indian ancestries, and an additional 548,200 of Haitian ancestry, making up 7% of all Blacks in the United States (U.S. Census Bureau, 2005a). Although there are commonalities in life experiences associated with being Black in the United States, there is also considerable heterogeneity. Cultural, contextual and demographic differences between African Americans and Blacks of Caribbean descent may constitute important risk and protective factors for mental health. Unfortunately, few studies of mental health among Blacks consider the demographic diversity within this group. As a departure, this investigation of the mental health status of the Black population employs an analysis technique to identify the risk and protective profiles of depressive symptoms among a nationally representative and ethnically diverse sample of Black Americans.
Background
Two bodies of literature are useful for framing the current investigation of the profiles of depressive symptoms among Black Americans. The first focuses on explanations for the “healthy immigrant effect” in which Caribbean immigrants are posited to have better health than U.S.-born Blacks. This health advantage is attributed to a positive selection effect of migration whereby healthier individuals are more likely to immigrate and thus, as a group are healthier than native-born individuals (Singh & Siahpush, 2002). This health advantage is maintained by socioeconomic advantages of Caribbean immigrants including, on average, higher levels of education than native-born African Americans (Logan & Deane, 2003). Caribbean Blacks are believed to benefit from favorable work ethic perceptions held by white employers (Dodoo, 1997) which translate into more favorable employment profiles such as higher employment rates, working more hours, and higher incomes (Waters, 1999). The accumulation of more social and cultural capital are potential factors that may explain the noted immigrant health advantage. This advantage, however, erodes with length of residence in the U.S. and is especially evident in the reports of encounters with racism and in lowered perceptions of individual and group identity and poorer health outcomes of second generation immigrants (Waters, 1999).
The second body of literature explicitly addresses the negative effects of racism and racial stratification on health and well-being. This work contends that racism in the U.S. has been institutionalized by the sanctioning of unequal access to resources and services through policies, priorities, and accepted practices (Hummer, 1996; Williams & Collins, 2001). Under racialized systems of power and privilege, racial minorities are subject to inequalities in economic resources, job opportunities, and political power. Racial context (i.e., minority-white versus majority-white settings) has been identified as a mechanism whereby “race” affects the health status of both Caribbean-born and U.S.-born Blacks (Read & Emerson, 2005). Immigrants from minority-white areas will have a health advantage over U.S.-born Blacks (i.e., from majority-white racial contexts) due to their more limited exposure to racism. Further, because non-white and non-native populations tend to be more economically disadvantaged, the growing heterogeneity among Black Americans may introduce additional dimensions of stratification within this group (Hernandez, 2004). Although Caribbean immigrants may have an initial health advantage as new arrivals, with longer residency they are exposed to discrimination and other stressful life events that erode their physical and mental health (Feagin & McKinney, 2003; Kreiger, 2000; Williams, 2001).
Race, Ethnicity and Depressive Symptoms
Studies of depressive symptoms among African Americans have produced inconsistent findings. Although most investigations report more depressive symptoms among Blacks as compared to whites (Jackson, 1997; Myers, Lesser, Rodriguez et al., 2002), a few report no racial differences (Gallo, Cooper-Patrick, & Lesikar, 1998; Husaini, Castor, Linn et al., 1990). Despite the suggestion that socioeconomic status may explain these differences (Frerichs, Aneshensel, & Clark, 1981; Riolo et al., 2005), other studies find race differences even after controlling for SES (Zhang & Snowden, 1999). These conflicting findings may partially be explained by a reliance on earlier epidemiological studies using geographically restricted community or clinical samples (DeVellis, 1993; Krishnan, Delong, Kraemer, et al., 2002; Patten, 2000) which have limited generalizability. In addition, community-based samples, such as the Epidemiological Catchment Area Study (Regier et al., 1984), reflect the demographic and cultural characteristics of specific geographic locations that cannot be extrapolated to the national experience (Kessler, McGonagle, Zhao, et al., 1994).
The few studies of depressive symptoms exclusively among Caribbean Blacks have produced mixed findings as well. Studies conducted in England reported higher depressive symptoms (Nazroo, 1997) and depressive disorders (Shaw et al., 1999) among Caribbean immigrants compared to the general population. A study examining depression rates among Black women in the Washington, DC area found lower rates of depression among Caribbean-born women compared to their U.S.-born counterparts (Miranda, Siddique, Belin, & Kohn-Wood, 2005). Finally, a national study that included a small sample of Caribbean Blacks found that they reported higher levels of stress and psychological distress than native-born Blacks (Williams, 2000). Unfortunately, findings from these studies have limited generalizability to Blacks in the U.S. due to small sample sizes (Williams, 2000) and a focus on specific geographic locations (Miranda et al., 2005) and international (foreign) contexts (Nazroo, 1997; Shaw et al., 1999).
Social Relationships, Stress and Mental Health
A large body of research indicates that better mental health and well-being is associated with access to social resources in the form of spouses, family members, and friends who provide psychological and tangible support (Cohen & Wills, 1985; House, Umberson, & Landis, 1988). However, not all social relationships are positive or necessarily beneficial. Negative interactions (e.g., conflict, excessive demands, criticism) are a direct source of stress that have serious consequences for mental health. In fact, unpleasant encounters with social network members arouse more distress than do other types of stress (Bolger, DeLongis, Kessler, & Schilling, 1989; Zautra, Burleson, Matt, Roth, & Burrows, 1994), persist over a longer period of time (Bolger et al., 1989), and their harmful effects on mental health often outweigh the positive benefits of social support (Gray & Keith, 2003; Lincoln, Chatters, & Taylor, 2003, 2005).
In addition to stressors arising from negative interactions within one's social networks, members of minority groups also experience negative social exchanges in other contexts. Perceived discrimination may be one of the most endemic and enduring stressors facing minority groups in the United States. Blacks in the United States experience discrimination in a broad range of contexts in society and these incidents can induce considerable distress (Essed, 1991; Feagin, 1991). Experiences of unfair treatment are associated with a variety of mental health outcomes, including psychological distress (Williams, 2000; Williams & Chung, forthcoming) and depression (Kessler, Mickelson, & Williams, 1999) and are a significant predictor of mental health even after controlling for socioeconomic status (Williams et al., 1997).
Focus of the Present Study
The present investigation of depressive symptom profiles within the Black population has several advantages. First, researchers have typically used variable-based statistical models such as linear or logistic regression analyses to examine the relationship between race/ethnicity and depressive symptoms. While these statistical models have been appropriate for the research questions addressed, they often make the assumption that racial groups are homogenous entities and that race itself is static and monolithic. In the case of Black Americans, in particular, this has meant that diversity within the group has been typically ignored.
The current approach, however, utilizes latent profile analysis to derive risk profiles that describe how demographic, family network and stress variables are associated with depressive symptoms among specific sub-groups within a population. Second, due to the expense of sampling and screening procedures, only a handful of prior studies are based on national probability samples that reflect the full geographic distribution of the Black American population. In contrast, this study uses a national probability sample of African Americans and Caribbean Blacks which allows for both the ability to examine differences in depressive symptoms and distinctive symptom profiles and wider generalizability of study findings.
Methods
Data
The National Survey of American Life: Coping with Stress in the 21st Century (NSAL) was collected by the Program for Research on Black Americans at the University of Michigan's Institute for Social Research. The NSAL focuses on the physical, emotional, mental, structural, and economic conditions of African Americans, with a major emphasis on mental health and mental illness. The field work for the study was completed by the Institute of Social Research's Survey Research Center, in cooperation with the Program for Research on Black Americans. The sample of the NSAL consists of 64 primary sampling units (PSUs). Fifty-six of these primary areas overlap substantially with existing Survey Research Center's National Sample primary areas. The remaining eight primary areas were chosen from the South in order for the sample to represent African Americans in the proportion in which they are distributed nationally. The interviews were face-to-face and conducted within respondents' homes; respondents were compensated for their time. The data collection was conducted from 2001 to 2003. A total of 6,082 face-to-face interviews were conducted with persons aged 18 or older, including 3,570 African Americans, 1,621 Blacks of Caribbean descent and 891 non-Hispanic whites. The overall response rate is 71.3%. The present analyses are based on complete data for 4,915 African American and Caribbean Black respondents (18+ years). The average age is 42.17 years (SD = 15.96). Approximately 63% of the respondents are women and 68.4% are African Americans (e.g., U.S.-born Blacks, non-Caribbean decent). Approximately 69% of respondents live in the South and about 28% of Caribbean respondents are U.S.-born. Three out of 10 (30%) of the respondents are married, the average number of years of education is 12.56 years (SD = 2.66), and the average annual income is $35,402 (SD = $35,198).
Measures
Depressive symptoms are measured with 12 items from the Center for Epidemiological Studies-Depression scale (CES-D) (Radloff, 1977). This abbreviated CES-D has been found to have acceptable reliability and a similar factor structure compared to the original version. Item responses are coded 1 (“hardly ever) to 3 (“most of the time”). These 12 items measure the extent to which respondents had trouble keeping their mind on tasks, enjoyed life, had crying spells, could not get going, felt depressed, hopeful, restless, happy, as good as other people, that everything was an effort, that people were unfriendly, and that people dislike them. The mean was computed across the 12 items (Cronbach's α = 0.76 for African Americans and 0.74 for Caribbean Blacks), resulting in a continuous measure of depressive symptoms; a high score indicates a greater number of depressive symptoms.
Social support and life stressors are traditionally thought to be risk and protective factors that link social location factors like race and socioeconomic status to mental health (Lincoln et al., 2005). Measures of social relations and life stress (i.e., perceived racial discrimination) are included in the analysis. Two family network variables are included as covariates, emotional support and negative interaction. Emotional support from family is measured by an index comprised of the questions: “How often do your family members listen to your problems?” and “How often do your family members express interest and concern in your well-being?” Frequency of negative interaction with family members is measured by an index comprised of the questions: “Other than your (spouse/partner) how often do your family members: 1) make too many demands on you? 2) criticize you and the things you do? and 3) try to take advantage of you?” The response categories are “very often,” “fairly often,” “not too often,” and “never.” A high score on these items indicate higher levels of emotional support and negative interaction with family members.
Our measure of major experiences of racial discrimination is a categorical variable based on experiences of unfair treatment over the course of one's life. Respondents indicated the number of times that they had the following experiences of unfair treatment because of their race: 1) been fired, 2) not hired for a job, 3) denied a promotion, 4) stopped, searched, questioned or abused by the police, 5) discouraged by a teacher or advisor from continuing your education, 6) prevented from moving into a neighborhood because the landlord or a realtor refused to sell or rent you a house or apartment, 7) moved into a neighborhood where neighbors made life difficult for you or your family, 8) denied a loan, and 9) received service from someone such as a plumber or car mechanic that was worse than what other people get. A higher score on this summary scale indicates higher levels of discrimination.
Eight demographic variables are used in this analysis as covariates including ethnicity (African American = 0; Caribbean Black = 1), age, education and family income (measured continuously), gender (male = 0; female = 1), marital status (married = 0; unmarried = 1), and region (South = 0; other = 1). Nativity status is measured by a series of binary variables representing those African Americans and Caribbean Blacks who are U.S.-born (reference category), and those Caribbean Blacks who have resided in the U.S. from 0–10 years, 11–20 years, and more than 20 years. All of the analyses utilize analytic weights to match the sample to the African American and Caribbean Black adult population. Standard error estimates are corrected for complex sample design (i.e., clustering and stratification).
Analysis Strategy
This study uses latent profile analysis (LPA) to identify distinct profiles of depressive symptoms among respondents. The latent profile analysis was accomplished using Mplus version 4.11. Latent profile analysis is a “person-centered” approach which is designed to divide the population under study into a set of latent subpopulations that share a distinct interpretable pattern of relationships among the indicators (Meiser & Ohrt, 1996). Because membership in the subpopulation is generally unknown to the researcher, a latent categorical variable (composed of ‘classes’) is assumed to exist and must be inferred from the data. These classes represent subgroups of individuals who are similar to each other on the variables entered into the analysis, and different from individuals in the other subgroups. We performed LPA to identify classes of individuals based on their demographic profiles, family relations and major experiences of racial discrimination. This technique capitalizes on the associations between the variables entered in the model, allowing researchers to see how they operate together to create risk and protective ‘profiles.’ This is in contrast to variable-based models that use predictive approaches in which shared variance among the predictors allow only some to appear to be associated with the outcome, although in actuality they all may be. Logistic regression models were used to examine the associations between risk profiles and the latent classes. Finally, to examine the overall differences in profile characteristics among the classes, we used analysis of variance (ANOVA) for continuous variables and χ2 tests for categorical variables. The Cramer's V was also calculated as effect size estimates. Cramer's V is a correlation coefficient, ranging from 0 to 1, based on the Chi-square statistic. All tests of difference were performed in SPSS 13.0.
Results
Overall, African Americans report a higher mean number of depressive symptoms (6.78) compared to Caribbean Blacks (6.07) [data not shown]. Data in Table 1 indicates that African Americans report less income on average ($32,248) compared to Caribbean Blacks ($42,239), fewer years of education (12.33 years vs. 13.03 years:), older age (42.74 years compared to 40.94 years), and are more likely to be unmarried (73% vs. 65%), female (65% vs. 60%), and to live in the South (66% vs. 28%). All of these differences are statistically significant. There are no significant differences for reports of racial discrimination, emotional support, or negative interaction involving family members. Finally, the nativity profile for Caribbean Blacks indicates that 27.7% are U.S.-born and approximately 18% have resided in the U.S. for less than 10 years.
Table 1.
Characteristics of the Sample (N = 4,915)
| African American (N = 3,361) |
Caribbean Black (N = 1,554) |
||||
|---|---|---|---|---|---|
| Variable | Frequency | % | Frequency | % | |
| Sex | Male | 1,188 | 35.3 | 621 | 40.0 |
| Female | 2,173 | 64.7 | 933 | 60.0 | |
| Age | 18-24 | 468 | 13.9 | 240 | 15.4 |
| 25-34 | 720 | 21.4 | 357 | 23.0 | |
| 35-44 | 798 | 23.7 | 403 | 25.9 | |
| 45-54 | 617 | 18.4 | 263 | 16.9 | |
| 55-64 | 354 | 10.5 | 149 | 9.6 | |
| 65-74 | 272 | 8.1 | 96 | 6.2 | |
| 75+ | 132 | 3.9 | 46 | 3.0 | |
| Household Income | |||||
| Less than $200 | 47 | 1.4 | 12 | .8 | |
| $200-$9,999 | 563 | 16.8 | 138 | 8.9 | |
| 10,000-$14,999 | 383 | 11.4 | 109 | 7.0 | |
| $15,000-$19,999 | 438 | 13.0 | 156 | 10.0 | |
| $20,000-$24,999 | 256 | 7.6 | 135 | 8.7 | |
| $25,000-$29,999 | 304 | 9.0 | 154 | 9.9 | |
| $30,000-$39,999 | 404 | 12.0 | 235 | 15.1 | |
| $40,000-$59,999 | 494 | 14.7 | 255 | 16.4 | |
| $60,000-$79,999 | 260 | 7.7 | 170 | 10.9 | |
| $80,000-$99,999 | 108 | 3.2 | 83 | 5.3 | |
| $100,000-$149,999 | 68 | 2.0 | 78 | 5.0 | |
| $150,000+ | 36 | 1.1 | 29 | 1.9 | |
| Education | 0-8 years | 211 | 6.3 | 94 | 6.0 |
| 9-11 years | 650 | 19.3 | 191 | 12.3 | |
| 12 years | 1,277 | 38.0 | 463 | 29.8 | |
| 13-15 years | 765 | 22.8 | 428 | 27.5 | |
| 16 years | 270 | 8.0 | 207 | 13.3 | |
| 17+ years | 188 | 5.6 | 171 | 11.0 | |
| Marital Status | Married | 916 | 27.3 | 544 | 35.0 |
| Partner | 251 | 7.5 | 128 | 8.2 | |
| Separated | 269 | 8.0 | 118 | 7.6 | |
| Divorced | 489 | 14.5 | 170 | 10.9 | |
| Widowed | 327 | 9.7 | 74 | 4.8 | |
| Never Married | 1,109 | 33.0 | 520 | 33.5 | |
| Region | Northeast | 393 | 11.7 | 1,086 | 69.9 |
| Midwest | 531 | 15.8 | 11 | .7 | |
| South | 2,210 | 65.8 | 439 | 28.2 | |
| West | 227 | 6.8 | 18 | 1.2 | |
| Nativity | US born | 3,361 | 100.0 | 430 | 27.7 |
| 0-10 years | 0 | 0 | 278 | 17.9 | |
| 11-20 years | 0 | 0 | 349 | 22.5 | |
| 20+ years | 0 | 0 | 497 | 32.0 | |
| Emotional Support | Very often | 1,043 | 31.0 | 437 | 28.1 |
| Fairly often | 1,482 | 44.1 | 684 | 44.0 | |
| Not too often | 661 | 19.7 | 367 | 23.6 | |
| Never | 175 | 5.2 | 66 | 4.2 | |
| Negative Interaction | Never | 1,827 | 54.4 | 814 | 52.4 |
| Not too often | 1,088 | 32.4 | 534 | 34.4 | |
| Fairly often | 355 | 10.6 | 171 | 11.0 | |
| Very often | 91 | 2.7 | 35 | 2.3 | |
| Discrimination | 0 events | 2,020 | 60.1 | 955 | 61.5 |
| 1 event | 420 | 12.5 | 162 | 10.4 | |
| 2-5 events | 517 | 15.4 | 256 | 16.5 | |
| 6+ events | 404 | 12.0 | 181 | 11.6 | |
| Depressive Symptoms | 0 symptoms | 440 | 13.1 | 210 | 13.5 |
| 1-11 symptoms | 2,270 | 67.5 | 1,115 | 71.8 | |
| 12-20 symptoms | 543 | 16.2 | 203 | 13.1 | |
| 21-33 symptoms | 108 | 3.2 | 26 | 1.7 | |
The model was specified such that means and variances among the covariates were estimated within each class while the correlations between covariates were not estimated, thus specifying a latent profile model. Bayesian Information Criterion (BIC) scores are consulted to determine the best-fitting model; lower BIC scores indicate better fit. Additionally, the Lo-Mendell-Rubin likelihood ratio test of model fit is used; it compares the estimated model to a model that has one less class (Lo, Mendell, & Rubin, 2001). The Lo-Mendell-Rubin gives a p-value that is the probability that a model with one less class generated the data. Thus, a low p-value indicates the estimated model fits the data better than the model with one less class (Muthén & Muthén, 2000). The number of latent classes is determined iteratively, specifying an increasing number of classes and examining the goodness-of-fit indices, interpretability of the results, and meaningfulness of the classes.
For level of depressive symptoms, comparisons among one-class (BIC = 269,449), two-class (BIC = 29,152), and three-class (BIC = 28,932) models indicated that a three-class model was the best fit to the data. However, the additional third class resulted in a splitting of a well-interpretable second class into two poorly interpretable classes. Specifically, the additional class resulted in a reduction of the average across-class probabilities and the entropy, which is a standardized summary measure of the classification accuracy of placing participants into classes based on their model-based (i.e., posterior ) probabilities. Moreover, the third class did not result in any significant relationships between the covariates and depressive symptoms in the regression model. Finally, the Lo-Mendell-Rubin was significant for the two-class model (p < .001), but not for the three-class model (p < .329). Accordingly, we decided to adopt the two-class model.
Estimated population average probabilities of class membership for the two classes were derived from the model-based probabilities for all respondents to be in each class (each respondent has a probability of membership for each of the two classes that sums to 1.00). The average across-class probabilities were 0.82 for class one and 0.90 for class two, suggesting good definition of class membership. Accordingly, individuals in the sample have, on average, a relatively high probability of being a member of the class to which they have been assigned. While there are no specific guidelines regarding acceptable probability levels for determining class membership, some have suggested that each class should differ from others with respect to at least one model parameter (Greenbaum et al., 2005). The results from the present analysis meet these criteria. Overall, the probabilities associated with class assignment indicted that the classes were well-differentiated.
Identification of Profile Groups and Within-Class Variation
Figure 1 shows the item endorsement profiles for the 12 depressive symptoms items listed along the x-axis. The figure shows two latent classes (unobserved groups) of individuals who are homogeneous within classes and heterogeneous between classes. Respondents classified in Class One have relatively low endorsement for all twelve items, while those in Class Two have relatively higher endorsement for items 3 (depressed), 6 (sleep was restless), and 7 (felt happy).
Figure 1.

Endorsement Profile: Depressive Symptoms
The ANOVA and χ2 tests in Table 2 show significant overall differences in the characteristics of members of the two latent profile classes. Results from the ANOVA indicate that one profile, referred to as the “low symptoms” class, consists of respondents who have fewer depressive symptoms, higher socioeconomic status, are older and have more supportive interactions with family members. The χ2 test of difference indicates that the low symptoms class has a lower proportion of African Americans, U.S. born Caribbean Blacks, women, respondents who are unmarried and who live in the South. Despite higher levels of perceived racial discrimination compared to Class Two, we considered this group the lowest risk because of its combination of high socioeconomic status and emotional support and low levels of negative interaction within their family network. Members of Class Two, the “high symptoms” class, were at higher risk for depression indicated by the higher number of depressive symptoms, lower socioeconomic status, and higher levels of negative interaction with family members.
Table 2.
Comparison of Characteristics between Classes Weighted by Class Probabilities (Means)
| Low Symptoms (N = 3,044) |
High Symptoms (N = 1,871) |
||||
|---|---|---|---|---|---|
| ANOVA test for overall difference |
|||||
| Mean | Mean | F-statistic | P value | ||
| CES-D | 3.19 | 10.78 | 9,004.35 | 0.000 | |
| Education | 12.91 | 11.99 | 229.36 | 0.000 | |
| Income | $41,040 | $26,064 | 217.97 | 0.000 | |
| Age | 43.63 | 39.64 | 25.85 | 0.000 | |
| Emotional Support | 3.27 | 3.20 | 34.83 | 0.000 | |
| Negative Interaction | 1.76 | 1.98 | 127.01 | 0.000 | |
| Discrimination | 0.92 | 0.82 | 7.399 | 0.007 | |
| χ2 test for overall difference |
|||||
| Proportion % | Proportion % | χ2 | Cramer's V | P value | |
| African American | 92 | 94 | 44.723 | 0.095 | 0.000 |
| Married | 39 | 27 | 57.076 | 0.108 | 0.000 |
| Female | 51 | 61 | 67.469 | 0.117 | 0.000 |
| South | 54 | 56 | 8.193 | 0.041 | 0.004 |
| Nativity (US born is reference ) | |||||
| 0-10 Years | 201 | 77 | 13.439 | 0.052 | 0.000 |
| 11-20 Years | 223 | 126 | 0.615 | 0.011 | 0.433 |
| 20+ Years | 338 | 159 | 8.656 | 0.042 | 0.003 |
p < .001
p < .01
The coefficients for the effects of the demographic, family network and discrimination variables on depressive symptoms are presented in Table 3. Respondents in the two classes show varying associations with the examined risk and protective factors. Both the low symptoms and the high symptoms classes are associated with negative interaction, meaning that frequent experiences of negative interaction with family members is associated with higher levels of depressive symptoms. The magnitude of the effect of negative interaction on depressive symptoms is stronger in the high symptoms class compared to the low symptoms class. However, the correlates of depressive symptoms are quite distinct across the two classes (Table 3). In the low symptoms class, persons of younger age, male gender, and who experience negative interaction with family and racial discrimination report more depressive symptoms compared to their counterparts within the same class. In the high symptoms class, respondents with less education and income, women, and those experiencing less emotional support and more negative interaction with their family members report higher levels of depressive symptoms compared to their counterparts in the same class.
Table 3.
Coefficients for Effects of Covariates on Depressive Symptoms
| Low Symptoms |
High Symptoms |
|||||
|---|---|---|---|---|---|---|
| Variable | b | B | SE | b | B | SE |
| African American | 0.018 | 0.002 | 0.360 | 0.972 | 0.040 | 1.632 |
| Nativity (US Born is reference ) | ||||||
| 0-10 Years | 0.628 | 0.033 | 0.690 | 3.235 | 0.048 | 4.029 |
| 11-20 Years | −0.659 | −0.032 | 0.640 | −2.664 | −0.051 | 1.519 |
| 20+ Years | −0.034 | −0.002 | 0.470 | −1.287 | −0.028 | 1.863 |
| Education | −0.082 | −0.082 | 0.044 | −0.334 | −0.141* | 0.130 |
| Income | −0.062 | −0.066 | 0.044 | −0.202 | −0.095* | 0.108 |
| Age | −0.035 | −0.223*** | 0.006 | −0.009 | −0.026 | 0.014 |
| Unmarried | 0.165 | 0.032 | 0.215 | −0.252 | −0.020 | 0.472 |
| Female | −0.347 | −0.069* | 0.184 | 1.043 | 0.090* | 0.428 |
| Non-South | 0.402 | 0.080 | 0.227 | 0.326 | 0.029 | 0.444 |
| Emotional Support | −0.076 | −0.021 | 0.171 | −1.070 | −0.142* | 0.415 |
| Negative Interaction | 0.595 | 0.168** | 0.135 | 1.466 | 0.211** | 0.291 |
| Discrimination | 0.198 | 0.091* | 0.087 | 0.539 | 0.105 | 0.303 |
Note:
p < .05
p < .01
p < .001
Association of Profile Group Membership: Between-class Variation
A logistic regression analysis was performed to compare the risk profiles of associations with the set of risk and protective factors examined in the study, using the high symptoms class as the reference group. The adjusted odds ratios and confidence intervals are shown in Table 4. Profile group membership is associated with nativity, education, income, age, gender, and negative interaction. The results indicate that nativity significantly differentiates the high symptoms class from the low symptoms class (e.g., predicts which class respondents are in); respondents who have lived in the U.S. for 10 years or less are more likely to belong in the low symptoms class (OR: 1.874; CI: 0.317–11.101). Similarly, respondents with higher levels of income (OR: 0.940; CI: 0.839–1.054), those with higher levels of education (OR: 0.921; CI: 0.821–1.033) and older respondents are more likely to belong in the low symptoms class (OR: 0.966; CI: 0.951–0.980), whereas women are less likely to be members in the low symptoms class (OR: 0.707; CI: 0.440–1.134). Finally, respondents who report experiencing negative interaction with their family members are less likely to be in the low symptoms class (OR: 1.813; CI: 1.280–2.568).
Table 4.
Odds Ratios for Effects of Covariates on Depressive Symptoms Compared to High Symptoms
| Variable | OR | 95% CI |
|---|---|---|
| African American | 1.018 | 0.403 - 2.573 |
| Nativity (US Born is reference ) | ||
| 0-10 Years | 1.874 * | 0.317 - 11.101 |
| 11-20 Years | 0.517 | 0.099 - 2.691 |
| 20+ Years | 0.967 | 0.288 - 3.241 |
| Education | 0.921 * | 0.821 - 1.033 |
| Income | 0.940 * | 0.839 - 1.054 |
| Age | 0.966 * | 0.951 - 0.980 |
| Unmarried | 1.179 | 0.677 - 2.052 |
| Female | 0.707 * | 0.440 - 1.134 |
| Non-South | 1.495 | 0.834 - 2.680 |
| Emotional Support | 0.927 | 0.596 - 1.441 |
| Negative Interaction | 1.813 * | 1.280 - 2.568 |
| Discrimination | 1.219 | 0.974 - 1.525 |
Note:
p < .05
Discussion
The purpose of this study was to empirically identify depressive symptom profiles among a representative sample of African American and Caribbean Black adults. The results demonstrated the utility of a latent profile approach to risk characterization while also providing substantively meaningful information. Our data indicated heterogeneity among those Black Americans reporting lower vs. higher levels of depressive symptoms, depending on the particular profile, or constellation of risk and protective factors, under consideration. For example, a low symptoms class was identified in which older age, male gender, and fewer experiences with negative interaction and racial discrimination were associated with lower depressive symptoms. Membership in the high symptoms class, indicated by lower socioeconomic status, female gender, negative interaction and low social support, was associated with higher depressive symptoms. These findings verify the presence of discrete high and low symptoms groups and illustrate the importance of examining heterogeneity within racial and ethnic groups.
It is noteworthy that the resulting classes differed with respect to the level of depressive symptoms, as well as the risk factor profiles. The unique correlates of depressive symptoms in each class not only suggests that these classes are distinct, but also that demographic, family network and stress factors do not affect the mental health of the Black population in the same manner. Being of advanced age and having experienced major racial discrimination were specific risk factors for those with lower levels of depressive symptoms, whereas low socioeconomic status and poor social relations were unique risk factors for those with higher levels of depressive symptoms. Consistent with previous literature (Lincoln et al., 2005), women and individuals who experienced negative interaction with their family members were at higher risk for depression in both classes.
Neither ethnicity nor nativity were associated with depressive symptoms within the low symptoms or high symptoms classes. However, nativity did predict class membership for those Caribbean Blacks who have resided in the U.S. for 10 years or less. Specifically, they were more likely to be a member of the low symptoms class than were U.S.-born Blacks or Caribbean Blacks who resided in the U.S. for more than 10 years. This finding provides some support for the “healthy immigrant effect,” which posits that Caribbean immigrants have better health than U.S.-born Blacks. However, studies examining the effects of racism on health and well-being (Hummer, 1996; Jones, 2001; Postmes & Branscombe, 2002; Williams, 2000) provide a plausible explanation for the erosion of the immigrant health advantage with length of residence in the U.S. Specifically, findings from these studies indicate that differences in mental health outcomes between U.S.-born and Caribbean-born Blacks may be attributable to time lived in the U.S.
Vega and Amaro (1994) found that rates of mental disorders in Mexico-born immigrants in the U.S. who had lived fewer than 13 years in the U.S. closely resembled those for residents of Mexico City (i.e., non-immigrants). However, those who had lived in the U.S. for 13 years or more had higher rates of mental disorders, comparable to the general U.S. population. In the current sample, more than 80% of Caribbean respondents had lived in the U.S. for more than 10 years. It is possible that the longer Caribbean immigrants reside in the U.S., the greater their cumulative exposure to stressful life events and conditions associated with their minority status. If this is the case, it suggests that within the racialized context of the United States, the initial health advantage typically seen among Caribbean immigrants is eroded over time. Furthermore, given the mass exportation of U.S. culture through various media and commercial outlets (i.e., globalization of the American diet and lifestyles), more recent immigrants to this country may not be as healthy as their predecessors.
Although experiences of major racial discrimination did not significantly differentiate the two symptoms classes (e.g., discrimination did not predict which class a person is in), discrimination was associated with depressive symptoms for those respondents in the low symptoms class. The socioeconomic profile of the low symptoms class may provide an explanation for this finding. Respondents in the low symptoms class had higher levels of income and education compared to those in the high symptoms class. Studies of discrimination and health have found that persons with higher socioeconomic status are more likely to report racial discrimination (Jackson & Stewart, 2003; Ren, Amick, & Williams, 1999; Schultz et al., 2000).
Higher SES Blacks possess the necessary resources that afford them access to services and housing in predominantly white areas (Pattillo-McCoy, 1999). Consequently, they are more likely to be involved in interpersonal dealings and racial contexts that are majority white and have been identified as potential mechanisms through which “race” impacts health (Read & Emerson, 2005). Further, given their increased resources and access, higher SES Blacks who are exposed to discrimination in various arenas are likely to perceive these situations as being especially unmerited and egregious. Experiences with discrimination for this group are a stark reminder that, despite their income and education advantages, race is still a particularly powerful social marker that effectively negates other status achievements and is a significant obstacle in specific life areas (e.g., workplace, neighborhood). The item endorsement profile for major racial discrimination (Figure 2) further bolsters this interpretation. Respondents in the low symptom class are more likely than those in the high symptom class to report that they were “not hired for unfair reason,” “neighbors made life hard,” and “getting bad service.” Previous research suggests that these specific forms of discrimination are more likely to be experienced by Blacks with higher SES (Jackson & Stewart, 2003; Ren et al., 1999; Schultz et al., 2000).
Figure 2.
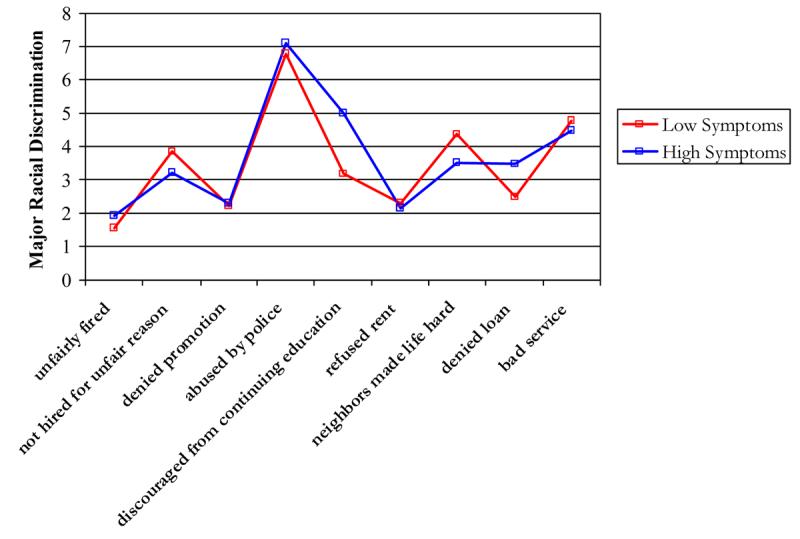
Item Endorsement Profile: Racial Discrimination
Theories linking socioeconomic status and health would predict some of the findings from these analyses, such as the association between income, education and depressive symptoms in the high symptoms class. However, socioeconomic status alone does not account for the observed patterns. This is demonstrated by the lack of a relationship between socioeconomic status and depressive symptoms in the low symptoms class. In fact, being older, female and experiencing less stress from negative family interactions and discrimination were associated with lower risk for depression in this class. Only those respondents in the high symptoms class appeared to benefit from the protective effects of education, income and social support from family. The present findings enhance our understanding of how both socioeconomic status and social relations operate in relation to depressive symptoms and suggest that the combination of high levels of negative interaction and low levels of social support may be especially problematic for persons most at risk for depression.
This study provided a preliminary picture of depressive symptom profiles among African Americans and Caribbean Blacks. The availability of a nationally representative sample was a definite advantage of the study and an extension of prior investigations of small and geographically situated African American and Black Caribbean samples. The use of latent profile analysis, a unique analysis procedure for questions of this type, helped to clarify the role of specific predictors relative to symptom profiles. Despite these advantages, the findings are limited by restrictions in the study sample. The Black Caribbean sample excludes individuals who do not speak English (i.e., persons who only speak Spanish, Haitian-French, or Creole dialects) and, as a consequence, the study findings are not generalizable to these groups of Caribbean Blacks. There are reasons to anticipate that the issues investigated here – depressive symptoms, reports of discrimination, and family relations – are of equal, if not greater significance for non-English speaking Caribbean Blacks for whom the challenges of the immigration experience (e.g., cultural displacement, negotiating medical and educational institutions) are exacerbated by difficulties in language and communication.
Furthermore, the CES-D was used to measures depressive symptoms and may not fully capture the range of depressive symptoms in this sample. In addition, some have argued that there is gender bias associated with at least one of the indicators included in the CES-D scale (Cole, Kawachi, Maller, & Berkman, 2000) such that women are more likely to endorse the “crying” item compared to men. Finally, in the absence of prospective data, we are limited in the ability to understand the causal processes by which specific risk and protective factors influence depressive symptoms. For example, within the high symptoms class, both high levels of negative interaction and low levels of social support were associated with more depressive symptoms. It is interesting to speculate as to whether the combination of high negative interaction and low social support is significant in an etiologic sense for the development of the high symptoms class as distinct from the low symptom class. It may be the case that prolonged exposure to family members with depressive symptoms results in both increased negative interaction and withdrawal of support. Alternatively, pre-existing family dynamics of this type (high negative interaction/low social support) may result in the emergence of depressive symptoms. Answers to these questions must await prospective data that address the role of social relations and processes in the development of depressive symptoms within discrete symptom classes. Nonetheless, the significant advantages of the sample, methods, and analysis used in this study provided a unique opportunity to examine differences in depressive symptoms and distinctive symptom profiles within a heterogeneous sample of African Americans and Black Caribbeans.
In the present analysis, the designation of Caribbean Blacks as a separate group from native-born African Americans is an initial attempt to focus on the presence of a Black ethnic subgroup. There are certainly theoretically justifiable reasons for further disaggregating the category of Caribbean Blacks by national group (e.g., Jamaica, Barbados). On the other hand, several researchers have argued that particular elements of the Black Caribbean experience in the U.S. create a Black identity that supersedes both ethnicity and nationality as a relevant social marker (Foner, 2005). Black Caribbeans, by virtue of the social context and interactions they encounter are socialized to a new Black identity or, at the very least, a pan-Caribbean identity and perspective. In essence, once in the United States, one's primary personal and group identity is defined and perceived by others as being Black. This is consistent with the work of Foner (2005) who notes that being Black is a master status which pervades the lives of Black Caribbeans in the United States. In contrast, in other situations involving intragroup interactions and perceptions, such as community observances and celebrations like Brooklyn's Annual West Indian Day Parade, individual distinctions between the various countries comprising the Caribbean region are highlighted. In the aggregate, the distinctive histories and life experiences of Blacks of Caribbean descent have likely had an important influence on shaping their patterns of depressive symptoms and in ways that are different from that observed among native-born African Americans. Future research efforts should explore whether country of origin and other differences (e.g., immigration circumstances) similarly exert fundamental and significant influences on depressive symptom profiles that are associated with the distinct national groups that comprise the Caribbean region.
Acknowledgments
The preparation of this manuscript was supported by grants from the National Institute of Mental Health (K01-MH69923-01) to Dr. Lincoln and grants from the National Institute on Aging to Drs. Chatters and Taylor (R01-AG018782) and Dr. Taylor (P30-AG15281). The authors would like to thank Dr. David T. Takeuchi for his helpful comments on earlier drafts of this manuscript.
Footnotes
Publisher's Disclaimer: This is a PDF file of an unedited manuscript that has been accepted for publication. As a service to our customers we are providing this early version of the manuscript. The manuscript will undergo copyediting, typesetting, and review of the resulting proof before it is published in its final citable form. Please note that during the production process errors may be discovered which could affect the content, and all legal disclaimers that apply to the journal pertain.
Contributor Information
Dr. Karen Lincoln, E-mail: KL3@u.washington.edu
Linda M Chatters, University of Michigan, chatters@umich.edu.
Robert J Taylor, University of Michigan, rjtaylor@umich.edu.
James S Jackson, University of Michigan, jamessj@umich.edu.
References
- Bolger N, DeLongis A, Kessler RC, Schilling EA. Effects of daily stress on negative mood. Journal of Personality and Social Psychology. 1989;57:808–818. doi: 10.1037//0022-3514.57.5.808. [DOI] [PubMed] [Google Scholar]
- Cohen S, Wills TA. Stress, social support, and the buffering hypothesis. Psychological Bulletin. 1985;98:310–357. [PubMed] [Google Scholar]
- Cole SR, Kawachi I, Maller SJ, Berkman LF. Test of item-response bias in the CES-D scale: Experience from the New Haven EPESE Study. Journal of Clinical Epidemiology. 2000;53:285–289. doi: 10.1016/s0895-4356(99)00151-1. [DOI] [PubMed] [Google Scholar]
- DeVellis BM. Depression in rheumatological diseases. Baillieres Clinical Rheumatology. 1993;7:241–257. doi: 10.1016/s0950-3579(05)80088-3. [DOI] [PubMed] [Google Scholar]
- Dodoo FN-A. Assimilation differences among Africans in America. Social Forces. 1997;76:527–546. [Google Scholar]
- Essed P. Understanding everyday racism. Newbury Park; CA: Sage: 1991. [Google Scholar]
- Feagin JR. The continuing significance of race: AntiBlack discrimination in public places. American Sociological Review. 1991;56:101–116. [Google Scholar]
- Feagin JR, McKinney KD. The many costs of racism. Rowman & Littlefield Publishers, Inc.; NY: 2003. [Google Scholar]
- Foner N. In a New Land: A Comparative View of Immigration. New York University Press; NY: 2005. [Google Scholar]
- Frerichs RB, Aneshensel CS, Clark VA. Prevalence of depression in Los Angeles County. American Journal of Epidemiology. 1981;113:691–699. doi: 10.1093/oxfordjournals.aje.a113149. [DOI] [PubMed] [Google Scholar]
- Gallo JJ, Cooper-Patrick L, Lesikar S. Depressive symptoms of Whites and African Americans aged 60 years and older. Journal of Gerontology: Psychological Sciences. 1998;53B:P277–P286. doi: 10.1093/geronb/53b.5.p277. [DOI] [PubMed] [Google Scholar]
- Gray BA, Keith V. The benefits and costs of social support for African American women. In: Brown DR, Keith VM, editors. In and out of our right minds: African American women and mental health. Columbia University Press; New York: 2003. pp. 242–257. [Google Scholar]
- Greenbaum PE, Del Boca FK, Darkes J, Wang C-P, Goldman MS. Variation in the drinking trajectories of freshmen college students. Journal of Consulting and Clinical Psychology. 2005;73:229–238. doi: 10.1037/0022-006X.73.2.229. [DOI] [PubMed] [Google Scholar]
- Hernandez DJ. Demographic change and the life circumstances of immigrant families. The Future of Children. 2004;14:17–48. [Google Scholar]
- House JS, Umberson D, Landis KR. Structures and processes of social support. Annual Review of Sociology. 1988;14:293–318. [Google Scholar]
- Hummer RA. Black-White differences in health and mortality: A review and conceptual model. The Sociological Quarterly. 1996;37:105–125. [Google Scholar]
- Husaini BA, Castor RS, Linn JG, Moore SJ. Social support and depression among Black and White elderly. Journal of Community Psychology. 1990;18:12–18. [Google Scholar]
- Jackson PB. Role occupancy and minority mental health. Journal of Health and Social Behavior. 1997;38:237–255. [PubMed] [Google Scholar]
- Jackson PB, Stewart QT. A research agenda for the Black middle-class: Work stress, survival strategies, and mental health. Journal of Social Behavior. 2003;44:442–455. [PubMed] [Google Scholar]
- Jones CP. Invited commentary: “Race,” racism, and the practice of epidemiology. American Journal of Epidemiology. 2001;154:299–304. doi: 10.1093/aje/154.4.299. [DOI] [PubMed] [Google Scholar]
- Kessler RC, McGonagle KA, Zhao S, Nelson CB, Hughes M, Eshelman S, Wittchen HU, Kendler KS. Lifetime and 12-month prevalence of DSM-III-R disorders in the United States. Archives of General Psychiatry. 1994;51:8–19. doi: 10.1001/archpsyc.1994.03950010008002. [DOI] [PubMed] [Google Scholar]
- Kessler RC, Mickelson KD, Williams DR. The prevalence, distribution, and mental health correlates of perceived discrimination in the United States. Journal of Health and Social Behavior. 1999;40:208–230. [PubMed] [Google Scholar]
- Kreiger N. Discrimination and health. In: Berkman LF, Kawachi I, editors. Social epidemiology. Oxford University Press; New York, NY: 2000. pp. 36–75. [Google Scholar]
- Krishnan KR, Delong M, Kraemer H, et al. Comorbidity of depression with other medical diseases in the elderly. Biological Psychiatry. 2002;52:559–588. doi: 10.1016/s0006-3223(02)01472-5. [DOI] [PubMed] [Google Scholar]
- Lincoln KD, Chatters LM, Taylor RJ. Psychological distress among Black and white Americans: Differential effects of social support, negative interaction and personal control. Journal of Health and Social Behavior. 2003;44:390–407. [PMC free article] [PubMed] [Google Scholar]
- Lincoln KD, Chatters LM, Taylor RJ. Social support, traumatic events and depressive symptoms among African Americans. Family Relations. 2005;54:501–511. doi: 10.1111/j.1741-3737.2005.00167.x. [DOI] [PMC free article] [PubMed] [Google Scholar]
- Lo Y, Mendell N, Rubin DB. Testing the number of components in a normal mixture. Biometrika. 2001;88:767–778. [Google Scholar]
- Logan J, Deane G. Black diversity in metropolitan America. Lewis Mumford Center for Cooperative Urban and Regional Research; Albany, NY: 2003. [Google Scholar]
- Meiser TH, Ohrt B. Modeling structure and chance in transitions: Mixed latent partial Markov-Chain models. Journal of Educational and Behavioral Statistics. 1996;21:91–109. [Google Scholar]
- Miranda J, Siddique J, Belin TR, Kohn-Wood LP. Depression prevalence in disadvantaged young Black women: African and Caribbean immigrants compared to U.S.-born African Americans. Social Psychiatry and Psychiatric Epidemiology. 2005;40:253–258. doi: 10.1007/s00127-005-0879-0. [DOI] [PubMed] [Google Scholar]
- Muthén B, Muthén LK. Integrating person-centered and variable-centered analyses: Growth mixture modeling with latent trajectory classes. Alcoholism: Clinical and Experimental Research. 2000;24:882–891. [PubMed] [Google Scholar]
- Myers HF, Lesser I, Rodriguez N, Mira CB, Hwang W-C, Camp C, Anderson D, Erickson L, Wohl M. Ethnic differences in clinical presentation of depression in older women. Cultural Diversity and Ethnic Minority Psychology. 2002;8:138–156. doi: 10.1037/1099-9809.8.2.138. [DOI] [PubMed] [Google Scholar]
- Nazroo JY. Ethnicity and mental health: Findings from a national community survey. Policy Studies Institute; London, England: 1997. [Google Scholar]
- Pattillo-McCoy M. Black Picket Fences: Privilege and Peril among the Black Middle Class. University of Chicago Press; Chicago, IL: 1999. [Google Scholar]
- Patten SB. Selection bias in studies of major depression using clinical subjects. Journal of Clinical Epidemiology. 2000;53:351–357. doi: 10.1016/s0895-4356(99)00215-2. [DOI] [PubMed] [Google Scholar]
- Postmes T, Branscombe NR. Influence of long-term environmental composition on subjective well-being in African Americans. Journal of Personality and Social Psychology. 2002;83:735–751. doi: 10.1037//0022-3514.83.3.735. [DOI] [PubMed] [Google Scholar]
- Radloff LS. The CES-D Scale: A self-report depression scale for research in the general population. Applied Psychological Measurement. 1977;1:385–401. [Google Scholar]
- Read JG, Emerson MO. Racial context, Black immigration and the U.S. Black/White health disparity. Social Forces. 2005;84:181–199. [Google Scholar]
- Regier DA, Myers JK, Kramer M, Robins LN, Blazer DG, Hough RL, Eaton WW, Locke BZ. The NIMH Epidemiologic Catchment Area Program: Historic context, major objectives, and study design. Archives of General Psychiatry. 1984;41:934–941. doi: 10.1001/archpsyc.1984.01790210016003. [DOI] [PubMed] [Google Scholar]
- Ren XS, Amick BC, Williams DR. Racial/ethnic disparities in health: The interplay between discrimination and socioeconomic status. Ethnicity & Disease. 1999;9:151–165. [PubMed] [Google Scholar]
- Riolo SA, Nguyen TA, Greden JF, King CA. Prevalence of depression by race/ethnicity: Findings from the National Health and Nutrition Examination Survey III. American Journal of Public Health. 2005;95:998–1000. doi: 10.2105/AJPH.2004.047225. [DOI] [PMC free article] [PubMed] [Google Scholar]
- Shaw CM, Creed F, Tomenson R, Riste L, Cruickshank JK. Prevalence of anxiety and depressive illness and help seeking behavior in African Caribbeans and White Europeans: Two phase general population survey. British Medical Journal. 1999;318:302–306. doi: 10.1136/bmj.318.7179.302. [DOI] [PMC free article] [PubMed] [Google Scholar]
- Schulz A, Williams DR, Israel B, Becker A, Parker E, James S, Jackson JS. Unfair treatment, neighborhood effects, and mental health in the Detroit metropolitan area. Journal of Health and Social Behavior. 2000;41:314–332. [PubMed] [Google Scholar]
- Singh GK, Siahpush M. Ethnic-immigrant differentitals in health behaviors, morbidity, and cause-specific mortality in the United States: An analysis of two national data bases. Human Biology. 2002;74:83–109. doi: 10.1353/hub.2002.0011. [DOI] [PubMed] [Google Scholar]
- U.S. Census Bureau . Census 2000, Summary File 3, Matrices PCT15 and PCT1. U.S. Census Bureau; Washington, D.C.: 2005a. [Google Scholar]
- U.S. Census Bureau . Census 2000 special Report, We the people: Blacks in the United States. U.S. Census Bureau; Washington, D.C.: 2005b. [Google Scholar]
- Vega WA, Amaro H. Latino outlook: Good health, uncertain prognosis. Annual Review of Public Health. 1994;15:39–67. doi: 10.1146/annurev.pu.15.050194.000351. [DOI] [PubMed] [Google Scholar]
- Waters M. Black identities. Harvard University Press; Cambridge, Massachusetts: 1999. [Google Scholar]
- Williams DR. Racial variations in adult health status: Patterns, paradoxes, and prospects. In: Smelser N, Wilson WJ, Mitchell F, editors. American becoming: Racial trends and their consequences. Vol. 2. National Academy Press; Washington, D.C.: 2001. pp. 371–410. [Google Scholar]
- Williams DR. Race and health in Kansas: Data, issues, directions. In: Tarlov AR, Peter RF, editors. The society and population health reader. The New Press; New York, NY: 2000. pp. 236–258. [Google Scholar]
- Williams DR, Chung A-M. Racism and health. In: Gibson R, Jackson J, editors. Health in Black America. Sage; Thousand Oaks, CA: Forthcoming. [Google Scholar]
- Williams DR, Collins C. Racial residential segregation: A fundamental cause of racial disparities in health. Public Health Reports. 2001;116:404–416. doi: 10.1093/phr/116.5.404. [DOI] [PMC free article] [PubMed] [Google Scholar]
- Williams DR, Yu Y, Jackson JS, Anderson NB. Racial differences in physical and mental health: Socioeconomic status, stress and discrimination. Journal of Health Psychology. 1997;2:335–351. doi: 10.1177/135910539700200305. [DOI] [PubMed] [Google Scholar]
- Zautra A, Burleson MH, Matt K, Roth S, Burrows L. Interpersonal stress, depression, and disease activity in rheumatoid arthritis and osteoarthritis patients. Health Psychology. 1994;13:139–148. doi: 10.1037//0278-6133.13.2.139. [DOI] [PubMed] [Google Scholar]
- Zhang AY, Snowden LR. Ethnic characteristics of mental disorders in five U.S. communities. Cultural Diversity and Ethnic Minority Psychology. 1999;5:134–146. doi: 10.1037/1099-9809.5.2.134. [DOI] [PubMed] [Google Scholar]