Abstract
Microgonotropen (MGT) DNA binding drugs, which consist of an A+T-selective DNA minor groove binding tripyrrole peptide and polyamine chains attached to a central pyrrole that extend drug contact into the DNA major groove, were found to be extraordinarily effective inhibitors of E2 factor 1 (E2F1) association with its DNA promoter element (5′-TTTCGCGCCAAA). The most active of these drugs, MGT-6a, was three orders of magnitude more effective than distamycin and inhibited complexes between E2F1 and the dihydrofolate reductase promoter by 50% at 0.00085 μM. A relationship was found between the measured equilibrium constants for binding of MGTs to the A+T region of d(GGCGA3T3GGC)/d(CCGCT3A3CCG) and their inhibition of complex formation between E2F1 and the DNA promoter element. A representative of the potent MGT inhibitors was significantly more active on inhibition of E2F1–DNA complex formation compared with disruption of a preexisting complex.
A key component of gene regulation is the binding of transcription factors (TFs) to promoter elements containing their consensus DNA binding site. DNA binding drugs can be potent inhibitors of complexes formed between TFs and their promoters thereby disrupting gene expression. Drugs sharing a common DNA sequence recognition and groove binding preference with the TF are often effective inhibitors of complex formation. For example, TATA binding protein–DNA complexes formed at A+T-rich sequences within the DNA minor groove, are strongly inhibited by A+T-specific minor groove binding drugs such as distamycin (Dm) (1, 2). Dm is also capable of interfering with homeodomain–DNA complex formation, which consist of an A+T-rich site with largely major groove and one minor groove DNA–protein contacts (3). On the other hand, Dm is an extremely poor inhibitor of the G+C-binding zinc-finger protein early growth response factor 1 (EGR1), which recognizes DNA through the major groove, even when the EGR1 DNA binding site was provided with an A+T-rich flanking sequence (4). The most effective inhibitors of EGR1–DNA complexes identified thus far are the threading intercalators nogalamycin and hedamycin, which show a preference for binding to G+C-rich DNA, and chromomycin A3, which also binds to G+C-rich sites albeit within the DNA minor groove (4). These studies demonstrate that the sequence and groove preference of the drugs and TFs are important determinants for inhibition of TF–DNA complex formation.
Although the above studies have examined drugs as inhibitors of TF–DNA complex formation, where the DNA binding domains consist of either A+T- or G+C-rich sites and factor binding is within one or the other DNA grooves, the DNA binding motifs of TFs are often more complex. Although most specific TFs recognize DNA through the DNA major groove, there are often additional contacts that utilize the minor groove as well. For example, homeodomain factors bind to A+T-rich DNA sites in the DNA major groove and utilize minor groove contacts to strengthen the complex (3). Similarly, the Ets family of TFs bind to A+G-rich sequences within the DNA major groove but also insert a tryptophan side chain via intercalation within the DNA minor groove (5, 6)
It is likely that drugs capable of more specifically recognizing the DNA binding site of TFs would be significantly more effective inhibitors than agents that compete for only one portion of the TF–DNA binding site. Unlike some TFs, most DNA binding drugs that demonstrate sequence preference do so with either G+C-or A+T-rich sites and bind to only one of the DNA grooves (7). However, recently Bruice and coworkers have developed a family of compounds (MGTs) that (i) bind to A+T regions of the DNA minor groove and adjacent guanosines via a tripyrrole peptide terminating at the carboxyl terminus with a dimethylamine substituent and (ii) extend from the central pyrrole a protonated polyamine substituent that binds to the negative phosphodiester linkages in the major groove. This clamping effect increases the binding constants and results in bending of the DNA (8, 9).
E2 factor (E2F), first defined as a cellular DNA-binding protein required for transactivation of the adenovirus E2 promoter, is now known to participate in cell growth control and the regulation of genes that are involved in cell growth and DNA replication (10). E2F1 (the first E2F family member), which binds to adjacent A+T- and G+C-rich sequences and its binding affects both grooves of DNA, was used as a model system of a TF whose DNA binding site is similar to that of MGTs (11, 12). In this study we explore the potential of MGTs to inhibit E2F1 binding to DNA.
MATERIALS AND METHODS
Drugs.
Dm A (Sigma) and MGTs (Table 1) were diluted in distilled water. Prepared drugs were stored at −20°C. MGTs were synthesized as described (13–17).
Table 1.
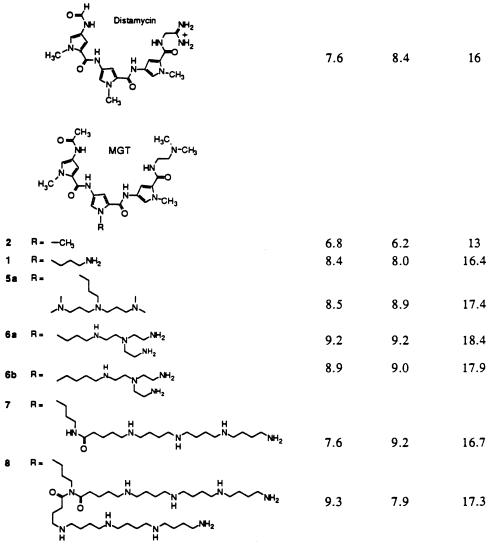
Association constants for MGT compounds with d(GGCGA3T3GGCGG)/d(CCGCCA3T3GCGCC) (in H2O, 10 mM phosphate buffer, pH 7.0/10 mM NaCl at 35°C)
| Compound | log(K1) | log(K2) | log(K1K2) |
|---|---|---|---|
Oligonucleotides.
A 27-mer oligonucleotide derived from the hamster dihydrofolate reductase promoter (5′-GGGCGACTGCAATTTCGCGCCAAACTT; E-oligo) and a 30-mer oligonucleotide derived from herpes simplex virus latency promoter (5′-TCAGCCTTTATAAAAGCGGGGGCGCGGCCG; HSVL-oligo), and their complementary strands were synthesized by the Biopolymer facility at Roswell Park Cancer Institute (Buffalo, NY). Purification and end-labeling of oligonucleotides were performed as described (1, 18)
Proteins.
Preparation of the cDNA clone expressing a glutathione S-transferase–E2F1 (amino acids 1–437) fusion protein in the pGEX isopropyl β-d-thiogalactopyranoside-inducible vector was as described (19, 20). Briefly, induced bacterial fusion protein was sonicated in a buffer containing 100 mM NaCl, 1 mM EDTA, 20 mM Tris base (pH 8.0), 0.5% Nonidet P-40, and 0.5% nonfat dry milk. The supernatants were then added to glutathione-Sepharose beads (Pharmacia Biotech, Washington, DC) and rocked gently for 45 min at 4°C. After incubation, the beads were washed twice with Tris buffer (100 mM Tris base, pH 8.0/120 mM NaCl), and the fusion protein was eluted with the same buffer plus glutathione (6.12 mg/ml; Sigma). The quantities of fusion proteins were evaluated by SDS/PAGE and Bio-Rad protein assay. EGR1 protein was supplied by Frank Rauscher III (Wistar Institute, Philadelphia, PA) and the purification of protein was as described (4).
Gel Mobility Shift Assays.
Gel mobility shift assays were used to evaluate the ability of protein to bind to its consensus DNA binding site by changing the DNA migration pattern in the gel. In general, 3–5 ng of glutathione S-transferase–E2F1 protein was incubated with 0.5 nM 32P-labeled E-oligo in the binding buffer [20 mM Hepes·KOH, pH 7.9/25 mM KCl/2 mM MgCl2/0.1 mM EGTA/100 μg/ml bovine serum albumin/0.5 mM dithiothreitol/0.8 mM spermidine/10% glycerol/0.025% Nonidet P-40] for 30 min at 30°C. Samples were separated by electrophoresis in a 4% native polyacrylamide gel with TBE (44.5 mM Tris base/44.5 mM boric acid/1 mM EDTA, pH 8.3). Autoradiography and quantitation were as described (21). The mobility shift assay with EGR1 protein and HSVL-oligo was carried out similarly.
Drug Studies.
The effects of the addition of drugs on TF–DNA interaction were evaluated by gel mobility shift assay. Two types of drug studies were performed. One was to incubate labeled E-oligo with drugs for 30 min at 30°C before addition of glutathione S-transferase–E2F1 protein (standard assay), and the other was to add drugs into a reaction in which TF–DNA complex had been formed (reverse assay). The complex formation was measured by a computing laser densitometer (Molecular Dynamics). Fifty percent inhibition of TF–DNA complex formation (IC50) was determined by comparing drug-treated samples with the corresponding control.
RESULTS
The ability of DNA binding drugs to prevent complex formation between E2F1 and its consensus DNA binding site has been evaluated by using a cell-free mobility shift assay. For our drug evaluation studies, an E2F1 DNA binding site present in the human, mouse, and hamster dihydrofolate reductase promoters (5′-TTTCGCGCCAAA) was synthesized as part of a 27-bp oligonucleotide. Protein and DNA were titrated with purified E2F1 to determine the minimal concentration of protein required to optimize complex formation.
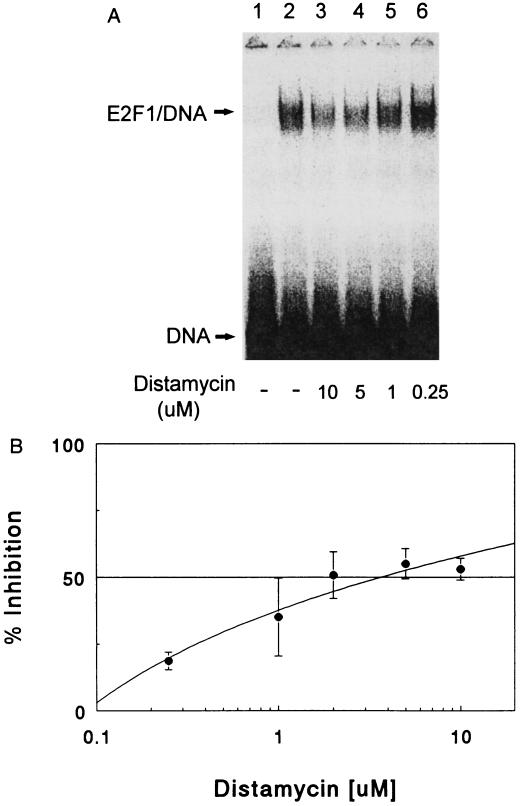
Since it was recently determined that in DNA containing A+T runs, E2F1 reverses the natural bending toward the major groove, the A+T-specific DNA minor groove binding drug Dm was tested as a possible inhibitor of E2F1 complexes (7, 11, 22). The mobility shift assay in Fig. 1A demonstrates the effectiveness of Dm at preventing E2F1 DNA complexes. Treatment of the oligonucleotide with as little as 1.0 μM Dm causes a decrease in the E2F1–DNA complex (Fig. 1B). Fifty percent inhibition of complex formation (IC50) occurs at 3.8 μM Dm.
Figure 1.
Inhibition of the formation of E2F1–DNA complex by Dm. (A) Gel mobility shift assay. Dm at the indicated concentrations was incubated with 32P-labeled E-oligo for 30 min at 30°C. E2F1 protein was added to the reaction for another 30-min incubation. Samples were electrophoresed on a 4% native polyacrylamide gel. The dried gel was exposed to Kodak XRP-5 film. Lanes: 1, free labeled DNA probe; 2, E2F1–DNA complex; 3–6, reactions treated with Dm at concentrations of 10, 5, 1, and 0.25 μM, respectively. (B) Dose–response curve for Dm’s inhibitory effect on the formation of E2F1–DNA complex. The intensity of autoradiographic signal was quantitated by using a densitometer. The percentage of inhibition of E2F1–DNA complex by Dm was determined by comparing drug-treated samples to the control without drug treatment. The data are the mean ± SD of three experiments.
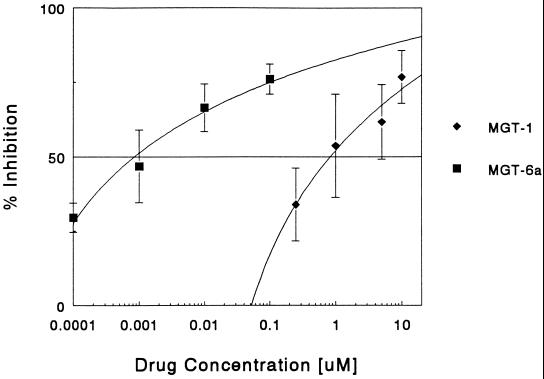
Thus, despite the fact that it only binds to one A+T-rich region of the E2F1 binding site, Dm was an effective inhibitor of E2F1–DNA complexes. The next question addressed was whether MGTs, which have the same tripyrrole peptide structure as that of Dm but with polyamine tethers that reach into the major groove and fasten to phosphate linkages of the E2F1 DNA binding site, would be even more effective inhibitors (13–16). The first drug tested was compound MGT-1 (Table 1), which is structurally similar to Dm, except that the central pyrrole group has been modified by the addition of an amine side chain to the parent compound 2. MGT-1 was more effective than Dm in inhibiting E2F1 complex formation (IC50 value of 0.82 μM compared with 3.8 μM) (Fig. 2) despite the fact that compound 2 binds DNA poorly in comparison to Dm (Table 1). The next compound tested was MGT-6a, equipped with a tren polyamine side chain (14). Its E2F1 inhibition profile reveals an extraordinary potency as an inhibitor of complex formation (Fig. 2). The IC50 of MGT-6a is 0.00085 μM, which is three orders of magnitude less than that of Dm.
Figure 2.
Effects of MGT-1 and -6a on E2F1–DNA complex formation. The ability of MGT-1 (⧫) and MGT-6a (▪) to inhibit DNA binding of E2F1 protein were evaluated by gel mobility shift assays and the percentage of inhibition of complex formation was determined as described for Fig. 1. The data are the mean ± SD of at least three experiments.
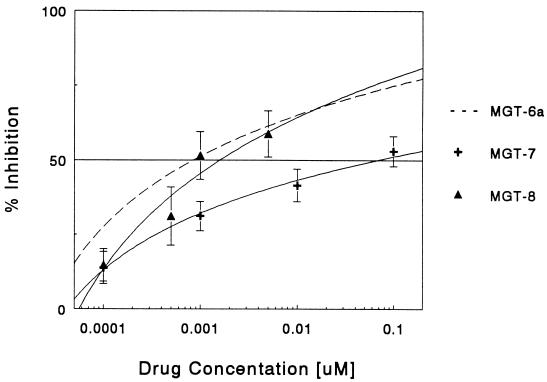
MGT-7 (16), which contains a polyamine tail that is twice the length of MGT-6a, has an IC50 that was nearly 100 times greater than that of MGT-6a (Fig. 3). Whether a further increase in tail length would lead to even greater losses of activity was determined by testing MGT-8 with a polyamine tail four times that of MGT-6a. Surprisingly, the activity of MGT-8 was similar to that of MGT-6a with an IC50 of 0.0016 μM (Fig. 3), suggesting that the polyamine tail size was not the sole determinant of drug activity.
Figure 3.
Inhibition of E2F1–DNA complex by MGT-6a, MGT-7, and MGT-8. The E2F1–DNA complex formation in the presence of MGT derivatives, MGT-6a (−), MGT-7 (+), and MGT-8 (▴), was measured by gel mobility shift assays. Results are the percentage of inhibition of complex formation as described for Fig. 1. The data are the mean ± SD of at least three experiments.
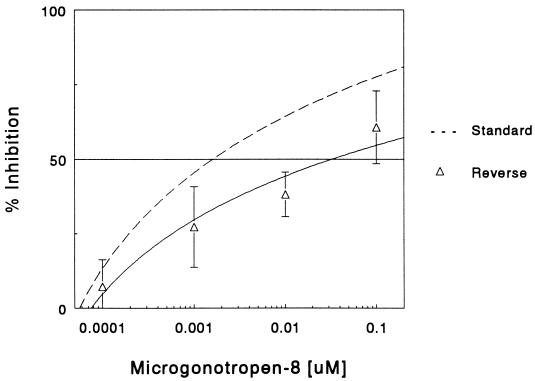
In studies to this point, MGTs have been evaluated for their ability to prevent E2F1 complex formation rather than to disrupt a preexisting complex. It is possible that the presence of a TF on the DNA before the addition of drug (reverse assay) would diminish drug inhibitory activity by preventing the drug from accessing the DNA. MGT-8 was chosen for this evaluation. The differences in IC50 values for MGT-8 under standard and reverse assay conditions (0.0016 μM and 0.03 μM, respectively) demonstrates that MGT-8 has a greater ability to interfere with complex formation than to disrupt an E2F1–DNA complex (Fig. 4).
Figure 4.
Disruption of preformed E2F1–DNA complex by MGT-8. The ability of MGT-8 to prevent E2F1–DNA complex formation (–) or to disrupt a preformed complex (Δ) was evaluated by gel mobility shift assay. Data are the percentage of inhibition of complex formation as described for Fig. 1. Results are the mean ± SD of three experiments.
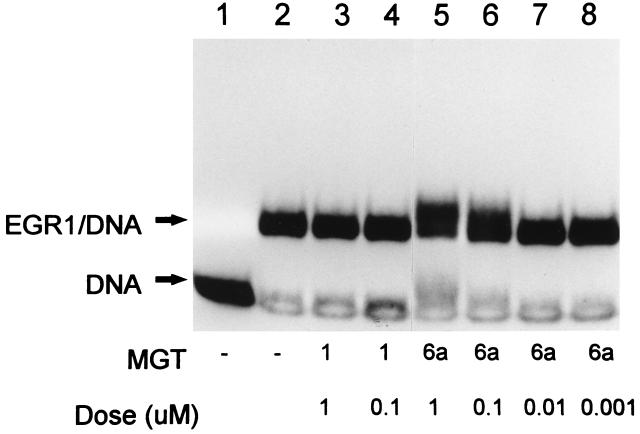
Finally, an experiment was carried out to evaluate the inhibitory activity of MGTs on a TF that occupies only the DNA major groove and binds a G+C-rich site. This study examined whether MGT-6a could block the association of EGR1 (23, 24). Since MGTs require an A+T stretch of DNA to allow the Dm-like end of the molecule to anchor binding to DNA, the EGR1 DNA binding site contained at the 5′ end a 4-bp A+T flanking sequence around the G+C-rich consensus binding site. While no inhibition of complex formation was observed even at the highest drug concentration tested (1.0 μM), there was a change in the mobility of E2F1–DNA band probably reflecting formation of a ternary complex (Fig. 5). MGT-8 with a longer polyamine side chain again provided results similar to that of MGT-6a (17) in that both possessed similar inhibition profiles. MGT-1 at comparable concentrations had no effect on EGR1–DNA complexes.
Figure 5.
Effects of MGTs on the DNA binding of EGR1 at a G+C-rich sequence. MGT-1 and MGT-6a were tested for their ability to interfere with EGR1 binding to its regulatory element at a G+C-rich sequence. Drugs at the indicated concentrations were incubated with 32P-labeled HSVL-oligo for 30 min at 30°C followed by addition of EGR1 protein. Lanes: 1, free labeled DNA probe; 2, EGR1–DNA complex; 3 and 4, interactions of EGR1 and HSVL-oligo in the presence of 1 and 0.1 μM MGT-1, respectively; 5–8, reactions in which the HSVL-oligo has been treated with MGT-6a at concentrations of 1, 0.1, 0.01, and 0.001 μM, respectively, before the addition of EGR1.
DISCUSSION
This study represents a rational approach for designing DNA binding drugs as inhibitors of TF–DNA complexes. E2F1 was chosen as the targeted TF because its DNA binding domain consisted of both A+T- and G+C-rich sequences to which drugs could be directed (12). Moreover, the fact that MGTs interact with both DNA grooves enhanced their prospects as E2F1 inhibitors, since this TF effects DNA through both the major and minor grooves (11).
Dm and MGTs combine with double-stranded DNA at A+T-rich sites to provide 1:1 and 2:1 complexes (25, 26). In the 2:1 complexes, the two minor groove binding molecules lie side by side in an antiparallel geometry in the minor groove. Values for the equilibrium constants for formation of the 1:1 complexes (K1) and 2:1 complexes (K2) at the A3T3G site of d(CGCGA3T3GGCGG)/d(GCGCT3A3CCGCC) are provided in Table 1 (14, 16).
Since the physical constants K1 and K2 express the affinities of the MGT compounds for an A+T site, they should reflect drug activity if it is dependent on the tenacity of drug binding to DNA. Under the conditions of these experiments (pH 7), aliphatic amine substituents are protonated and there exists an attraction of the —\/NH+ functions of the MGT polyamine side chains and the -O-(PO2−)-O- linkages of the DNA (27, 28). In comparing DNA binding of Dm and MGTs, it should be noted that the substitution of the amino-terminal formyl and the carboxyl-terminal amidine groups of Dm by acetamido and -CH2CH2N+H(CH3)2 groups, respectively, yields compound 2 along with a three-order of magnitude decrease in binding affinity (K1K2) compared with Dm. Replacement of the central pyrrole N-CH3 of 2 with the -(CH2)-NH3+ substituent provides the simple MGT-1 and restores the binding affinity to that of Dm (comparable values of K1K2, Table 1).
Table 2 presents a comparison of all the MGTs tested for inhibition of E2F1–DNA complexes, compared with the activity of Dm. The most effective inhibitor, MGT-6a, showed an almost 5000-fold increase in activity over Dm. This may be compared with the 250-fold greater value of K1K2 for MGT-6a compared with Dm. Lengthening the linker by one methylene converts MGT-6a to MGT-6b and the latter was about as active as MGT-6a. Values of K1K2 for MGT-6a and -6b are about the same. On the other hand, exchange of the tren-polyamine of MGT-6a for the dien-polyamine, to provide MGT-5a, resulted in a drug that was only five times more active than Dm. The value of K1K2 for MGT-5a exceeds that for Dm by about 20-fold (see Table 1). Thus, when comparing the drug activity of MGT-6a, -6b, and -5a to the abilities to complex (K1K2) at a A3T3G site, we see a correlation to within a factor of 10. One should expect no better. To continue, MGT-7, which contains a polyamine tail that is twice the length of MGT-6a, has an IC50 that was nearly 100 times greater than that of MGT-6a (Fig. 3). This finding is in accord with the K1K2 value for MGT-7 being about 100 times smaller than that for MGT-6a. MGT-8 has a tail four times greater than that of MGT-6a. The activity of MGT-8 was similar to that of MGT-6a with an IC50 of 0.0016 μM (Fig. 3) and the K1K2 values for MGT-6a and -8 are about the same. For both the longer chain compounds, MGT-7 and -8, a comparison of their K1K2 values to MGT-5a would predict that they would be less inhibitory as TF–DNA complex inhibitors than the data shown in Table 2. It is possible that the orientation of large polyamine side chains influences drug activity as an inhibitor of TF–DNA complexes. Nevertheless, the affinity of the MGT molecules for a double-stranded DNA A3T3G site has much to do with the ability of the drug to bind at the A+T site of E2F1 and inhibit its complexing to TF.
Table 2.
Inhibition of E2F1–DNA complex formation by DNA-binding drugs
| Drug | Relative activity |
|---|---|
| Dm | 1.0 |
| MGT-1 | 4.6 |
| MGT-5a | 6.3 |
| MGT-6a | 4470 |
| MGT-6b | 2714 |
| MGT-7 | 48.7 |
| MGT-8 | 2375 |
Relative activity was normalized by comparing the IC50 of individual drugs to that of Dm.
A key question in these studies was whether MGT drugs capable of binding at phosphate linkages in the major groove and at the minor groove A+T-rich regions of the E2F1 DNA binding site would be significantly more effective than a drug that interacted with only one region. Dm, which lacks a polyamine tail capable of extending into the major groove region of the E2F1 DNA binding site, was only moderately effective at inhibiting E2F1–DNA complexes. In comparison, MGT-6a, which can bind both to the A+T region within the DNA minor groove and interacts with the DNA phosphate backbone in the major groove through its polyamine tail, was an extraordinary inhibitor of E2F1 (Fig. 2). At the same time, MGT-6a was not an effective inhibitor of EGR1–DNA complexes (Fig. 5) where the TF associates with G+C bases within the DNA major groove but has no association with the DNA minor groove and no A+T-rich component in the DNA of the interacting bases (23, 24).
Acknowledgments
This research was supported by grants to T.A.B. from the American Cancer Society (DHP-158) and the National Institutes of Health (CA16056), to T.C.B. from the Office of Naval Research (N000-90-J-4132), and to J.C.A. from the National Institutes of Health (CA58690).
ABBREVIATIONS
- MGT
microgonotropen
- Dm
distamycin A
- EGR1
early growth response factor 1
- TF
transcription factor
- E2F
E2 factor
References
- 1.Chiang S Y, Welch J, Rauscher F, III, Beerman T A. Biochemistry. 1994;33:7033–7040. doi: 10.1021/bi00189a003. [DOI] [PubMed] [Google Scholar]
- 2.Starr D B, Hawley D K. Cell. 1991;67:1231–1240. doi: 10.1016/0092-8674(91)90299-e. [DOI] [PubMed] [Google Scholar]
- 3.Dorn A, Affolter M, Muller M, Gehring W J, Leupin W. EMBO J. 1992;11:279–286. doi: 10.1002/j.1460-2075.1992.tb05050.x. [DOI] [PMC free article] [PubMed] [Google Scholar]
- 4.Welch J J, Rauscher F J, III, Beerman T A. J Biol Chem. 1994;269:31051–31058. [PubMed] [Google Scholar]
- 5.Donaldson L W, Petersen J M, Graves B J, McIntosh L P. EMBO J. 1996;15:125–134. [PMC free article] [PubMed] [Google Scholar]
- 6.Werner M H, Clore G M, Fisher C L, Fisher R J, Trinh L, Shiloach J, Gronenborn A M. Cell. 1995;83:761–771. doi: 10.1016/0092-8674(95)90189-2. [DOI] [PubMed] [Google Scholar]
- 7.Waring M, J. Annu Rev Biochem. 1981;50:159–192. doi: 10.1146/annurev.bi.50.070181.001111. [DOI] [PubMed] [Google Scholar]
- 8.Hansma H G, Browne K A, Bezanilla M, Bruice T C. Biochemistry. 1994;33:8436–8441. doi: 10.1021/bi00194a007. [DOI] [PubMed] [Google Scholar]
- 9.Blaskó A, Browne K A, Bruice T C. Bioorg Med Chem. 1995;3:631–646. doi: 10.1016/0968-0896(95)00051-h. [DOI] [PubMed] [Google Scholar]
- 10.Azizkhan J C, Jensen D E, Pierce A J, Wade M. Crit Rev Eukaryotic Gene Expression. 1993;3:229–254. [PubMed] [Google Scholar]
- 11.Cress W D, Nevins J R. Mol Cell Biol. 1996;16:2119–2127. doi: 10.1128/mcb.16.5.2119. [DOI] [PMC free article] [PubMed] [Google Scholar]
- 12.Wade M, Blake M C, Jambou R C, Helin K, Harlow E, Azizkhan J C. J Biol Chem. 1995;270:9783–9791. doi: 10.1074/jbc.270.17.9783. [DOI] [PubMed] [Google Scholar]
- 13.He G X, Browne K A, Groppe J C, Blaskó A, Mei H Y, Bruice T C. J Am Chem Soc. 1993;115:7061–7071. [Google Scholar]
- 14.He G X, Browne K A, Blaskó A, Bruice T C. J Am Chem Soc. 1994;116:3716–3725. [Google Scholar]
- 15.Xue T, Browne K A, Bruice T C. Bioconjugate Chem. 1995;6:82–87. doi: 10.1021/bc00031a009. [DOI] [PubMed] [Google Scholar]
- 16.Sengupta D, Blaskó A, Bruice T C. Bioorg Med Chem. 1996;4:803–813. doi: 10.1016/0968-0896(96)00070-3. [DOI] [PubMed] [Google Scholar]
- 17.Bruice, T. C., Sengupta, D. D., Blaskó, A., Chiang, S.-Y. & Beerman, T. A. (1997) Bioorg. Med. Chem. 5, in press. [DOI] [PubMed]
- 18.Lee D K, Horikoshi M, Roeder R G. Cell. 1991;67:1241–1250. doi: 10.1016/0092-8674(91)90300-n. [DOI] [PubMed] [Google Scholar]
- 19.Helin K, Lees J A, Vidal M, Dyson N, Harlow E, Fattaey A. Cell. 1992;70:337–350. doi: 10.1016/0092-8674(92)90107-n. [DOI] [PubMed] [Google Scholar]
- 20.Lin S-Y, Black A R, Kostic D, Pajovic S, Hoover C N, Azizkhan J C. Mol Cell Biol. 1996;16:1668–1675. doi: 10.1128/mcb.16.4.1668. [DOI] [PMC free article] [PubMed] [Google Scholar]
- 21.Chiang Y-S, Welch J J, Rauscher F, Beerman T A. J Biol Chem. 1996;271:23999–24004. doi: 10.1074/jbc.271.39.23999. [DOI] [PubMed] [Google Scholar]
- 22.Kopka M L, Yoon C, Goodsell D, Pjura P, Dickerson R E. Proc Natl Acad Sci USA. 1985;82:1376–1380. doi: 10.1073/pnas.82.5.1376. [DOI] [PMC free article] [PubMed] [Google Scholar]
- 23.Cao X, Koski R, Gashler A, McKiernan M, Morris C, Gaffney R, Hay R, Sukhatme V. Mol Cell Biol. 1990;10:1931–1939. doi: 10.1128/mcb.10.5.1931. [DOI] [PMC free article] [PubMed] [Google Scholar]
- 24.Christy B a N D. Proc Natl Acad Sci USA. 1989;86:8737–8741. doi: 10.1073/pnas.86.22.8737. [DOI] [PMC free article] [PubMed] [Google Scholar]
- 25.Blaskó A, Bruice T C. Proc Natl Acad Sci USA. 1993;90:10018–10022. doi: 10.1073/pnas.90.21.10018. [DOI] [PMC free article] [PubMed] [Google Scholar]
- 26.Mrksich K, Wade M, Dwyer W S, Geierstanger T J, Wemmer D E, Dervan P B. Proc Natl Acad Sci USA. 1992;89:7586–7590. doi: 10.1073/pnas.89.16.7586. [DOI] [PMC free article] [PubMed] [Google Scholar]
- 27.Blaskó A, Browne K A, Bruice T C. J Am Chem Soc. 1994;116:3726–3737. [Google Scholar]
- 28.Blaskó A, Browne K A, He G-H, Bruice T C. J Am Chem Soc. 1993;115:7080–7092. [Google Scholar]


