Abstract
The 2.2 Å resolution crystal structure of the Escherichia coli catabolite gene activator protein (CAP) complexed with cAMP and a 46-bp DNA fragment reveals a second cAMP molecule bound to each protein monomer. The second cAMP is in the syn conformation and is located on the DNA binding domain interacting with the helix-turn-helix, a β-hairpin from the regulatory domain and the DNA (via water molecules). The presence of this second cAMP site resolves the apparent discrepancy between the NMR and x-ray data on the conformation of cAMP, and explains the cAMP concentration-dependent behaviors of the protein. In addition, this site’s close proximity to mutations affecting transcriptional activation and its water-mediated interactions with a DNA recognition residue (E181) and DNA raise the possibility that this site has biological relevance.
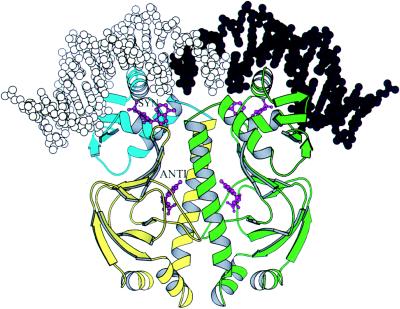
cAMP levels regulate the expression of more than 150 Escherichia coli genes through the catabolite gene activator protein (CAP), also known as the cyclic AMP receptor protein (1–3). Activation or repression of transcription by CAP requires that CAP binds cAMP, undergoes an allosteric conformational change, and binds DNA at specific sites near promoters. In the crystal structures of CAP complexed with cAMP or with cAMP and DNA, each CAP monomer has one molecule of cAMP bound in the anti conformation and buried in a pocket in the amino-terminal domain formed by an antiparallel β-roll structure and the C α-helices (Fig. 1) (5–8). Mutational analysis confirms the importance of side chains interacting with cAMP in the structures (9–13). In contrast to the crystallographic observations, transfer nuclear Overhauser effect (NOE) NMR measurements showed a rapidly exchanging cAMP molecule bound to CAP in the syn conformation (14, 15).
Figure 1.
A molscript (4) ribbon drawing of the CAP dimer bound to DNA and the two cAMP molecules (magenta) per monomer, one labeled SYN and the other, ANTI. In one monomer, the larger N-terminal domain is yellow, and the smaller C-terminal domain is blue, while the DNA half-site bound to it is light gray. The other subunit is green and the DNA bound to it is dark gray. The syn-cAMP lies on the helix-turn-helix and close to the DNA and a loop from the N-terminal domain. The DNA sequence of the half-site is 5′-ATGTCACATTAATTGCGTTGCGC-3′.
cAMP binds CAP with a dissociation constant of about 20 μM and enhances its DNA affinity for specific sequences (13, 16). However, at millimolar cAMP concentrations the affinity of CAP for DNA decreases (17–19). In addition, the rates of proteolytic digestion and modification of Cys-178, and the fluorescence of tryptophan and of an extrinsic probe revealed a biphasic dependence on cAMP concentration (17). One set of behaviors was seen at up to about 200 μM of cAMP and another set at higher concentrations. These results were explained by the presence of three conformational states: free CAP, CAP dimers with one cAMP molecule bound, and CAP dimers with two molecules of cAMP bound. It has been further argued that the biologically active complex is a dimer with one cAMP bound (17, 19).
We have determined the crystal structure of CAP complexed with a 46-bp DNA binding site at 2.2 Å resolution. In this structure, a second cAMP is bound to each monomer in the syn conformation in addition to the previously seen cAMP bound in the anti conformation, resolving the conflicting crystallographic and NMR observations. This suggests that the observed biphasic cAMP dependence of DNA binding and other conformational monitors is a consequence of the three conformational states: free CAP, CAP with two cAMP molecules per dimer bound to the previously observed binding site, and CAP with cAMP bound to both sites. The second binding site is located at an interface formed by the two CAP domains and is interacting with the helix-turn-helix as well as indirectly with the DNA. In addition, some residues shown to be important for transcriptional activation by CAP are located in the vicinity of this binding site (20–24).
MATERIALS AND METHODS
Crystals of CAP complexed with a 46-bp blunt-ended DNA duplex (6 mg/ml CAP and a 1.3 molar excess of DNA) were grown at room temperature by vapor diffusion at pH 6.0 in 4–6% polyethylene glycol 3350, 20% ethylene glycol, 0.2 M NaCl, 25 mM MgCl2, and 2 mM cAMP. The crystals were frozen at −160°C and data to 2.6 Å were collected on an R-axis imaging plate system, and a data set (≈80% complete) to 2.2 Å was collected at the CHESS F1 beamline on the 2K Princeton charge-coupled device detector. The crystals belong to the trigonal space group P3121, with unit cell dimensions a = b = 79.2 Å and c = 140.4 Å. There is one CAP–DNA monomer per asymmetric unit resulting from the dimer and crystallographic axes being coincident. The structure was solved initially by molecular replacement using as a search model the protein and the central eight base pairs from the CAP–DNA orthorhombic crystal form (8). Four platinum sites consistent with the molecular replacement solution were identified in a difference Fourier map comparing data from a crystal soaked in cis-[(NH3)2PtCl2] with the parent data and using phases calculated from the molecular replacement protein coordinates. Fourier difference maps were used to rebuild the model and to fit additional nucleotides as they became apparent in the electron density. To obtain better low-resolution phases for the difference maps, the phases from the cis-[(NH3)2PtCl2] derivative were combined with those from the protein coordinates of the molecular replacement solution. Finally, a molecule of cAMP in the syn conformation and 148 waters were added and the structure was refined to an R-factor of 23.6% (Rfree = 29.7%) with the 8- to 2.2-Å data, allowing 20,270 reflections (F > 2σ) for the refinement of 2,305 nonhydrogen atom positions. The root-mean-square deviation in bond lengths was 0.008 Å and in bond angles was 1.3°. About one helical turn of DNA at each end was not visible and presumed disordered. A full description of the structure determination and the CAP interactions with DNA will be published elsewhere (J.M.P., S. Schultz, and T.A.S., unpublished results).
RESULTS
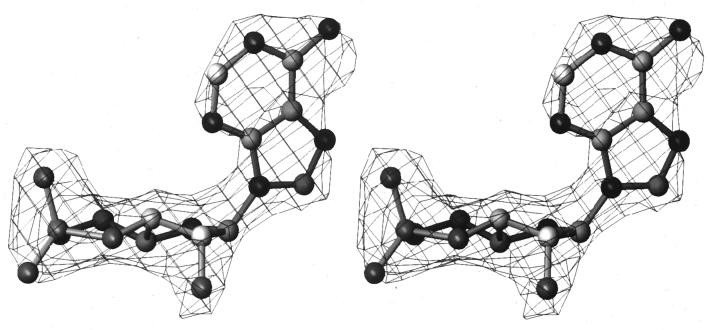
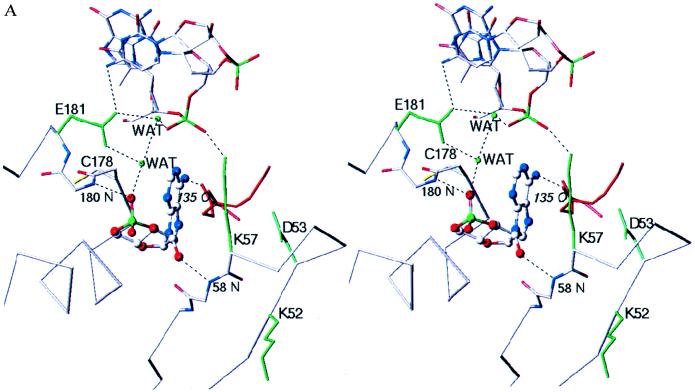
A molecule of cAMP bound to CAP in the syn conformation was discovered upon examination of a 2Fo−Fc electron density map, calculated using experimental phases at low resolution and those from the protein and DNA at high resolution; the O-2′ hydroxyl and the exocyclic N-6 could be positioned into protrusions of the electron density (Fig. 2). The cAMP molecule in the syn conformation binds between the helix-turn-helix (helices E and F) of the small domain and the loop formed by two antiparallel β-strands comprising a flap over the adenine ring of the cAMP molecule in the anti conformation (Fig. 1). Both domains of a monomer, the DNA and the other subunit all contribute to the formation of the syn-cAMP binding pocket (Fig. 3). The adenine base packs between the turn of the helix-turn-helix and the hydrophobic portion of Lys-57 whose amino group hydrogen bonds to a DNA phosphate oxygen; it also makes hydrophobic interactions with a sugar from the DNA backbone and packs against part of the C helix from the other subunit. The charged phosphate group is solvent exposed and interacts at the N terminus of the DNA recognition F helix, while the cAMP sugar packs on top of the hydrophobic part of Gln-174.
Figure 2.
Stereo view of the 2Fo-Fc “omit” electron density map at 2.2 Å resolution from which the syn-cAMP (ball-and-stick) was first identified. The density, contoured at 1.2 σ, was computed using experimentally determined phases from 25 to 8 Å and phases from 8 to 2.2 Å derived from the protein and DNA coordinates alone before any coordinates of the syn-cAMP were included in the phase and amplitude calculation.
Figure 3.
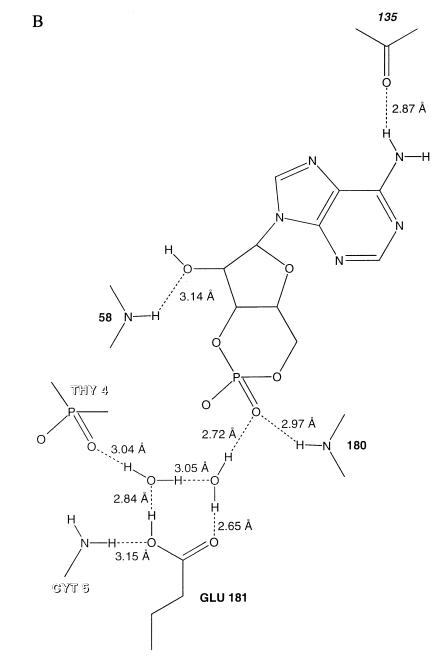
(A) Close-up stereo view of the syn-cAMP binding site. The syn-cAMP and an α-carbon trace of the helix-turn-helix and β-hairpin loop with which it interacts in one subunit (gray) are shown, as well as a region from the other subunit (red) that interacts with the cAMP; backbone atoms are included where interactions with the cAMP occur. The three DNA nucleotides nearest to the cAMP molecule are shown. The Cys-178 side chain, which has a lower reactivity at higher cAMP concentrations, has been included. In green are four protein side chains and two water molecules. Lys-52 and Asp-53 have been demonstrated by mutational analysis to be important for transcriptional activation (20–24), while the Glu-181 carboxylate is making both important sequence-specific DNA interactions and water-mediated interactions to the phosphates of cAMP and of DNA. (B) Diagram of the syn-cAMP and the hydrogen-bond interactions that are made to it. The hydrogen-bond distances given are measured between the donor and acceptor atoms in the structure. Glu-181 makes a water-mediated interaction with the cAMP phosphate. Residue 135 is from the other CAP subunit.
The cAMP makes hydrogen-bonding interactions with main chain atoms and water-mediated interactions with a DNA recognition side chain and DNA (Fig. 3). The adenine N-6 hydrogen bonds to the other subunit’s Ala-135 main chain carbonyl oxygen; the ribose O-2′ hydroxyl interacts with the Glu-58 backbone amide, while the Arg-180 main chain amide hydrogen bonds to the axial phosphate oxygen. This axial phosphate oxygen also hydrogen-bonds to a solvent molecule that is hydrogen-bonded to the Glu-181 carboxylate, which in turn recognizes the cytosine 5 bp from the dyad axis. This water hydrogen-bonds to another solvent molecule that interacts with both the other Glu-181 oxygen and to the other oxygen of the DNA phosphate that is interacting with the side chain amino group of Lys-57. For all these water-mediated interactions to occur, Glu-181 would have to be protonated (Fig. 3).
The previously solved orthorhombic CAP–DNA cocrystals were grown in 2 mM cAMP (8), a concentration at which both sites should be occupied. To assess whether a second cAMP molecule was missed in the earlier study, simulated annealing omit maps (25) in the regions in the orthorhombic crystal form where syn-cAMP molecules would be expected were calculated. In these maps, there is density in both monomers that is consistent with bound syn-cAMP molecules. Crystals of CAP-cAMP complex were grown from solutions containing 100 μM cAMP, and only the anti-cAMP is bound (5–7).
DISCUSSION
The identification of a second cAMP binding site in CAP resolves a long-standing discrepancy between crystallographic and NMR observations on the conformation of cAMP bound to CAP. In the CAP–DNA structure presented here, two cAMP molecules are bound to each protein monomer. One cAMP in the anti conformation is buried within the amino-terminal domain of the protein as seen previously (5–8), and a second cAMP binds in the syn conformation near the DNA between the two CAP domains. Transfer NOE measurements had indicated that cAMP binds to CAP in the syn conformation in contrast to the crystallographic observations. Transferred NOEs are observed between the H5′ and H2 protons and between the H1′ and H8 hydrogens, as expected for the syn conformation, and not between the H5′ and H8 protons, which would be expected for the anti conformation (14, 15). However, the NMR measurements were performed at a 3.3 mM cAMP concentration, a concentration at which we now suggest both sites should be occupied, even in the absence of DNA. To observe the transfer NOE in the NMR experiments, the chemical exchange rate between the bound and the free states of the ligand must be more than an order of magnitude greater than the total spin-lattice relaxation rate of the free ligand proton being observed (26). Therefore, if the anti-cAMP is in slow exchange, which is plausible because it is buried between the subunits in the cAMP binding domain, and if the syn-cAMP is in fast exchange, which is likely because it is much more solvent-accessible in the structure, then only the syn-cAMP would yield the observed transferred NOEs. This interpretation is corroborated by 19F NMR spectra of 3-fluorotyrosine containing CAP, which has a signal that shows both slow and fast exchange behavior during a titration with cAMP, with dissociation rates ≤75 s−1 and ≥350 s−1 (27). These results are consistent with the measured dissociation rate of 69 s−1 at cAMP concentrations of 1–50 μM, a concentration at which only the anti site should be occupied (28).
In addition, experiments demonstrating the biphasic dependence of several conformational probes on cAMP concentration as well the decreased DNA affinity at millimolar cAMP concentrations (17–19) can be explained by a new model. The four conformational probes monitored, the rates of proteolytic digestion and modification of Cys-178, the tryptophan fluorescence, and the fluorescence of an extrinsic probe, displayed two cAMP concentration-dependent behaviors (17). One set was seen at up to ≈200 μM of cAMP and another set at higher concentrations. These observations had been explained earlier as a result of the presence of three conformational states: free CAP, and CAP dimers with one and two molecules of cAMP bound, respectively, to the anti binding site. Our observation of a second binding site in each monomer allows these experiments to be reinterpreted in terms of a new model involving three states (i.e., free CAP, CAP with two molecules of cAMP bound to the anti binding site, and CAP with two molecules of cAMP bound to the anti and two to the syn binding sites). For example, increasing concentrations of cAMP by up to 200 μM increased the reactivity of Cys-178, whereas higher concentrations decreased its reactivity. In all of the CAP structures the sulfur of Cys-178 is buried. However, if the Cys-178 side chain were free to rotate, then the thiol could become solvent-exposed. Because the backbone of Cys-178 forms part of the syn-cAMP binding pocket (Fig. 3A), binding of syn-cAMP may suppress the “breathing” motions of the main chain required for the reaction of Cys-178.
The location of the syn-cAMP binding site is consistent with the possibility that it may have some biological role, since its position could affect DNA binding and transcriptional activation by CAP (for at least some promoters). The second cAMP molecule is adjacent to the helix-turn-helix that interacts with DNA. The syn-cAMP also makes a water-mediated contact to Glu-181, which interacts with cytosine-5 (8) and has been shown by mutational analysis to be important for DNA-binding specificity (29, 30). Furthermore, the syn-cAMP interacts with a loop formed by two antiparallel β-strands containing residues (Fig. 3) that are important for transcriptional activation by CAP (20). Potentially significant is Lys-52, whose mutation affects CAP activation at Class II promoters, where the CAP binding site is centered near −41 bp from the transcription start site (21–24). Because of the close proximity of this cAMP site to Lys-52, it is tempting to speculate that the syn-cAMP might play some role in the regulation of Class II promoters and in CAP’s ability to differentially regulate promoters.
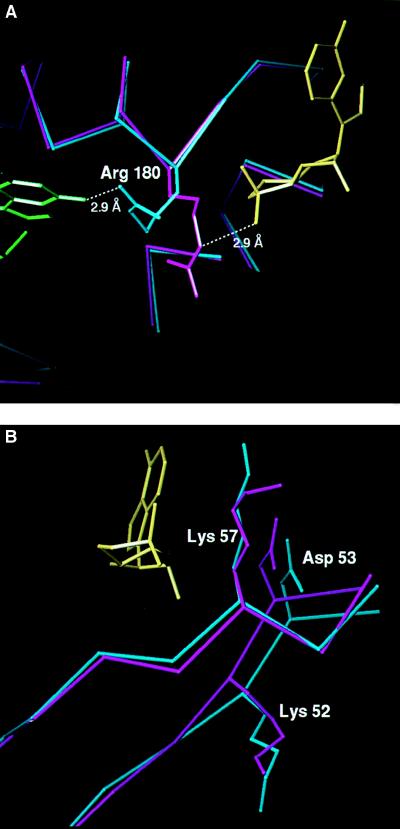
This second cAMP binding site can account for the decreased affinity of CAP for specific DNA at high concentrations of cAMP. At millimolar cAMP concentrations, nonspecific DNA competes more efficiently with the lac promoter for binding to CAP (17), and Taniguchi et al. (31) noted an increased affinity of CAP for nonspecific DNA at 500 μM cAMP. The decreased affinity of CAP for DNA may arise from a competition between the DNA and the phosphate of cAMP for Arg-180, which is suggested by comparing this structure with that of CAP-cAMP (Fig. 4A). In this DNA complex the Arg-180 side chain interacts with the DNA in the major groove (8) and has been shown by mutational analysis to be important for DNA binding specificity (32, 33). However, its conformation in the CAP-cAMP complex would place the guanadinium group about 3 Å closer to the syn-cAMP phosphate and capable of hydrogen-bonding to it. Therefore, in the absence of DNA, Arg-180 may interact with the syn-cAMP phosphate, but upon binding DNA this interaction does not occur and the Arg-180 side chain interacts with DNA. Additionally, at pH 7, where Glu-181 might not be protonated as it is in these crystals at pH 6.0, the decreased affinity could result in part from the proximity of the syn-cAMP phosphate to the Glu-181 carboxylate and to a DNA phosphate 7.7 Å away. Heyduk and Lee (17) suggested that because CAP autoregulates its own expression by repressing transcription of the CAP gene (34), the decreased DNA affinity of CAP at high cAMP concentrations could allow de-repression of the expression of the CAP gene.
Figure 4.
Comparison of part of the DNA binding domain (A) and the β-hairpin loop (B) structures of CAP complexed with only one cAMP per subunit (magenta) with that of CAP complexed with DNA and two cAMP molecules per subunit (cyan). (A) α-Carbon backbones of the small domains were superimposed. In the structure of CAP complexed with only one cAMP per subunit and without DNA, Arg-180 could hydrogen-bond with the phosphate of the syn-cAMP (yellow); whereas in the structure of CAP complexed with DNA and two cAMP molecules per subunit, Arg-180 hydrogen bonds to guanosine-7. (B) α-Carbon backbones of the large domains, excluding the β-hairpin loop, were superimposed, and the side chains for Lys-52, Asp-53, and Lys-57 are shown.
Although the affinity of the protein alone for syn-cAMP appears too low to be physiologically relevant, there are several ways that the syn-cAMP binding site might be occupied under physiological conditions. The biphasic cAMP concentration dependence of CAP suggests a binding constant for the weaker binding site of ≈1 mM (17–19), a cAMP concentration rarely, if ever, found in E. coli (35). However, the affinity of this second site for cAMP could increase in the presence of other components found in vivo, such as RNA polymerase, if they stabilize the appropriate conformation of CAP. In this syn-cAMP complex, the conformation of that part of the syn-cAMP binding site containing Lys-52 (Fig. 4B) is changed from its conformation in the CAP complex with one cAMP per subunit. If CAP-cAMP bound to DNA interacts with another protein that stabilizes the CAP protein conformation that binds syn-cAMP and/or provides additional cAMP contacts, then the affinity of CAP for syn-cAMP would be increased. Alternatively, if CAP were associated with adenylate cyclase, as some preliminary data may show (Susan Garges, personal communication), then it is possible that under some physiological conditions the local concentration of cAMP in the vicinity of CAP might reach the millimolar concentrations necessary for the syn-cAMP to bind. Nevertheless, although the location of this second cAMP binding site on CAP is intriguing, its role, if any, in the CAP-mediated regulation of gene expression can only be assessed from further experiments.
Acknowledgments
We thank Steve Schultz for assistance and advice in the early stages of the crystal structure determination and Susan Garges for useful discussions. This work was supported by National Institutes of Health Grant GM22778.
ABBREVIATIONS
- CAP
catabolite gene activator protein
- NOE
nuclear Overhauser effect
Footnotes
Data deposition: The atomic coordinates and structure factors have been deposited in the Protein Data Bank, Chemistry Department, Brookhaven National Laboratory, Upton, NY 11973 (accession no. 2CGP).
References
- 1.deCrombrugghe B, Busby S, Buc H. Science. 1984;224:831–838. doi: 10.1126/science.6372090. [DOI] [PubMed] [Google Scholar]
- 2.Crothers D M, Steitz T A. Transcriptional Activation by Escherichia coli CAP Protein. Plainview, NY: Cold Spring Harbor Lab. Press; 1992. pp. 501–534. [Google Scholar]
- 3.Reznikoff W S. J Bacteriol. 1992;174:655–658. doi: 10.1128/jb.174.3.655-658.1992. [DOI] [PMC free article] [PubMed] [Google Scholar]
- 4.Kraulis P J. J Appl Cryst. 1991;24:946–950. [Google Scholar]
- 5.McKay D B, Steitz T A. Nature (London) 1981;290:744–749. doi: 10.1038/290744a0. [DOI] [PubMed] [Google Scholar]
- 6.McKay D B, Weber I T, Steitz T A. J Biol Chem. 1982;257:9518–9524. [PubMed] [Google Scholar]
- 7.Weber I T, Steitz T A. J Mol Biol. 1987;198:311–326. doi: 10.1016/0022-2836(87)90315-9. [DOI] [PubMed] [Google Scholar]
- 8.Schultz S C, Shields G C, Steitz T A. Science. 1991;253:1001–1007. doi: 10.1126/science.1653449. [DOI] [PubMed] [Google Scholar]
- 9.Gronenborn A M, Sandulache R, Gartner S, Clore G M. Biochem J. 1988;253:801–807. doi: 10.1042/bj2530801. [DOI] [PMC free article] [PubMed] [Google Scholar]
- 10.Moore J, Kantorow M, Vanderzwaag D, McKenney K. J Bacteriol. 1992;174:8030–8035. doi: 10.1128/jb.174.24.8030-8035.1992. [DOI] [PMC free article] [PubMed] [Google Scholar]
- 11.Belduz A O, Lee E J, Harman J G. Nucleic Acids Res. 1993;21:1827–1835. doi: 10.1093/nar/21.8.1827. [DOI] [PMC free article] [PubMed] [Google Scholar]
- 12.Lee E J, Glasgow J, Leu S F, Belduz A O, Harman J G. Nucleic Acids Res. 1994;22:2894–2901. doi: 10.1093/nar/22.15.2894. [DOI] [PMC free article] [PubMed] [Google Scholar]
- 13.Gorshkova I, Moore J L, McKenney K H, Schwarz F P. J Biol Chem. 1995;270:21679–21683. doi: 10.1074/jbc.270.37.21679. [DOI] [PubMed] [Google Scholar]
- 14.Gronenborn A M, Clore G M, Blazy B, Baudras A. FEBS Lett. 1981;136:160–164. doi: 10.1016/0014-5793(81)81237-9. [DOI] [PubMed] [Google Scholar]
- 15.Gronenborn A M, Clore G M. Biochemistry. 1982;21:4040–4048. doi: 10.1021/bi00260a020. [DOI] [PubMed] [Google Scholar]
- 16.Takahashi M, Blazy B, Baudras A. Biochemistry. 1980;19:5124–5130. doi: 10.1021/bi00563a029. [DOI] [PubMed] [Google Scholar]
- 17.Heyduk T, Lee J C. Biochemistry. 1989;28:6914–6924. doi: 10.1021/bi00443a021. [DOI] [PubMed] [Google Scholar]
- 18.Heyduk T, Lee J C. Proc Natl Acad Sci USA. 1990;87:1744–1748. doi: 10.1073/pnas.87.5.1744. [DOI] [PMC free article] [PubMed] [Google Scholar]
- 19.Pyles E A, Lee J C. Biochemistry. 1996;35:1162–1172. doi: 10.1021/bi952187q. [DOI] [PubMed] [Google Scholar]
- 20.Aiba H, Nakamura T, Mitani H, Mori H. EMBO J. 1985;4:3329–3332. doi: 10.1002/j.1460-2075.1985.tb04084.x. [DOI] [PMC free article] [PubMed] [Google Scholar]
- 21.Bell A, Gaston K, Williams R, Chapman K, Kolb A, Buc H, Minchin S, Williams J, Busby S. Nucleic Acids Res. 1990;18:7243–7250. doi: 10.1093/nar/18.24.7243. [DOI] [PMC free article] [PubMed] [Google Scholar]
- 22.Williams R, Bell A, Sims G, Busby S. Nucleic Acids Res. 1991;19:6705–6712. doi: 10.1093/nar/19.24.6705. [DOI] [PMC free article] [PubMed] [Google Scholar]
- 23.West D, Williams R, Rhodius V, Bell A, Sharma N, Zou C, Fujita N, Ishihama A, Busby S. Mol Microbiol. 1993;10:789–797. doi: 10.1111/j.1365-2958.1993.tb00949.x. [DOI] [PubMed] [Google Scholar]
- 24.Williams R, Rhodius V, Bell A, Kolb A, Busby S. Nucleic Acids Res. 1996;24:1112–1118. doi: 10.1093/nar/24.6.1112. [DOI] [PMC free article] [PubMed] [Google Scholar]
- 25.Brunger, A. T. (1993) xplor Manual (Yale University, New Haven, CT), Version 3.1.
- 26.Clore G M, Gronenborn A M. J Magn Reson. 1982;48:402–417. [Google Scholar]
- 27.Hinds M G, King R W, Feeney J. FEBS Lett. 1991;283:127–130. doi: 10.1016/0014-5793(91)80569-o. [DOI] [PubMed] [Google Scholar]
- 28.Wu C-W, Wu F Y-H. Biochemistry. 1974;13:2573–2578. doi: 10.1021/bi00709a016. [DOI] [PubMed] [Google Scholar]
- 29.Ebright R H, Cossart P, Gicquel-Sanzey B, Beckwith J. Nature (London) 1984;311:232–235. doi: 10.1038/311232a0. [DOI] [PubMed] [Google Scholar]
- 30.Ebright R H, Kolb A, Buc H, Kunkel T A, Krakow J S, Beckwith J. Proc Natl Acad Sci USA. 1987;84:6083–6087. doi: 10.1073/pnas.84.17.6083. [DOI] [PMC free article] [PubMed] [Google Scholar]
- 31.Taniguchi T, O’Neill M, de Crombrugghe B. Proc Natl Acad Sci USA. 1979;76:5090–5094. doi: 10.1073/pnas.76.10.5090. [DOI] [PMC free article] [PubMed] [Google Scholar]
- 32.Gent M E, Gronenborn A M, Davies R W, Clore G M. Biochem J. 1987;242:645–653. doi: 10.1042/bj2420645. [DOI] [PMC free article] [PubMed] [Google Scholar]
- 33.Zhang X P, Ebright R H. Proc Natl Acad Sci USA. 1990;87:4717–4721. doi: 10.1073/pnas.87.12.4717. [DOI] [PMC free article] [PubMed] [Google Scholar]
- 34.Aiba H. Cell. 1983;32:141–149. doi: 10.1016/0092-8674(83)90504-4. [DOI] [PubMed] [Google Scholar]
- 35.Pastan I, Adhya S. Bacteriol Rev. 1976;40:527–551. doi: 10.1128/br.40.3.527-551.1976. [DOI] [PMC free article] [PubMed] [Google Scholar]


