

Abstract
A method for the direct selection of RNA molecules that can be easily converted into beacon aptamers is presented. Beacon aptamers are fluorescently labeled nucleic acids that signal the presence of a specific ligand through changes in fluorescence intensity. Typically, ligand binding causes an increase in fluorescence intensity by inducing a conformational change that separates a fluorophore/quencher pair. The method presented here simultaneously selects for ligand binding and induction of an appropriate conformational change. The method was tested by selecting RNA molecules that can detect the aminoglycoside antibiotic tobramycin. After 14 rounds of selection, two sequence families emerged. Upon conversion into beacon aptamers, representatives of the two selected sequence families specifically detected tobramycin, while a negative control RNA that did not survive the selection protocol did not function as a tobramycin beacon aptamer.
Keywords: RNA, aptamer, beacon, in vitro selection, tobramycin, fluorescence
Aptamers are nucleic acids, selected from randomized sequence pools, that bind tightly and specifically to a desired ligand. Aptamers have been used for a variety of analytical and therapeutic applications [1–4]. Several different strategies have been used to convert aptamers into sensors that can signal the presence of their cognate ligands [5–7]. A beacon aptamer is a type of “structure-switching signaling aptamer” that combines the signaling mechanism of molecular beacons [8] with the ligand-binding specificity of aptamers (Fig. 1A). Attempts to convert standard aptamers into signaling aptamers have met with some success [9–11]. However, standard aptamers are selected only for their ability to bind to a ligand, so most are unlikely to undergo the appropriate conformational change required for signaling. Consequently, there has been interest in developing methods for direct selection of functional signaling aptamers. A strategy for accomplishing this was suggested by Rajendran and Ellington [12] and first carried out by Nutiu and Li [13]. Nutiu and Li successfully selected DNA aptamers that signaled the presence of ATP or GTP. In their approach, signaling occurred through a “duplex-to-complex structure-switching” mechanism (Fig. 1B). Here, a similar strategy is employed to select RNA molecules that can be converted into beacon aptamers. As in the method of Nutiu and Li, the strategy directly selects for molecules that undergo the required conformational change upon ligand binding. Thus, every molecule that survives the selection should, in principle, be able to function as a beacon aptamer. In a proof-of-principle experiment, two RNA sequence families emerged from a selection for molecules that could detect the antibiotic tobramycin. Upon conversion into beacon aptamers, representatives of both families showed modest but reproducible increases in fluorescence in the presence of trobramycin. A comparison of these results to those of Nutiu and Li provides useful insight into developing an optimal selection strategy.
Fig. 1.
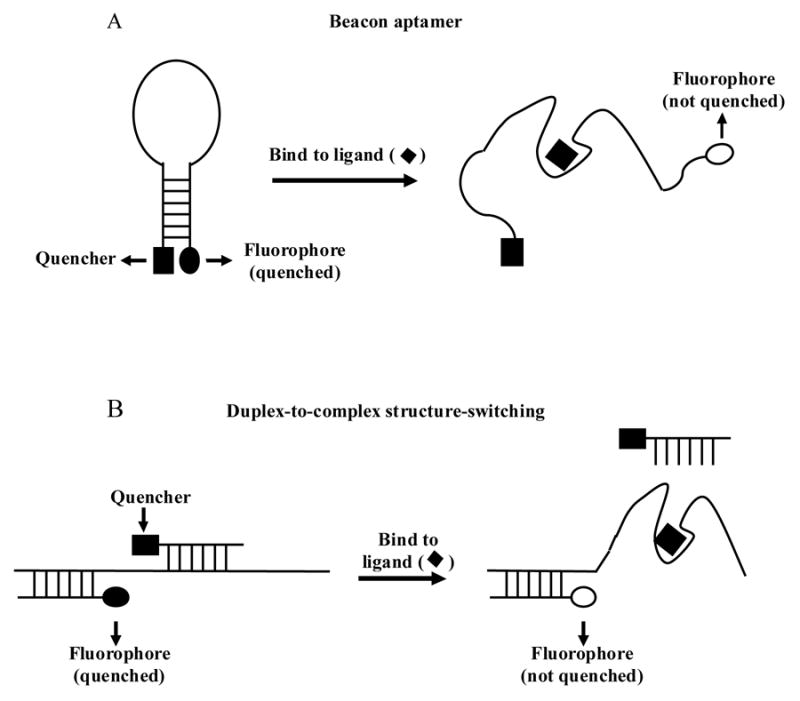
Comparison of two types of “structure-switching signaling aptamer”. Ligand binding to a beacon aptamer disrupts an intramolecular duplex. Signaling through the duplex-to-complex structure-switching mechanism requires disruption of an intermolecular duplex. In both strategies, structure-switching separates a fluorophore from a quencher resulting in increased fluorescence intensity.
Materials and methods
Oligonucleotides
DNA oligonucleotide DM001 was obtained from Operon. DNA oligonucleotides DM002, DM003, DM004, and DM006 were obtained from Invitrogen. All other DNA and RNA oligonucleotides were obtained from Integrated DNA Technologies, Inc (IDT).
DM001 (5′-GAATGGATCCACATCTACGAN60TTCACTGCAGACTTGACGAA-3′; N60 is the 60 nucleotide randomized region. This oligo was purified by reverse-phase HPLC followed by ion-exchange HPLC.)
DM002 (5′-CATTCC-3′-biotin; biotin was attached via a 9 carbon spacer)
DM003 (5′-GATAATACGACTCACTATAGGAATGGATCCACATCTACGA-3′)
DM004 (5′-AAGCTTCGTCAAGTCTGCAGTGAA-3′)
DM006 (5′-GGAATGAAGCTTCGTCAAGTCTGCAGTGAA-3′)
DM011 (5′-GATAATACGACTCACTATAGG-3′)
DM013 (5′-GATAATACGACTCACTATAGGCTTTGAAGGTGAGACCGTGCAA-3′)
DM014 (5′-GATAATACGACTCACTATAGAACTCTTCGAGGTCGCTCGCAA-3′)
RNA1 (IBFQ-5′-GGAAUGGAUCCACAUCUACGAAUUGGCCGUGGAAUGG-3′; IBFQ is “Iowa Black” fluorescence quencher)
RNA3 (IBFQ-5′-GGAAUGGAUCCACAUCUACGAA-3′)
Binding of biotinylated DNA to streptavidin-coated magnetic beads
1.2 nmol of DM002 (biotinylated 6-mer DNA oligonucleotide) was bound to 400 μL of suspended streptavidin-coated magenetic beads (Dynal) according to manufacturers instructions. Beads were resuspended in 400 μL of binding buffer containing 0.02% sodium azide and stored at 4°C. Efficiency of DM002 binding was estimated by comparing the absorbance at 260 nm of the unbound fraction from the complete reaction to that from an identical reaction lacking beads. Typically about 200 pmol of DM002 bound to 100 μL of beads. Below, the beads are designated as “DM002 beads”
Preparation of original randomized RNA pool
The original RNA pool was produced by in vitro transcription. It consisted of 32P-labeled molecules that were 105 nucleotides long with a central 60 nucleotide randomized region. Randomized region was flanked by constant regions of 21 nucelotides at the 5′ end and 24 nucleotides at the 3′ end. 5 nmol (~3 x 10¹⁵ molecules) of DM001 were amplified in a total volume of 40 mL that was divided into two 96 well plates. Reactions contained 0.125 μM DM001, 1 μM DM003, 1 μM DM004 , 200 μM dNTPs, 1X buffer (provided with enzyme) and 12.5 U/mL Taq DNA polymerase (New England Biolabs). 14 cycles were performed: 95°C, 30 sec; 50°C, 30 sec; 72°C, 30 sec. Reactions were pooled and the DNA was precipitated with ammonium acetate and ethanol, dissolved in 800 μL of water, extracted once with phenol:chloroform:isoamyl alcohol (25:24:1), reprecipitated and dissolved in 400 μL of water. Total yield was approximately 1 mg (~15 nmol). 50 μg (~4 x 10¹⁴ molecules) of the PCR product was used as the template in a 100 μL transcription reaction containing 1X buffer (provided with enzyme), 1.5 mM NTPs, 40 μCi [α-32P] ATP (PerkinElmer), 10 mM DTT, and 0.33 U/μL T7 RNA polymerase (Invitrogen). DNA templates were destroyed with RNase-free DNase I (Invitrogen). Reaction was extracted twice with phenol:chloroform:isoamyl alcohol and the RNA was precipitated, redissolved, and purified from a 10% polyacrylamide gel containing 7 M urea. Total yield was approximately 36 μg with a specific activity of about 5 μCi/nmol RNA.
Selection procedure
Each round of selection included the following steps (see Fig. 2): binding of RNA to DM002 beads (through base-pairing); washing of beads to remove unbound RNA; elution of bound RNA with tobramycin; and regeneration of DM002 beads for the next round of selection. After each step, the beads were captured with a magnetic stand and the supernatant was removed. Binding, washing, and elution steps were all performed at 4°C with pre-cooled solutions. Buffer for all steps was 50 mM Tris pH 7.4, 500 mM NaCl (binding buffer). 100 μL of DM002 beads were washed twice with 200 μL of binding buffer and resuspended in 100 μL of binding buffer containing 30 μg of 32P-labeled RNA. Sample was heated at 65°C for 5 min and cooled slowly to room temperature with occasional mixing. Sample was rotated overnight at 4°C. Beads were quickly rinsed twice with 200 μL of binding buffer and washed extensively by rotating in 200 μL of binding buffer. Beads were washed 4 times for 15 min and once for 30 min. Bound RNA was eluted by rotating for 30 min in 200 μL of binding buffer containing tobramycin (see Table 1 for tobramycin concentrations). Beads were regenerated by suspending in 400 μL of binding buffer and heating at 65°C for 5 min. A fresh aliquot of DM002 beads was used after 4 rounds of selection. Amount of RNA in each supernatant was determined by counting an aliquot in a scintillation counter. Amount of RNA that bound specifically (through base-pairing) to the DM002 beads was calculated as the amount of RNA that eluted with tobramycin plus the amount of RNA that was removed by heating the beads at 65°C.
Fig. 2.

RNA selection strategy. (Step 1) RNA is transcribed from a randomized DNA template that contains a T7 RNA polymerase promoter (boxed). Transcription begins at the G immediately following the promoter. N60 is a 60 nucleotide randomized region. (Step 2) Randomized RNA molecules are bound to a stationary phase through base-pairing with an immobilized DNA oligonucleotide. The oligonucleotide is biotinylated at its 3′ end and immobilized by binding to streptavidin-coated magnetic beads. (Step 3) Beads are washed with buffer to remove unbound RNA (Step 4) RNA is eluted with the desired ligand. RNA elution requires that ligand binding disrupts the intermolecular duplex (5′-GGAAUG-3′ paired with 5′-CATTCC-3′). (Step 5) Eluted RNA is converted to cDNA and amplified to produce the transcription template for the next round of selection. Repeated rounds of selection enrich for RNA molecules that can be eluted by the ligand. Selected RNA molecules are converted to beacon aptamers by (Step 6) adding CAUUCC to their 3′ ends and (Step 7) labeling the ends with fluorophore and quencher.
Table 1.
Progress of selection
| Round | pmol RNA initially bound** | [tobramycin] | % of bound RNA eluted by tobramycin |
|---|---|---|---|
| 1 | 170 | 100 μM | 1.6 |
| 2 | 180 | 1.2 | |
| 3 | 202 | 1.7 | |
| 4 | 205 | 2.5 | |
| 5 | 151 | 2.5 | |
| 6 | 187 | 2.5 | |
| 7 | 212 | 3.5 | |
| 8 | 196 | 2.7 | |
| 9 | 179 | 6.4 | |
| 10 | 93 | 10 | |
| 11 | 62 | 17 | |
| 12 | 68 | 16 | |
| 13 | 71 | 16 | |
| *12–2 | 67 | 20 μM | 8.0 |
| *13–2 | 64 | 11 | |
| 14 | 51 | 11 | |
| *14–2 | 63 | 4 μM | 5.9 |
| 15 | 55 | 4.9 | |
| 16 | 62 | 3.4 |
RNA eluted in round 11 was used in round 12 and in round 12–2. RNA eluted in round 12–2 was used in round 13–2. RNA eluted in round 13–2 was used in round 14 and in round 14–2.
The amount of bound RNA was calculated as the amount of RNA eluted by tobramycin plus the amount of RNA eluted by buffer at 65°C.
Preparation of RNA for subsequent rounds of selection
After each round of selection, eluted RNA was amplified by RT-PCR followed by transcription from the PCR-generated template (see Fig. 2). Eluted RNA was heated at 65°C for 5 min and precipitated with ethanol using 20 μg of glycogen (Roche) as carrier. RNA was converted into cDNA with Superscript III reverse transcriptase (Invitrogen) and DM004 as primer. cDNA was amplified by PCR using DM003 and DM004 as primers. RNA was transcribed and purified as described above.
Cloning and sequencing of cDNAs and structure predictions
cDNAs were prepared from selected RNAs as described in the previous section and cloned using the TOPO TA cloning kit (Invitrogen) according to the manufacturer’s instructions. Inserts were sequenced using the M13 reverse primer. Secondary structure predictions were made using the program Mfold version 2.3 (www.bioinfo.rpi.edu/applications/mfold/rna/form1–2.3.cgi).
Preparation of full length, labeled, beacon aptamers
In vitro transcription of full length RNA followed by labeling with quencher and fluorophore resulted in inefficient quencher labeling. Since the RNA was too long to synthesize chemically, full length beacon aptamers (designated BA14–1, BA14–2, and BA6–8) were prepared by ligation of two smaller RNA molecules. (Ligation junctions are marked with an arrow in Supplement 1.) 5′ RNA fragments were synthesized chemically and labeled at their 5′ ends with Iowa Black Fluorescence Quencher (IDT). Nearly 100% of the synthetic RNA was labeled with quencher. 3′ RNA fragments were produced by transcription from PCR-generated templates and labeled at their 3′ ends with fluorescein. To prepare the 3′ RNA fragments for ligation, the 5′-terminal triphosphates were replaced with a single phosphate group. by first dephosphorylating with alkaline phosphatase (USB) and then adding a single phosphate with T4 polynucleotide kinase (USB). 3′-ends of transcription products were oxidized with sodium periodate and labeled by reaction with fluorescein thiosemicarbazide. 400 μL fluorescein labeling reactions contained 200 μg RNA, 100 mM sodium acetate pH 5.5, and 6 mM fluorescein thiosemicarbazide (Invitrogen). Reactions were incubated at room temperature for 2 hr in the dark and RNA was precipitated with ethanol. Labeled 5′ and 3′ RNA fragments were ligated using T4 RNA ligase (Ambion). Equimolar amounts (~8 nmol) of the two RNAs were heated to 75°C for 2 minutes and slow cooled to room temperature in 200 μL of 50 mM Tris-HCl, pH 7.4 and 100 mM NaCl. Annealed RNA was precipitated with ethanol and dissolved in water. 200 μL ligation reactions contained annealed RNAs, 1X ligation buffer (supplied with enzyme; buffer included ATP) and 50 U RNA ligase. Reactions were incubated at 15°C overnight (~16 hrs), extracted once with phenol-chloroform-isoamyl alcohol, precipitated with ethanol and dissolved in water. Transcription templates for generating the 3′ fragments of BA14–1, BA14–2, and BA6-8 were amplified from the corresponding plasmids. For each amplification, DM006 was the downstream primer. The upstream primers were DM011 (BA14–1), DM013 (BA14–2), and DM014 (BA6–8). 5′ fragments were RNA1 (BA14–1) or RNA3 (BA14–2 and BA6–8). Ligation products were purified from a 10% polyacrylamide gel containing 7 M urea.
Beacon aptamer assays
100 μL reactions contained 50 nM RNA, 50 mM Tris-HCl pH 7.4, 500 mM NaCl, and various concentrations of either tobramycin or paromomycin (Sigma). Identical reactions lacking RNA were used to measure background fluorescence. Prior to measuring the fluorescence intensity, reactions were heated to 55°C for 10 min followed by 1 hr at 22°C. Fluorescence was measured in a Modulus fluorometer (Turner Biosystems) using the blue optical kit and the minicell adaptor. Maximum possible fluorescence for each RNA was measured by including a 100-fold molar excess of DM006 in the reaction to competitively displace intramolecular hybridization between ends of the beacon aptamers.
Statistical Analysis
Sigma Plot 8.0 (SPSS Inc.) was used to fit the fluorescence data to the equation for ligand binding to a single saturable site. To determine the lowest detectable concentration of tobramycin, a two-tailed t-test was performed using pooled standard deviations. Fluorescence intensity of BA14–2 increased significantly when the concentration of tobramycin was greater than or equal to 30 μM (at 5 μM, p < 0.15; at 30 μM or higher, p < 0.01). Fluorescence intensity of BA14–1 increased significantly (p < 0.01) when the concentration of tobramycin was greater than or equal to 200 μM.
Results and Discussion
The strategy
The selection strategy outlined in Figure 2 was designed to select RNA molecules that undergo an appropriate conformational change upon binding to a ligand of interest (see Materials and methods). The key to the selection procedure is that RNA elution requires the ligand to disrupt the intermolecular duplex formed between the RNA and an immobilized oligonucleotide. The conformational change required for elution is identical to that required of a functional beacon aptamer (compare Figs. 1 and 2). Two modifications convert selected molecules into beacon aptamers. First, the sequence of the immobilized oligonucleotide (CAUUCC) is added to the 3′ end of each selected RNA, allowing homologous base-pairing with the 5′ end of the same molecule. This converts the two-molecule system used for selection into a single RNA molecule that can form an intramolecular duplex. Second, the two RNA ends are labeled with a fluorophore and quencher, respectively.
A proof of principle experiment: selection of tobramycin beacon aptamers
To test the selection strategy, the aminoglycoside antibiotic tobramycin was used as the ligand. Tobramycin was chosen for two reasons. First, previously selected tobramycin aptamers are among the highest affinity small-molecule aptamers known [14]. Second, the availability of closely related antibiotics facilitated testing of ligand specificity.
The initial RNA pool consisted of molecules that were 105 nucleotides long with a central 60 nucleotide randomized region (Fig. 2). A relatively long randomized region was chosen to maximize the number of different functions represented in the RNA pool. The progress of the selection is shown in Table I. In the first nine rounds of selection, an average of 187 pmol of RNA bound to the magnetic beads. This represents approximately 1014 unique sequences. Since there was about 200 pmol of the small complementary oligonucleotide bound to the beads (see Materials and methods), the column was nearly saturated with RNA in the early rounds. Little to no RNA binding occurred when the magnetic beads lacked the immobilized DNA oligonucleotide (data not shown) indicating that binding occurred through base-pairing as desired. The amount of bound RNA dropped to about 93 pmol in round 10 and to about 60 pmol in the remaining rounds.
In rounds 1 through 13, RNAs were eluted with 100 μM tobramycin. The percentage of bound RNAs that eluted increased from about 1.5% in the early rounds to 17% in round 11. This percentage did not increase in rounds 12 and 13, so RNA eluted in round 11 was used in the next round of selection (round 12–2) and the concentration of tobramycin was dropped to 20 μM. The percentage of bound RNAs that eluted with 20 μM tobramycin dropped to 8% in round 12–2, and increased to a maximum of 11% in the next round (round 13–2). When the tobramycin concentration was decreased to 4 μM, only 6% of the bound RNA eluted and the percentage decreased further in subsequent rounds.
RNAs that eluted in rounds 6, 11, and 14 were converted to cDNAs and cloned. 15 individual clones were sequenced from rounds 6 and 11, and 30 clones were sequenced from round 14. The results are summarized in Table 2. In round 6, the 15 sequences were unrelated to each other and none of them reappeared in rounds 11 or 14. In round 11, 6 different sequence families were represented, 3 of which were also present in round 14 (families 1, 2, and 3). Two families were highly enriched in round 14. Of the 30 clones sequenced, family 1 and family 2 were each represented 13 times.
Table 2.
Summary of sequencing results
| Round | Number of clones sequenced | Sequence families present | Number of family members represented |
|---|---|---|---|
| 6 | 15 | 15 unrelated sequences | 1 each |
| 11 | 15 |
Family 1
Family 2 Family 3 Family 4 Family 5 Family 6 |
2
5 3 2 2 1 |
| 14 | 30 |
Family 1
Family 2 Family 3 Family 7 Family 8 |
13
13 2 1 1 |
Families 1 and 2 are unrelated to each other and bear no resemblance to previously selected tobramycin aptamers [14].
There was very little sequence variation among the 13 isolated members of sequence families 1 and 2 (Fig. 3). This was due to the large size of the randomized region. With 60 randomized nucleotides, the number of possible sequences is 460 = 1.3 x 1036. However, the initial RNA pool contained only about 1014 sequences which is a vanishingly small fraction of the total possible number. Therefore, each sequence family was likely represented initially by only one member. The variants that did appear were probably the result of mutations that occurred during RT-PCR and transcription.
Fig. 3.
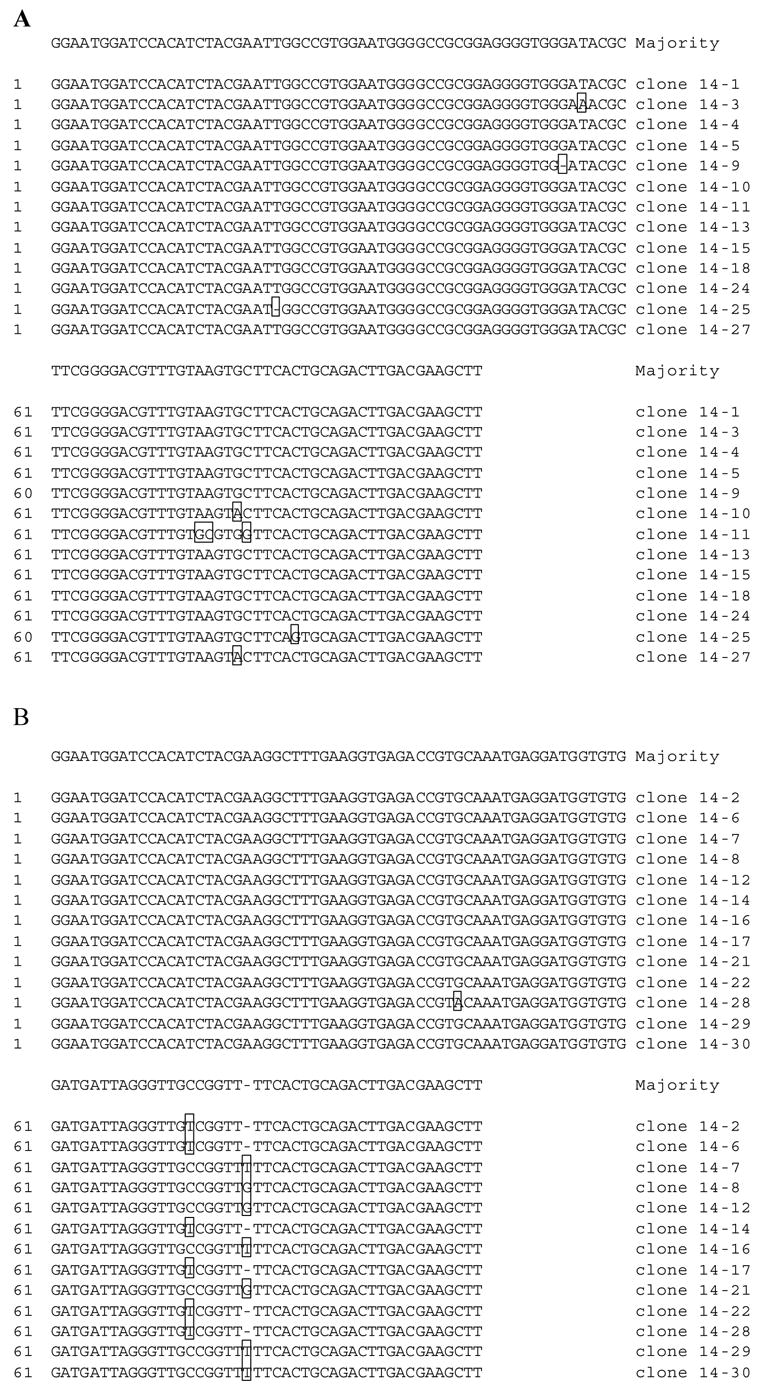
Sequence families selected with tobramycin. RNAs eluted in round 14 of selection were converted to cDNAs, amplified, cloned, and sequenced. (A) The 13 members of family 1. (B) The 13 members of family 2. Positions that differ from the majority sequence are boxed.
An interesting covariation occurred in family 2 at positions 75 and 81 (Fig 3B). In 6 of the 13 clones, position 75 is a T (U in the RNA). In all 6 of these clones there is a deletion at position 81. In the other 7 clones of this family, position 75 is a C and position 81 is either a T (4 clones) or a G (3 clones). Nucleotides at both positions are predicted to be unpaired in the secondary structure (Supplement 1), suggesting that they may be involved in a tertiary interaction or that they could interact with the ligand.
Family 1 molecules contain a second copy of the 5′-terminal sequence (GGAAUG) required for binding to the magnetic beads. The second copy lies in a predicted single-stranded region (boxed in Supplement 1) suggesting that this RNA could bind simultaneously to two sites on the beads. This may explain why the amount of RNA that bound to the magnetic beads dropped in the later rounds of selection (see Table 1). If each clone 14–1 RNA molecule occupied two binding sites on the beads, the total number of available binding sites would decrease as clone 14–1 RNA was enriched.
Clone 14–1 RNA and clone 14–2 RNA (Fig. 3) were converted into beacon aptamers. The beacon aptamers derived from clone 14–1 RNA and clone 14–2 RNA are subsequently referred to as BA14–1 and BA14–2. The program Mfold was used to predict the secondary structures of BA14–1 and BA14–2. Supplement 1 shows the most stable predicted folds. The 5′ and 3′ ends were paired in all predicted structures whose stabilities were within 5% of the most stable structure.
BA14–1 and BA14–2 were tested for their ability to detect tobramycin. In addition, a beacon aptamer derived from clone 6–8 RNA was used as a negative control. Clone 6–8 RNA is an RNA that eluted in round 6 of selection but was not subsequently enriched in later rounds. Thus, the corresponding beacon aptamer (BA6–8) was expected to be unresponsive to tobramycin. Tobramycin produced a modest but reproducible increase in fluorescence intensity of both BA14–1 and BA14–2 (Fig. 4). Importantly, BA6–8 did not respond to tobramycin. (Fig. 4A). In addition, neither BA14–1 nor BA14–2 responded to paromomycin (data not shown). The specificity for tobramycin was somewhat surprising since negative selection was not included in the protocol. It may be that specificity is an automatic consequence of selecting for a complex function. Although related antibiotics may bind to the selected aptamers, they may be unable to induce the required conformational change. Competition experiments will help to clarify this issue.
Fig. 4.
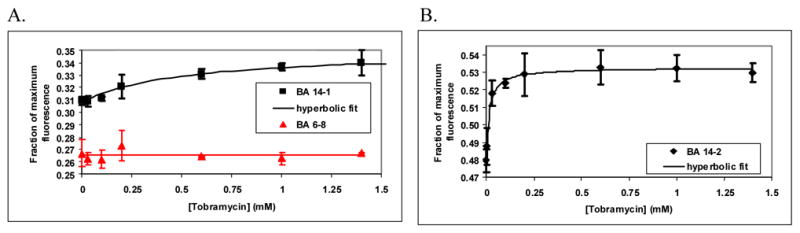
Assay of tobramycin beacon aptamer activity. Data are plotted as “Fraction of maximum fluorescence” vs. concentration of ligand (tobramycin or paromomycin). Maximum fluorescence was measured in the presence of a 100-fold molar excess of a complementary DNA oligonucleotide. Error bars are standard deviations (number of replicate measurements ranged from 3 to 12). (A) Effect of tobramycin on the fluorescence of BA14–1 and BA6–8 (B) Effect of tobramycin on the fluorescence of BA14–2. The data for BA14–1 and BA14–2 were fit to hyperbolic binding curves. The data for BA6–8 was fit to a line.
BA14–2 could detect a lower concentration of tobramycin than could BA14–1. The data fit well to simple hyperbolic binding curves with a single saturable binding site (Fig. 4). Based on these curves, the apparent Kd for BA14–2 was about 16 μM (R2 = 0.92) while that for BA14–1 was about 500 μM (R2 = 0.87). BA14–2 could reproducibly detect 30 μM tobramycin (P < 0.01). In contrast, BA14–1 could detect no less than 200 μM tobramycin (P<0.01; see Materials and methods for statistical analysis).
Toward the production of highly effective beacon aptamers
There is great interest in the efficient production of effective beacon aptamers. Each of the RNAs selected by the strategy presented here was successfully converted into a beacon aptamer that could specifically detect tobramycin. This contrasts with the results of an experiment that selected only for ligand binding [15]. Jhaveri, Rajendran, and Ellington screened fluorescently labeled ATP aptamers for their ability to function as signaling aptamers. Of the 5 sequence families selected to bind to ATP, members of only one family could detect ATP through changes in fluorescence intensity.
Although BA 14–1 and BA 14–2 could detect tobramycin, they were clearly suboptimal. At saturating concentrations of tobramycin, the fluorescence intensities of both BA14–1 and BA14–2 increased only about 10% compared to the background fluorescence in the absence of ligand. This low signal-to-noise ratio is largely due to poor quenching efficiencies that resulted in high background fluorescence. The data shown in Figure 4 are plotted as “Fraction of maximum fluorescence” in order to highlight this fact. (Maximum fluorescence was measured by denaturing the beacon aptamers with a 100-fold molar excess of a complementary oligonucleotide.) Increasing the stability of the stem or moving the fluorophore and quencher to internal positions of the stem may improve quenching.
The 30 μM minimum detection limit of BA14–2 is higher than would be required for many applications. Beacon aptamers with better sensitivity may have been selected if the concentration of tobramycin had been reduced in the early rounds of selection. The lowest concentration of tobramycin used in this experiment was 20 μM which is approximately equal to the apparent Kd of BA14–2.
Recently, Nutiu and Li reported a similar strategy for selecting signaling aptamers [13]. Nutiu and Li’s method differed in 4 important ways. First, the selection strategy was based on “duplex-to-complex structure-switching” rather than on a beacon aptamer design (see Fig. 1). Second, signaling required the disruption of 15 base pairs rather than 7 or 8 base pairs (see Supplement 1). Third, the randomized region contained 30 nucleotides rather than 60 nucleotides. Finally, DNA aptamers rather than RNA aptamers were selected. Nutiu and Li attempted to select DNA aptamers that could detect ATP, GTP, CTP, or UTP. A comparison of their results to those presented here highlights the importance of several aspects of selection protocol design.
Nutiu and Li successfully isolated ATP and GTP signaling aptamers but no CTP or UTP aptamers emerged from the selection. The authors proposed that their initial DNA pool may not have included the required sequences due to the relatively short length of the randomized region (30 nucleotides). Alternatively, it could be that the smaller ligands (CTP and UTP) could not bind tightly enough to disrupt the stable 15 nucleotide duplex.
In the presence of the cognate ligand at a concentration of 1 mM, the fluorescence of the ATP and GTP aptamers increased between 1.7 and 4.5 fold. This superior signal-to-noise ratio can be attributed to two features of the experimental design. First, efficient quenching was achieved through stable positioning of the fluorophore and quencher. The separate fluorophore- and quencher-labeled oligos were both held in place through 15 base pair interactions. Second, the signal was generated through disruption of an intermolecular duplex resulting in the quencher diffusing away from the fluorophore into the bulk solution. Although the 15 base pair duplex minimized background fluorescence, it probably also limited detection sensitivity. (The minimum detection limits were not reported by the authors.)
Ultimately, the design of an optimal procedure for selecting signaling aptamers will be a compromise among several competing factors. A long randomized region increases the chances of selecting aptamers with the desired properties but it increases the complexity and expense of aptamer synthesis. A long duplex improves the quenching efficiency but decreases the detection sensitivity and may limit the choice of ligand to those that are sufficiently large. Disruption of an intermolecular duplex can produce a stronger signal than disruption of an intramolecular duplex but at the expense of a more complicated system that requires several oligonucleotides rather than a single molecule. As with aptamer length, the choice of RNA vs. DNA may require a compromise between range of function and ease of synthesis.
Supplementary Material
Supplement 1. Predicted secondary structures of beacon aptamers derived from clone 14–1 RNA (BA14–1) and clone 14–2 RNA (BA14–2). The most stable structures (those with the most negative δG) are shown. The two copies of GGAAUG in BA14–1 are boxed. Arrows indicate junctions between the two RNA halves that were ligated to produce the full length RNA. Predictions were made using the program M-fold (www.bioinfo.rpi.edu/applications/mfold/rna/form1–2.3.cgi).
Acknowledgments
Thanks to Mike Krause and members of the Krause lab for temporary research space, reagents, and supplies, DNA sequencing, and helpful discussions. Thanks also to Mark Behlke at Integrated DNA Technologies for help with oligo design, and Brenda Bass, Mike Krause, Shirley Lin, Virginia Smith, and Tammy Domanksi for critical reading of the manuscript. This work was supported by NIH grant NS052753 and by the Chemistry Department of the U.S. Naval Academy. Naval Academy NARC grants provided summer support.
Footnotes
Publisher's Disclaimer: This is a PDF file of an unedited manuscript that has been accepted for publication. As a service to our customers we are providing this early version of the manuscript. The manuscript will undergo copyediting, typesetting, and review of the resulting proof before it is published in its final citable form. Please note that during the production process errors may be discovered which could affect the content, and all legal disclaimers that apply to the journal pertain.
References
- 1.Tombelli S, Minunni M, Mascini M. Analytical applications of aptamers. Biosensors & bioelectronics. 2005;20:2424–2434. doi: 10.1016/j.bios.2004.11.006. [DOI] [PubMed] [Google Scholar]
- 2.Bunka DH, Stockley PG. Aptamers come of age - at last. Nature reviews. 2006;4:588–596. doi: 10.1038/nrmicro1458. [DOI] [PubMed] [Google Scholar]
- 3.Nimjee SM, Rusconi CP, Sullenger BA. Aptamers: an emerging class of therapeutics. Annual review of medicine. 2005;56:555–583. doi: 10.1146/annurev.med.56.062904.144915. [DOI] [PubMed] [Google Scholar]
- 4.Ulrich H. RNA aptamers: from basic science towards therapy. Handbook of experimental pharmacology. 2006:305–326. doi: 10.1007/3-540-27262-3_15. [DOI] [PubMed] [Google Scholar]
- 5.Collett JR, Cho EJ, Ellington AD. Methods. Vol. 37. San Diego: Calif; 2005. Production and processing of aptamer microarrays; pp. 4–15. [DOI] [PubMed] [Google Scholar]
- 6.Deisingh AK. Aptamer-based biosensors: biomedical applications. Handbook of experimental pharmacology. 2006:341–357. doi: 10.1007/3-540-27262-3_17. [DOI] [PubMed] [Google Scholar]
- 7.Nutiu R, Li Y. Methods. Vol. 37. San Diego: Calif; 2005. Aptamers with fluorescence-signaling properties; pp. 16–25. [DOI] [PubMed] [Google Scholar]
- 8.Tyagi S, Kramer FR. Molecular beacons: probes that fluoresce upon hybridization. Nature biotechnology. 1996;14:303–308. doi: 10.1038/nbt0396-303. [DOI] [PubMed] [Google Scholar]
- 9.Frauendorf C, Jaschke A. Detection of small organic analytes by fluorescing molecular switches. Bioorganic & medicinal chemistry. 2001;9:2521–2524. doi: 10.1016/s0968-0896(01)00027-x. [DOI] [PubMed] [Google Scholar]
- 10.Li JJ, Fang X, Tan W. Molecular aptamer beacons for real-time protein recognition. Biochem Biophys Res Commun. 2002;292:31–40. doi: 10.1006/bbrc.2002.6581. [DOI] [PubMed] [Google Scholar]
- 11.Yamamoto R, Baba T, Kumar PK. Molecular beacon aptamer fluoresces in the presence of Tat protein of HIV-1. Genes Cells. 2000;5:389–396. doi: 10.1046/j.1365-2443.2000.00331.x. [DOI] [PubMed] [Google Scholar]
- 12.Rajendran M, Ellington AD. In vitro selection of molecular beacons. Nucleic acids research. 2003;31:5700–5713. doi: 10.1093/nar/gkg764. [DOI] [PMC free article] [PubMed] [Google Scholar]
- 13.Nutiu R, Li Y. In vitro selection of structure-switching signaling aptamers. Angew Chem Int Ed Engl. 2005;44:1061–1065. doi: 10.1002/anie.200461848. [DOI] [PubMed] [Google Scholar]
- 14.Wang Y, Rando RR. Specific binding of aminoglycoside antibiotics to RNA. Chemistry & biology. 1995;2:281–290. doi: 10.1016/1074-5521(95)90047-0. [DOI] [PubMed] [Google Scholar]
- 15.Jhaveri S, Rajendran M, Ellington AD. In vitro selection of signaling aptamers. Nature biotechnology. 2000;18:1293–1297. doi: 10.1038/82414. [DOI] [PubMed] [Google Scholar]
Associated Data
This section collects any data citations, data availability statements, or supplementary materials included in this article.
Supplementary Materials
Supplement 1. Predicted secondary structures of beacon aptamers derived from clone 14–1 RNA (BA14–1) and clone 14–2 RNA (BA14–2). The most stable structures (those with the most negative δG) are shown. The two copies of GGAAUG in BA14–1 are boxed. Arrows indicate junctions between the two RNA halves that were ligated to produce the full length RNA. Predictions were made using the program M-fold (www.bioinfo.rpi.edu/applications/mfold/rna/form1–2.3.cgi).