

Abstract
Whether there is a nitrosyl hemoglobin (HbNO) gradient between the venous and the arterial parts of the circulatory system is a very controversial issue in nitric oxide research. We have carefully evaluated the measurement of HbNO concentration in blood using EPR generated in vivo by the NO donor DEANO under various oxygen tensions. We found that the absolute concentrations of HbNO in venous and arterial blood were the same within experimental error, independent of hemoglobin saturation; only the ratios of 5-coordinate and 6-coordinate HbNO differed. The HbNO concentration increased when the oxygen concentration breathed by the rats decreased in a manner that was linear in hemoglobin saturation. These results do not support the existence of an arterial-venous gradient of HbNO under our experimental conditions.
Keywords: Nitric oxide, Hemoglobin, EPR, Oxygen saturation, Free radicals
One of the most important functions of nitric oxide is the signaling of vasodilatation [1-3]. A fundamental factor in understanding the mechanism and pathway of this function is the possible existence of an arterial-venous (A-V) gradient in the circulatory system of nitrosyl hemoglobin (HbNO), one form in which NO is transported in the blood [4-7].
The HbNO arterial-venous gradient is the HbNO concentration difference between venous and arterial blood, usually referring to a higher concentration in venous blood than in arterial blood. It has been reported [8,9] that the HbNO concentration in venous blood is significantly higher than that in arterial blood, whereas the S-nitrosylated hemoglobin (SNO-Hb, NO bound to β-93 cysteine) concentration is significantly lower in venous blood than in arterial blood. The total nitrosylated hemoglobin concentration including HbNO and SNO-Hb thus remains the same in the venous blood and arterial blood. These results were reported under 21% oxygen and 100% oxygen. Based on these findings, it was hypothesized that during blood circulation, NO first binds to the iron in hemoglobin under low oxygen tension in the venous blood, and part of the NO transfers to cysteine β-93 of hemoglobin to form SNO-Hb. The authors pointed out that it is the SNO-Hb that actually carries out the vasodilatation function and regulates the blood circulation, whereas Hb(Fe2+) is only a NO scavenger. Therefore, the delivery of both O2 and NO to tissue is regulated allosterically [10-13].
Several aspects of this hypothesis have been challenged [14-16], in particular the existence of such an A-V gradient. Although there is one EPR investigation that indicates that an HbNO A-V gradient indeed exists under conditions of endotoxin shock or hemorrhage [17], the existence of any statistically significant A-V gradient of HbNO under various conditions has been disputed in an increasing number of reports [14,18,19].
These discrepancies could be caused by the method employed to process samples and quantify HbNO in blood. The reports cited above have differences in the sample treatments and measurements in which errors and artifacts may have affected the outcomes [20]. Although several methods of measuring NO have been established, there are a limited number of reliable methods to measure HbNO. Chemiluminescence and the Griess assay are frequently used to measure NO and nitrite, respectively, obtained from HbNO, but these indirect methods are known to be vulnerable to contamination [20,21]. The only direct method for measurement of HbNO is the use of EPR with a dewar at liquid nitrogen temperature or below [22-26]. This method is based on the paramagnetism of HbNO and is therefore unambiguous.
Erythrocyte hemoglobin, rather than being simply a scavenger of endothelial-derived nitric oxide, has become increasingly recognized as a component of the vasodilatory functions of the circulation. This is an attractive notion as hemoglobin is an excellent oxygen sensor and may consequently be able to adjust its vasodilatory activity in regions or times of oxygen need. Two major hypotheses for how hemoglobin can elicit a vasodilatory response have been proposed. The first involves the reduction of inorganic nitrite by deoxygenated hemoglobin to generate a vasodilating species, presumably NO [27]. The second involves the formation of an S-nitrosothiol from NO on the β-93 cysteine residue of hemoglobin. The NO is then released to vascular smooth muscle upon the R to T transition of hemoglobin (i.e., during hemoglobin deoxygenation) [6].
For this latter hypothesis, the source of vasodilation is ultimately endothelial NO that is trapped and stabilized on hemoglobin for later release in response to oxygen need. The mechanism by which NO is trapped on hemoglobin was reported to involve the initial binding of NO to deoxygenated hemoglobin to form HbNO, followed by the intramolecular transfer of NO from the heme group to the β-93 cysteinyl residue to form S-nitrosohemoglobin. The major evidence for such an intramolecular transfer comes from in vivo data that detail arterial-venous gradients in both HbNO and SNO-Hb. For example, McMahon et al. [6] showed that HbNO rose from a value of ∼0.001 NO/heme (∼2.5 μM HbNO in whole blood) to ∼0.002 NO/heme (∼5 μM HbNO in whole blood) during transit from artery to vein in humans. The gradient of SNO-Hb was found to be in the opposite direction and of a similar magnitude, suggesting a reversible transfer of NO between the heme and the thiol group.
The presence of such gradients has been challenged on both a quantitative and a qualitative basis. For example, the presence of HbNO in whole human blood has never been reliably reported using direct EPR detection under baseline conditions. A recent study [28] that estimated that EPR could detect HbNO in packed red cells down to a concentration of 200 nM did not observe any EPR-detectable HbNO from either arterial or venous blood in humans. However, upon NO inhalation, a significant formation of HbNO was observed, which largely decreased during arterial-venous transit (in fair agreement with previous studies performed using analytical detection methodologies) [29].
In previous studies we demonstrated that rats administered (by iv infusion) the NO donor molecule diethylamine NONOate (DEANO) to give an approximate HbNO concentration of ∼30 μM showed no change in the level of HbNO during A to V transit, but observed the expected R to T transition as an increase in the level of 5-coordinate α HbNO subtype [18].It is important to distinguish these studies from those involving nitrite infusion or endotoxemia (in which plasma nitrite levels rise to very high levels in rodents), as the presence of nitrite in blood may give rise to an A-V HbNO gradient from the nitrite reductase activity of deoxyhemoglobin.
In this study we have carefully examined both the background signal in blood and other potential factors that would affect HbNO quantification, designed experiments to accurately measure HbNO in both venous and arterial blood, and used these techniques to examine the effect of hypoxia on the HbNO content of rat blood exposed to DEANO. We show here that although HbNO content increases as an inverse function of oxygen pressure, HbNO gradients across the circulation are not observed.
Material and methods
In vivo generation of HbNO
Jugular vein-cannulated CD rats (Charles River, Wilmington, MA, USA; male, weight ∼350 g) were anesthetized with pentobarbital sodium (Abbott Laboratories, Chicago, IL, USA) at a dose of 50 mg/kg. Supplemental small doses were sometimes administered depending upon the animal’s anesthesia status.
Each rat was put in a breathing chamber (Vetequip, Pleasanton, CA, USA) filled with a gas mixture at various oxygen concentrations (from 10 to 95%) for 30 min. The rat was then attached to a pulse oximeter (Nonin Medical, Inc., Plymouth, MN, USA) via the paw to record the percentage saturated oxyhemoglobin (SpO2) in arterial blood and switched from the breathing chamber to a mouth breather under a gas mixture of the same oxygen concentration for another 20 min. The error range of the pulse oximeter is approximately 5% around 98% SpO2 and 15% around 75% SpO2 according to the manufacturer’s specifications. During the measuring period, the SpO2 reading varied due to either involuntary movement or the condition of the rat. The SpO2 reading was recorded immediately before the collection of the control sample and before the administration of DEANO (Cayman Chemical Co., Ann Arbor, MI, USA). The cannula was flushed and purged, and a 1-ml control blood sample was drawn from the cannula with a 1-cc plastic syringe and immediately frozen in liquid nitrogen.
Next, 25 μl of DEANO (∼24 mM) in 10 mM NaOH was administered to the rat through the cannula, resulting in 25 μM DEANO in the rat’s blood based on the value 6.7 cc blood/100 g body wt [30]. To verify that neither DEANO nor NaOH would affect the rat’s pH, a control experiment was carried out. Twenty-five microliters of saline, NaOH, or DEANO in NaOH was administered, respectively. No pH difference was observed in the rats’ blood. Five minutes after the administration of DEANO, 1 ml of arterial blood from the aorta and 1 ml of venous blood from the vena cava were drawn into two 1-cc syringes simultaneously. Each whole syringe was immediately frozen in liquid nitrogen for subsequent EPR measurements to preserve HbNO under in vivo oxygen tension. The procedure of the control experiments was exactly the same as described above except that a 10 mM NaOH solution without DEANO was used. Each group, including the control group, consisted of four rats for statistical analysis.
We found that the anesthesia caused a decrease in SpO2. Preliminary experimental results indicated that anesthesia did increase HbNO level. The amount of HbNO increase depended on the anesthetics used, the stage of anesthesia, and individual differences. Whether the increase in the HbNO level was due to the oxygen tension decrease caused by anesthesia resulting in more NO trapping by deoxyHb or was due to the metabolism of the anesthetics is not clear. Nevertheless, the generation of HbNO due to phenobarbital was not significant. Furthermore, in our experiments, both the control blood and the blood sample after DEANO administration were drawn under anesthesia 5 min apart. Therefore, the HbNO production due to anesthesia alone was subtracted out during the background subtraction and would not affect our results and conclusion.
In vitro HbNO generation
In vitro, Hb(NO)4 was prepared and quantified optically following a procedure described previously [18]. In detail, the oxyhemoglobin (Sigma) was dissolved in phosphate buffer (50 mM phosphate, 20% glycerol, pH 7.4) by continuous stirring at 4 °C for 2 h. After 20 min, the sample was centrifuged at 4 °C and 15,000 rpm, and the initial concentration of oxyHb was determined by measuring the absorbance at 415 nm. Pure argon gas was flushed over the surface of the continuously stirred sample for about 5 min, and then a solution of sodium dithionite (1 M in deoxygenated phosphate buffer) was added (to about a 20-fold higher concentration than the oxyHb) for complete deoxygenation of the sample. Absorbance was monitored using a Beckman Coulter DU 640 spectrophotometer. Then the solution was transferred anaerobically to a Sephadex G-25 column and eluted with deoxygenated phosphate buffer. NO gas (99% minimum, CP grade, purchased from National Specialty Gases, Durham, NC, USA, and purified by passing through a series of gas-bubble washing bottles containing a deoxygenated 1 M solution of NaOH and deoxygenated distilled water) was flushed for about 5 min over the surface of the remaining solution of deoxyHb. Then all excess NO was removed from the flask by flushing again with pure argon gas. The concentration of nitrosylated heme groups was determined by measuring the absorbance at 417 nm (ε417=126 mM-1 cm-1). Finally, the sample was transferred to a 1-cc syringe and frozen in liquid nitrogen for subsequent EPR measurements. The EPR spectrum of the Hb(NO)4 sample is consistent with the 5-coordinate HbNO spectrum reported previously and therefore considered a standard 5-coordinate HbNO spectrum. An EPR measurement was also taken of the sample which had been carried through the same procedure except the deoxygenation step. The standard 5-coordinate EPR spectrum was subtracted from the nondeoxygenated HbNO spectrum, resulting in the 6-coordinate standard spectrum for later reference.
EPR measurements
All EPR measurements were carried out with a Bruker (Billerica, MA, USA) Elexsys 500 X-band EPR spectrometer, ER4122SHQ cavity, and 500-ml finger dewar (Wilmad, NJ, USA). The tip of the plastic syringe containing the sample was cut off and the contents were pushed out while still frozen. The icicle was then transferred to the finger dewar filled with liquid nitrogen. To reduce the EPR noise caused by nitrogen bubbling, an EPR-silent material such as filter paper was inserted into the gap between the icicle and the inner wall of the finger dewar.
The EPR parameters were carefully optimized, especially the microwave power. A sample containing either 5-coordinate or 6-coordinate HbNO was produced in vitro [18], and microwave power saturation curves for both 5-coordinate and 6-coordinate HbNO were obtained by 2-D spectra with a microwave power step size of 1 dB. The power saturation curves indicated that 5-coordinate and 6-coordinate HbNO have small, but significantly different, power saturation behavior, but that for microwave power under 2 mW, the signal intensities of both species are in the linear range. Therefore, 2 mW microwave power was used exclusively for all experiments. To align the spectra precisely for later spectral subtraction, a frequency counter 53150A (Agilent Technologies, Inc., Palo Alto, CA, USA) was connected to the EPR spectrometer and microwave frequency was recorded for each spectrum. When each sample was installed, the Q value was carefully checked. During data acquisition, the microwave frequency and diode current were closely monitored. The AFC was carefully locked, and the diode current was kept in the middle position to correct for experimental long-term drift. All samples were measured under the following instrumental parameters: modulation frequency, 100 kHz; modulation amplitude, 5 G; time constant, 1.3 s; number of scans, 4.
Data processing
After acquisition, the magnetic field axes of the EPR spectra were aligned based on the microwave frequency recorded and the g=2.0000 position. The control spectrum was subtracted from the arterial blood spectrum and the venous blood spectrum. All spectra for subtraction operations were from the same rat. The g=2 free radical signal was then subtracted using a scale factor depending on the concentration of the variable narrow line radical signal. Double integration was applied to the resulting spectra. During double integration, the offsets and slopes were carefully adjusted so that both the beginning part and the ending part of the double integration curves were flat. The double integration results were compared between the standard spectra and the experimental spectra under various oxygen tensions from arterial blood and venous blood to quantify the HbNO concentrations. Averages and standard deviations were calculated for each group of four animals. Significance was calculated using paired t test.
Results
Measuring HbNO from blood samples
For the accurate measurement of HbNO in blood, the background signal is problematic. Although ceruloplasmin is considered to constitute the major part of the EPR blood background signal, this copper signal is not its only source. We found that subtraction of the EPR plasma signal from the whole blood signal did not entirely remove the background signal; a residual signal still remained. In addition, postprocessing of the blood sample may alter the concentration and/or type of HbNO in the blood. Therefore, we developed a spectral subtraction technique to remove the background signal.
Our results from blood samples from the control animals indicated that the blood background signal dominates. The background signal can be as much as 10 times larger than the HbNO signal as measured by double integration; therefore, mishandling the background signal will lead to significant error.
Second, the blood background signal differs for each individual rat. Each rat has not only a different background signal intensity (mainly due to ceruloplasmic level difference), but also a different EPR line shape (an indication that the background does not arise from a single source; spectra not shown). Based on these findings, we decided to use blood from the rat before treatment as the only adequate control for the subtraction of the broad EPR spectrum due to copper and other transition metal species.
A free radical signal around g=2 appears in the EPR spectra of frozen blood [17]. In agreement with these earlier reports, this g=2 signal randomly fluctuates even in samples from the same animal. To eliminate this interference, we subtracted the EPR spectra of the control blood samples from the same rat, but collected at different times (Fig. 1, spectra A and B). The resulting narrow-line spectrum (Fig. 1, spectrum C) was further treated by baseline correction and depression of the noise level of the wings with a window function on the high- and low-field ends of the spectrum (Fig. 1, spectrum D).
Fig. 1.
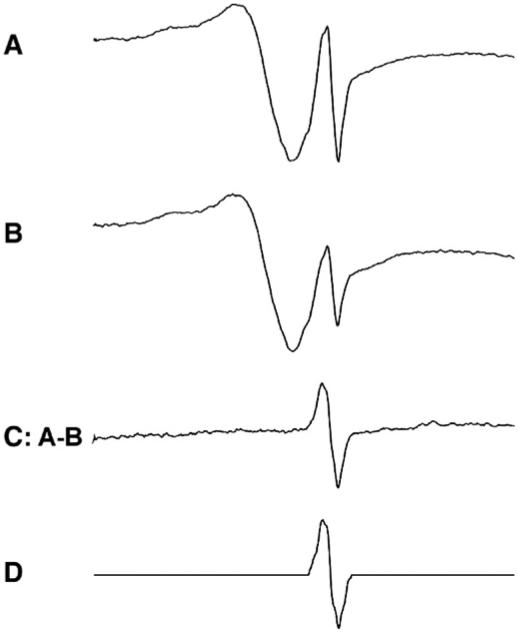
Extraction of g=2 free radical signal. Spectra A and B are from the same rat with the same intensity of the ceruloplasmic signal, but different intensities of the g=2 radical signal. The samples are identical except that they were separately frozen. Spectrum C is the result of subtraction of B from A. Spectrum D is the result of baseline linear correction and reduction of noise on the wings. D was used as a standard g=2 radical signal to subtract from the experimental spectra at various scales.
From the spectrum of the rat administered 25 μl of the stock DEANO solution (Fig. 2, spectrum A), the control spectrum from the same rat consisting of a broad and narrow line (Fig. 2, spectrum B) was subtracted, yielding spectrum C in Fig. 2. From this spectrum, the narrow line g=2 free radical spectrum (Fig. 2, spectrum D) was subtracted to give an HbNO spectrum (Fig. 2, spectrum E) very similar to that of HbNO spectra from in vitro preparation [31].
Fig. 2.
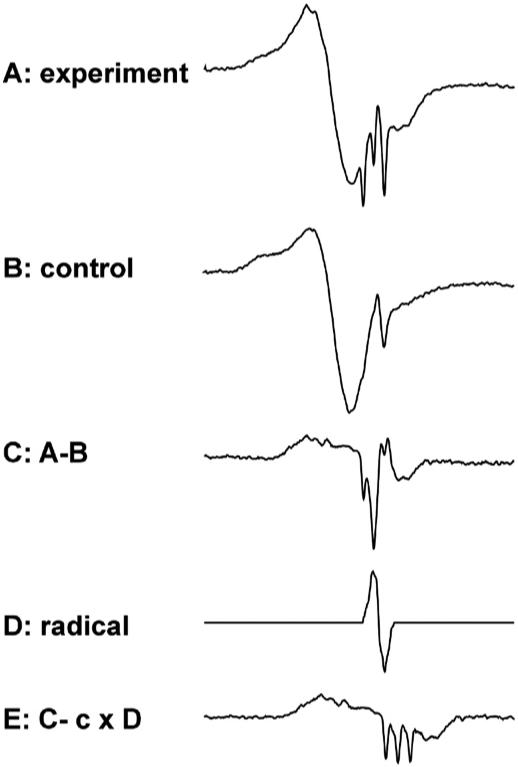
Process of extraction of HbNO signal from raw experimental spectrum. (Spectrum A) A typical experimental spectrum. (Spectrum B) Control spectrum from the same rat. (Spectrum C) Spectrum resulting from subtracting B from A. (Spectrum D) Standard g=2 radical spectrum (Fig. 1). (Spectrum E) Spectrum resulting from subtraction of D from C, where c is a scale factor.
Comparison of HbNO concentration in venous blood and arterial blood under various oxygen concentrations
Fig. 3 shows that at each oxygen concentration (from 10% oxygen to 95% oxygen) of the inhaled gas, the HbNO concentrations in venous blood and arterial blood after the administration of DEANO were not statistically different. When the rats breathed oxygen of higher concentrations, the HbNO level in both venous blood and arterial blood was lower. This result shows that regardless of the absolute HbNO concentration, there was no detectable concentration difference between the venous and the arterial blood. In other words, there is no detectable A-V HbNO gradient under these conditions.
Fig. 3.
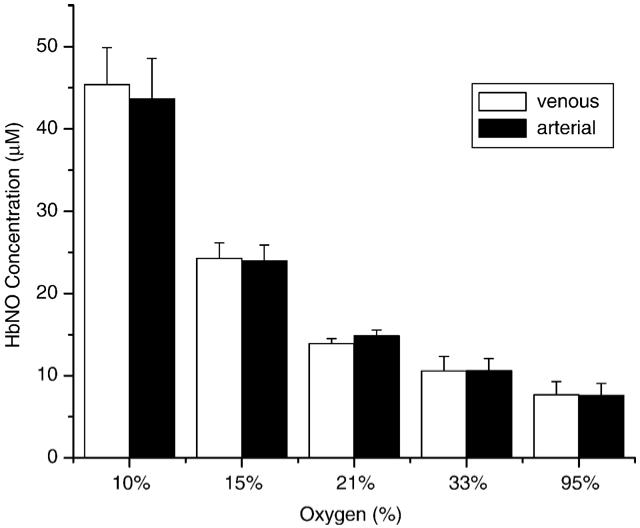
Comparison of HbNO concentration in venous blood and in arterial blood from rats breathing various oxygen concentrations. Five groups of four rats breathed a gas mixture of 10, 15, 21, 33, or 95% oxygen concentration. The HbNO concentrations in venous and arterial blood were measured and quantified. The error deviation was computed for each group. All gas mixtures were oxygen and nitrogen except the 95% mixture, in which 95% oxygen and 5% CO2 were used to preserve the pH value of the blood.
Although the overall HbNO concentrations in venous and arterial blood are the same, the ratios of 5-coordinate to 6-coordinate HbNO in venous and arterial blood are different (Figs. 5 and 7). As expected, there is more 5-coordinate HbNO (seen as a set of three sharp lines, Fig. 4) and less 6-coordinate HbNO (seen as a broad, poorly resolved spectrum, Fig. 4) in venous blood than in arterial blood. This is consistent with the fact that under higher oxygen concentrations, 5-coordinate HbNO converts to 6-coordinate HbNO (Fig. 4).
Fig. 5.
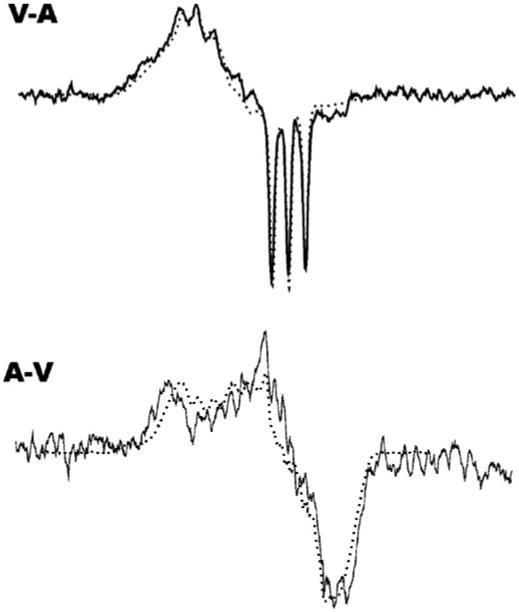
Top: A representative spectrum of subtraction of the arterial spectrum from the venous spectrum (solid line) and the 5-coordinate spectrum from the in vitro experiment (dotted line). Bottom: A representative spectrum of subtraction of the venous spectrum from the arterial spectrum (solid line) and the 6-coordinate spectrum from the in vitro experiment (dotted line).
Fig. 7.

HbNO concentrations in venous blood and arterial blood vs SpO2 percentage.
Fig. 4.
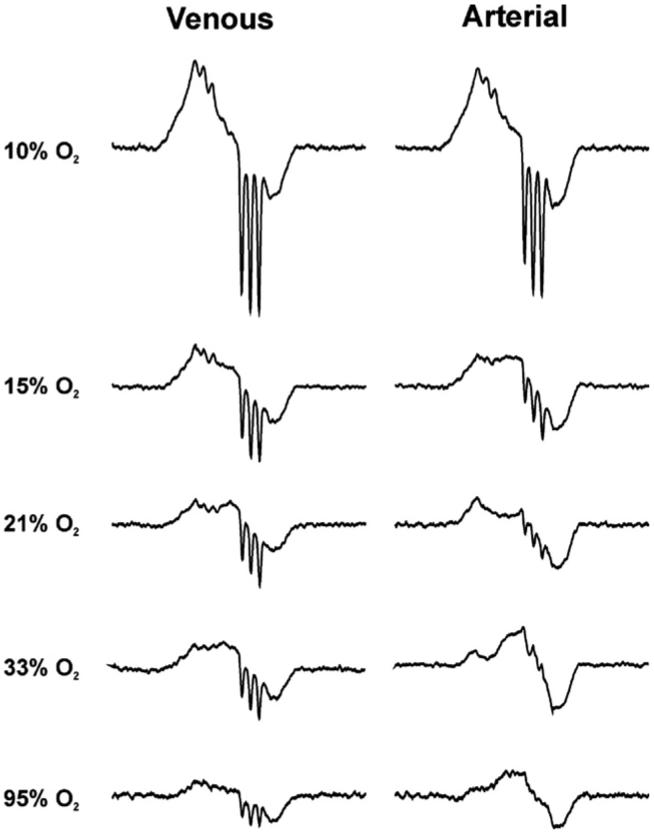
Representative spectra of HbNO in venous blood and arterial blood under various oxygen tensions. From top to bottom the spectra were acquired from the rats breathing 10, 15, 21, 33, and 95% oxygen concentrations. The HbNO concentration decreases as the oxygen saturation increases. The left column is from the venous blood and the right column from arterial blood.
We used the venous-arterial subtraction technique as previously described [18] to estimate the percentages of 5-coordinate HbNO of each spectrum by double integration. Fig. 5 shows the subtraction result of the arterial spectrum from the venous spectrum (solid line, upper spectrum) in comparison with the 5-coordinate EPR spectrum from Hb (NO)4 (dotted line, upper spectrum). The lower spectrum in Fig. 5 is the result of subtraction of the venous spectrum from the arterial spectrum (solid line) in comparison to the 6-coordinate spectrum from an in vitro experiment (dotted line). Fig. 6 shows the percentage of the 5-coordinate HbNO determined by subtraction of the 5-coordinate spectrum (Fig. 5, upper spectrum) from the spectra in Fig. 4, followed by double integration both before and after subtraction. The remaining portion of each spectrum is mainly α 6-coordinate HbNO with possibly some contribution from β 6-coordinate HbNO (data not shown). However, the subtraction error and noise level accumulated after several subtractions make precise assignment problematic. Fig. 6 shows that the percentage of 5-coordinate HbNO in both venous blood and arterial blood decreases as SpO2 decreases.
Fig. 6.
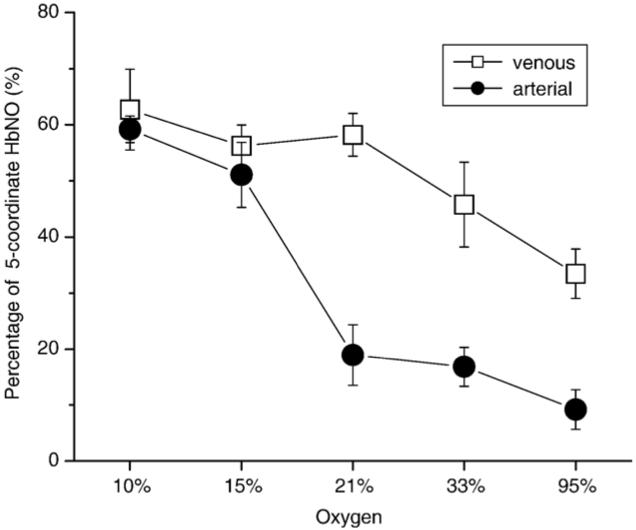
Percentage of 5-coordinate HbNO in venous and arterial blood under various oxygen tensions. This is the result of subtracting a properly scaled standard 5-coordinate HbNO spectrum from the experimental spectrum.
Fig. 7 shows that the HbNO concentrations from both the venous blood and the arterial blood decrease in a linear fashion as SpO2 increases, as would be expected if deoxyhemoglobin traps NO. We would like to point out that the SpO2 level from the group breathing 21% oxygen (ambient air) is not ∼98% as expected, but ∼85%. This lower than “normal” SpO2 level is the result of depressed oxygenation due to the anesthesia. This is especially important when NO levels are evaluated by measuring HbNO because, under hypoxic conditions, more HbNO will form at a given NO generation rate.
Discussion
In vivo EPR investigations have reported two forms of HbNO, 5-coordinate and 6-coordinate (including two subtypes, α and β) [31]. The EPR of the 5-coordinate form has a characteristic three-line nitrogen splitting with a coupling constant of ∼17 G. The 6-coordinate form has unresolved triplet-triplet hyperfine structure and, therefore, is difficult to identify and easily overlooked. In venous blood, in which the oxygen concentration is low, the 5-coordinate form has a higher percentage, whereas in arterial blood, in which the oxygen concentration is high, the 6-coordinate form has a higher percentage [31]. Instead of double integration of the first derivative EPR spectra for concentration determinations, some investigators measured the height of one of the 5-coordinate inverted peaks to quantify the HbNO concentration [32], which, by ignoring the 6-coordinate HbNO, under-estimated the absolute concentration of HbNO, leading to the erroneous conclusion that venous HbNO concentration would be higher than arterial. This conclusion is true for 5-coordinate HbNO, but not for the absolute concentration of HbNO.
Another potential source of error is the broad background EPR signal in blood. It is well known that blood also contains EPR-active ceruloplasmin that produces a broad Cu2+ signal [33]. In addition, there is a freezing-induced radical species with a narrow EPR signal that fluctuates in magnitude from sample to sample which has been assigned to a hemoglobin-derived tyrosyl radical [23]. Failure to correct for this signal in a proper and consistent manner will also lead to errors.
Sample processing can also lead to inaccuracy. HbNO is unstable at room temperature, with a lifetime of about 20 min [34], so samples should be immediately frozen in liquid nitrogen. In addition, the ratio of 5-coordinate to 6-coordinate HbNO depends on the oxygen concentration [18]; thus, mixing HbNO with air will lead to different results. In some reports, blood was centrifuged to separate the plasma in order to eliminate the ceruloplasmic signal [23,26]. This procedure may expose HbNO to nonphysiological oxygen concentrations unless care is taken not to mix the blood with air. Furthermore, removing the plasma fraction does not totally remove the background signal [18,23,26].
A priori EPR measurement is the least ambiguous method for measuring HbNO, although it is difficult to accurately measure HbNO from a blood sample because the background signal includes both ceruloplasmic and g=2 free radical signals. Treating the blood sample by spinning down or washing not only does not entirely eliminate the background signal, but also may destroy HbNO and change the HbNO spectral shape if the sample is contaminated with oxygen. Our procedure provides a method of measuring HbNO in blood without affecting the HbNO concentration or the 5- to 6-coordinate ratio.
Using this method, we carefully measured HbNO in venous and arterial blood under various oxygen concentrations after administration of DEANO, a NO donor. The dosage of DEANO provided a NO:heme ratio of approximately 1:200, which is dilute compared to all other forms of Hb. Our results show that there is no statistical evidence that a venous-arterial gradient of NO exists as measured by ESR.
From a biochemical reaction point of view, it is very difficult to rationalize the HbNO A-V gradient. For rats, the heart beat isabout 400/min, the stroke volume is about 120 μl, and the total blood volume is about 20 ml for a 300-g rat. This means that one complete blood cycle takes about 25 s. To achieve such an HbNO gradient within such a short period of time, any transformation between Hb(Fe+2)NO and Hb(β93)NO must be faster than this, which is not consistent with the known lifetime of HbNO of about 20 min (in vitro) [31]. Moreover, the venous-arterial gradient hypothesis implies that NO is not consumed, but recycled during blood circulation, which is contradicted by the increase in nitrate and nitrite levels in the plasma when NO is administered [17].
The presence of A-V gradients of HbNO is controversial. The model that predicts such gradients [6,9] suggests that HbNO is in dynamic equilibrium with SNO-Hb, the position of which depends on the conformation (and, therefore, the level of oxygen saturation). According to this model, release of NO equivalents from SNO-Hb during hemoglobin deoxygenation should lead to an increase in HbNO during A to V transit, and HbNO should decrease in concentration during reoxygenation due to the reverse transfer of NO equivalents from heme to thiol. Whereas it has been repeatedly shown that such transfer cannot occur in isolated hemoglobin or in washed red cells [14,35], A-V gradients of HbNO and SNO-Hb in humans, measured by photolysis chemiluminescence, have been used as evidence for the presence of such an equilibrium in vivo [9]. As mentioned above, EPR analysis of HbNO has been largely problematic due to the misinterpretation of the complex EPR spectra. In addition, endogenous levels of HbNO in humans are too low (<200 nM) to be seen by EPR techniques. In humans inhaling NO to increase HbNO levels, no A-V gradient could be detected [28], and, if anything, a V-A gradient was observed, in agreement with previous measurements made using triiodide-based chemiluminescence [36]. In this study we chose to test the hypothesis that A-V gradients could exist in a rat model by directly examining HbNO levels with EPR after infusion of DEANO at a range of oxygen concentrations. Our data unequivocally show that A-V gradients of HbNO are not observed under normoxia or hypoxia, suggesting that any equilibrium between HbNO and putative SNO-Hb must occur on a slower time scale than the circulation time of the rat.
Although there is no total HbNO concentration difference between venous and arterial blood, the ratio of 5-coordinate to 6-coordinate HbNO in venous and arterial blood is different. As expected, the 5-coordinate HbNO is higher when the oxygen concentration is lower, and the 6-coordinate HbNO is lower when the oxygen concentration is higher.
Our results show that the formation of HbNO in either venous or arterial blood depends inversely on oxygen concentration, more specifically, the saturated oxyhemoglobin percentage (SpO2), in a linear fashion. Because the reaction between oxyhemoglobin and NO,
has a reaction rate similar to that of deoxyHb reacting with NO [37,38], less HbNO should be formed when the SpO2 is higher and, consequently, when deoxyHb is lower. This result is consistent with the reaction between oxyhemoglobin and NO being very significant.
At first glance it may seem that our results taken with 10% oxygen, yielding 70% arterial SpO2, are inconsistent with the reaction of deoxyHb and oxyHb, with NO occurring at similar rates, because our quantitation indicated that we had trapped all of the 50 μM NO theoretically available from the 25 μM DEANO administered to the bloodstream without any of the NO reacting with HbO2 to form nitrate. It is important to note that the accurate assessment of the concentration of HbNO in blood is difficult. In fact, the quantification in EPR is very difficult [39-42], especially for weak, biological, frozen samples. Despite our best efforts, our quantification of the absolute concentration of HbNO still could have a relatively large error. In our results, the relative concentrations of HbNO are much more accurate than the quantified absolute concentrations as indicated by the relatively small standard errors. In addition to this, the calculated concentration of DEANO in rat blood depends upon an estimate of the rat blood volume, which may vary significantly from animal to animal. Based on the data presented here we would caution against drawing any conclusions based on total HbNO yield.
Acknowledgments
This research was supported by the Intramural Research Program of the NIH, National Institute of Environmental Health Sciences. The authors thank Dr. Ann Motten and Mrs. Mary J. Mason for editorial help.
References
- [1].Furchgott RF, Zawadzki JV. The obligatory role of endothelial cells in the relaxation of arterial smooth muscle by acetylcholine. Nature. 1980;288:373–376. doi: 10.1038/288373a0. [DOI] [PubMed] [Google Scholar]
- [2].Palmer RMJ, Ferrige AG, Moncada S. Nitric oxide release accounts for the biological activity of endothelium-derived relaxing factor. Nature. 1987;327:524–526. doi: 10.1038/327524a0. [DOI] [PubMed] [Google Scholar]
- [3].Igarro LJ, Buga GM, Wood KS, Byrns RE, Chaudhuri G. Endothelium-derived relaxing factor produced and released from artery and vein is nitric oxide. Proc. Natl. Acad. Sci. U. S. A. 1987;84:9265–9269. doi: 10.1073/pnas.84.24.9265. [DOI] [PMC free article] [PubMed] [Google Scholar]
- [4].Singel DJ, Stamler JS. Chemical physiology of blood flow regulation by red blood cells: the role of nitric oxide and S-nitrosohemoglobin. Annu. Rev. Physiol. 2005;67:99–145. doi: 10.1146/annurev.physiol.67.060603.090918. [DOI] [PubMed] [Google Scholar]
- [5].Gladwin MT, Lancaster JR, Jr., Freeman BA, Schechter AN. Nitric oxide’s reactions with hemoglobin: a view through the SNO-storm. Nat. Med. 2003;9:496–500. doi: 10.1038/nm0503-496. [DOI] [PubMed] [Google Scholar]
- [6].McMahon TJ, Moon RE, Luschinger BP, et al. Nitric oxide in the human respiratory cycle. Nat. Med. 2002;8:711–717. doi: 10.1038/nm718. [DOI] [PubMed] [Google Scholar]
- [7].Robinson JM, Lancaster JR., Jr. Hemoglobin-mediated, hypoxia-induced vasodilation via nitric oxide: mechanism(s) and physiologic versus pathophysiologic relevance. Am. J. Respir. Cell Mol. Biol. 2005;32:257–261. doi: 10.1165/rcmb.F292. [DOI] [PubMed] [Google Scholar]
- [8].Stamler JS, Jia L, Eu JP, et al. Blood flow regulation by S-nitrosohemoglobin in the physiological oxygen gradient. Science. 1997;276:2034–2037. doi: 10.1126/science.276.5321.2034. [DOI] [PubMed] [Google Scholar]
- [9].Jia L, Bonaventura C, Bonaventura J, Stamler JS. S-nitrosohaemoglobin: a dynamic activity of blood involved in vascular control. Nature. 1996;380:221–226. doi: 10.1038/380221a0. [DOI] [PubMed] [Google Scholar]
- [10].McMahon TJ, Stone AE, Bonaventura J, Singel DJ, Stamler JS. Functional coupling of oxygen binding and vasoactivity in S-nitrosohemoglobin. J. Biol. Chem. 2000;275:16738–16745. doi: 10.1074/jbc.M000532200. [DOI] [PubMed] [Google Scholar]
- [11].Wolzt M, MacAllister RJ, Davis D, et al. Biochemical characterization of S-nitrosohemoglobin: mechanisms underlying synthesis, NO release, and biological activity. J. Biol. Chem. 1999;274:28983–28990. doi: 10.1074/jbc.274.41.28983. [DOI] [PubMed] [Google Scholar]
- [12].Patel RP, Hogg N, Spencer NY, Kalyanaraman B, Matalon S, Darley-Usmar VM. Biochemical characterization of human S-nitrosohemoglobin: effects on oxygen binding and transnitrosation. J. Biol. Chem. 1999;274:15487–15492. doi: 10.1074/jbc.274.22.15487. [DOI] [PubMed] [Google Scholar]
- [13].Funai EF, Davidson A, Seligman SP, Finlay TH. S-nitrosohemoglobin in the fetal circulation may represent a cycle for blood pressure regulation. Biochem. Biophys. Res. Commun. 1997;239:875–877. doi: 10.1006/bbrc.1997.7565. [DOI] [PubMed] [Google Scholar]
- [14].Huang KT, Azarov I, Basu S, Huang J, Kim-Shapiro DB. Lack of allosterically controlled intramolecular transfer of nitric oxide from the heme to cysteine in the β subunit of hemoglobin. Blood. 2006;107:2602–2604. doi: 10.1182/blood-2005-10-4104. [DOI] [PMC free article] [PubMed] [Google Scholar]
- [15].Gladwin MT, Shelhamer JH, Schechter AN, et al. Role of circulating nitrite and S-nitrosohemoglobin in the regulation of regional blood flow in humans. Proc. Natl. Acad. Sci. U. S. A. 2000;97:11482–11487. doi: 10.1073/pnas.97.21.11482. [DOI] [PMC free article] [PubMed] [Google Scholar]
- [16].Deem S, Kim SS, Min J-H, et al. Pulmonary vascular effects of red blood cells containing S-nitrosated hemoglobin. Am. J. Physiol.: Heart Circ. Physiol. 2004;287:H2561–H2568. doi: 10.1152/ajpheart.00310.2004. [DOI] [PubMed] [Google Scholar]
- [17].Davies NA, Brealey DA, Stidwill R, Singer M, Svistunenko DA, Cooper CE. Nitrosyl heme production compared in endotoxemic and hemorrhagic shock. Free Radic. Biol. Med. 2005;38:41–49. doi: 10.1016/j.freeradbiomed.2004.09.026. [DOI] [PubMed] [Google Scholar]
- [18].Jaszewski AR, Fann YC, Chen Y-R, Sato K, Corbett J, Mason RP. EPR spectroscopy studies on the structural transition of nitrosyl hemoglobin in the arterial-venous cycle of DEANO-treated rats as it relates to the proposed nitrosyl hemoglobin/nitrosothiol hemoglobin exchange. Free Radic. Biol. Med. 2003;35:444–451. doi: 10.1016/s0891-5849(03)00324-1. [DOI] [PubMed] [Google Scholar]
- [19].Kosaka H, Sawai Y, Sakaguchi H, et al. ESR spectral transition by arteriovenous cycle in nitric oxide hemoglobin of cytokine-treated rats. Am. J. Physiol. 1994;266:C1400–C1405. doi: 10.1152/ajpcell.1994.266.5.C1400. [DOI] [PubMed] [Google Scholar]
- [20].Archer S. Measurement of nitric oxide in biological models. FASEB J. 1993;7:349–360. doi: 10.1096/fasebj.7.2.8440411. [DOI] [PubMed] [Google Scholar]
- [21].Tsikas D. Methods of quantitative analysis of the nitric oxide metabolites nitrite and nitrate in human biological fluids. Free Radic. Res. 2005;39:797–815. doi: 10.1080/10715760500053651. [DOI] [PubMed] [Google Scholar]
- [22].Wang Q, Jacobs J, DeLeo J, et al. Nitric oxide hemoglobin in mice and rats in endotoxic shock. Life Sci. 1991;49:PL55–PL60. doi: 10.1016/0024-3205(91)90251-6. [DOI] [PubMed] [Google Scholar]
- [23].Dikalov S, Fink B. ESR techniques for the detection of nitric oxide in vivo and in tissues. Methods Enzymol. 2005;396:597–610. doi: 10.1016/S0076-6879(05)96052-7. [DOI] [PubMed] [Google Scholar]
- [24].Chamulitrat W, Jordan SJ, Mason RP. Nitric oxide production during endotoxic shock in carbon tetrachloride-treated rats. Mol. Pharmacol. 1994;46:391–397. [PubMed] [Google Scholar]
- [25].Jiang J, Jordan SJ, Barr DP, Gunther MR, Maeda H, Mason RP. In vivo production of nitric oxide in rats after administration of hydroxyurea. Mol. Pharmacol. 1997;52:1081–1086. doi: 10.1124/mol.52.6.1081. [DOI] [PubMed] [Google Scholar]
- [26].Glover RE, Ivey ED, Orringer EP, Maeda H, Mason RP. Detection of nitrosyl hemoglobin in venous blood in the treatment of sickle cell anemia with hydroxyurea. Mol. Pharmacol. 1999;55:1006–1010. doi: 10.1124/mol.55.6.1006. [DOI] [PubMed] [Google Scholar]
- [27].Gladwin MT, Raat NJH, Shiva S, Dezfulian C, Hogg N, Kim-Shapiro DB, Patel R. Nitrite as a vascular nitric oxide reservoir that contributes to hypoxic signaling, cytoprotection, and vasodilation. Am. J. Physiol.: Heart Circ. Physiol. 2006;291:H2026–H2035. doi: 10.1152/ajpheart.00407.2006. [DOI] [PubMed] [Google Scholar]
- [28].Piknova B, Gladwin MT, Schechter AN, Hogg N. Electron paramagnetic resonance analysis of nitrosylhemoglobin in humans during NO inhalation. J. Biol. Chem. 2005;208:40583–40588. doi: 10.1074/jbc.M506292200. [DOI] [PubMed] [Google Scholar]
- [29].Gladwin MT, Ognibene FP, Pannell LK, Nichols JS, Pease-Feye ME, Shelhamer JH, Schechter AN. Relative role of heme nitrosylation and β-cysteine 93 nitrosation in the transport and metabolism of nitric oxide by hemoglobin in the human circulation. Proc. Natl. Acad. Sci. U. S. A. 2000;97:9943–9948. doi: 10.1073/pnas.180155397. [DOI] [PMC free article] [PubMed] [Google Scholar]
- [30].Diehl K-H, Hull R, Morton D, et al. A good practice guide to the administration of substances and removal of blood, including routes and volumes. J. Appl. Toxicol. 2001;21:15–23. doi: 10.1002/jat.727. [DOI] [PubMed] [Google Scholar]
- [31].Henry YA. EPR characterization of nitric oxide binding to hemoglobin. In: Yann YA, Guissani A, Ducastel B, editors. Nitric oxide research from chemistry to biology: EPR spectroscopy of nitrosylated compounds. R.G. Landes; Austin, TX: 1996. pp. 61–97. [Google Scholar]
- [32].Kirima K, Tsuchiya K, Sei H, et al. Evaluation of systemic blood NO dynamics by EPR spectroscopy: HbNO as an endogenous index of NO. Am. J. Physiol.: Heart Circ. Physiol. 2003;285:H589–H596. doi: 10.1152/ajpheart.01010.2002. [DOI] [PubMed] [Google Scholar]
- [33].Inoue K, Akaike T, Miyamoto Y, et al. Nitrosothiol formation catalyzed by ceruloplasmin: implication for cytoprotective mechanism in vivo. J. Biol. Chem. 1999;274:27069–27075. doi: 10.1074/jbc.274.38.27069. [DOI] [PubMed] [Google Scholar]
- [34].Yonetani T, Tsuneshige A, Zhou Y, Chen X. Electron paramagnetic resonance and oxygen binding studies of α-nitrosyl hemoglobin: a novel oxygen carrier having NO-assisted allosteric functions. J. Biol. Chem. 1998;273:20323–20333. doi: 10.1074/jbc.273.32.20323. [DOI] [PubMed] [Google Scholar]
- [35].Xu XL, Cho M, Spencer NY, Patel N, Huang Z, Shields H, King SB, Gladwin MT, Hogg N, Kim-Shapiro DB. Measurements of nitric oxide on the heme iron and β-93 thiol of human hemoglobin during cycles of oxygenation and deoxygenation. Proc. Natl. Acad. Sci. U. S. A. 2003;100:11303–11308. doi: 10.1073/pnas.2033883100. [DOI] [PMC free article] [PubMed] [Google Scholar]
- [36].Wang X, Bryan NS, MacArthur PH, Rodriguez J, Gladwin MT, Feelisch M. Measurement of nitric oxide levels in the red cell validation of tri-iodide-based chemiluminescence with acid-sulfanilamide pretreatment. J. Biol. Chem. 2006;281:26994–27002. doi: 10.1074/jbc.M603953200. [DOI] [PubMed] [Google Scholar]
- [37].Herold S, Rock G. Reactions of deoxy-, oxy-, and methemoglobin with nitrogen monoxide: mechanistic studies of the S-nitrosothiol formation under different mixing conditions. J. Biol. Chem. 2003;278:6623–6634. doi: 10.1074/jbc.M210275200. [DOI] [PubMed] [Google Scholar]
- [38].Azarov I, Huang KT, Basu S, Gladwin MT, Hogg N, Kim-Shapiro DB. Nitric oxide scavenging by red blood cells as a function of hematocrit and oxygenation. J. Biol. Chem. 2005;280:39024–39032. doi: 10.1074/jbc.M509045200. [DOI] [PubMed] [Google Scholar]
- [39].Weil JA, Bolton JR, Wertz JE. Experimental considerations: signal intensities and spin concentrations. In: Weil JA, Bolton JR, Wertz JE, editors. Electron paramagnetic resonance: elementary theory and practical applications. Wiley; New York: 1994. pp. 497–500. [Google Scholar]
- [40].Nagy V. Quantitative EPR: some of the most difficult problems. Appl. Magn Reson. 1994;6:259–285. [Google Scholar]
- [41].Mazur M. A dozen useful tips on how to minimise the influence of sources of error in quantitative electron paramagnetic resonance (EPR) spectroscopy—a review. Anal. Chem. Acta. 2006;561:1–15. [Google Scholar]
- [42].Czoch R. Quantitative EPR—sensitivity to experimental conditions and optimal setting of recording parameters. Appl. Magn. Reson. 1996;10:293–317. [Google Scholar]