Abstract
X-ray structures of the TATA box-binding protein complexed with its DNA target show that the nucleic acid is severely bent away from the protein and also strongly unwound. We have used molecular mechanics and energy mapping to understand how such an unusual conformation can be induced. The results show that simple deformation pathways involving local stretching or unwinding of DNA reproduce many features of the experimental structure. Notably, kinked junctions with the flanking B-DNA regions occur without the need for any specific local interactions with the protein. It is also shown that phosphate neutralization plays an important role in the formation of the complex.
Keywords: protein–DNA interaction, molecular modeling, conformational transitions, sequence specificity
The TATA box-binding protein (TBP) binds specifically to the TATA element in the first step of the formation of the multiprotein initiation complex. The structure of the complexes between TBP and DNA solved by x-ray crystallography (1–3) shows that DNA is severely deformed. The protein binds to the minor groove face of the DNA duplex and bends DNA away toward the major groove. More recent x-ray studies (4–6) show that the structure induced by this interaction is conserved during the fixation of the transcription factors, TFIIA and TFIIB, which bind to the TBP/TATA complex.
The mode of binding of TBP differs from that of most other proteins that interact with DNA. Unlike the majority of DNA-binding proteins where the nucleic acid bends toward or even wraps around the protein, the surface of TBP is concave inducing the DNA to bend away from the protein. This is also in contrast to the simple electrostatic model of Mirzabekov and Rich (7), which predicts that phosphate group neutralization by TBP on the minor groove face of DNA would cause bending in this direction and thus toward the protein. TBP thus represents a new model for DNA binding, which is shared by several other proteins, notably SRY and LEF (8, 9).
The aim of this work is to use molecular modeling to investigate the DNA deformation provoked by TBP and to suggest a simple underlying mechanism for the complexion. Conformational analysis (10), electrostatic studies (11), and molecular dynamics (12) have already been carried out to understand the structure of the TATA box bound to TBP and the role played by specific protein–DNA interactions. Examples of such interactions include the charged side chains interacting with the phosphodiester backbone and the intercalation of the phenylalanine residues at the kink sites produced in the double helix (reviewed in ref. 13).
The starting point for this work was a detailed helicoidal analysis of the TATA box complex (10). This work showed that the DNA region bound to TBP in fact has a regular, but noncanonical, structure that is characterized by strongly inclined base pairs. Using this information we were able to make a connection with earlier results on the nanomanipulation of DNA (14, 15), which suggested to us that local stretching and/or unwinding might be a critical element in the observed protein-induced deformation. To better understand the conformational and energetic aspects of complex formation, we have used molecular modeling to determine a preferential pathway that reproduces the observed deformation (1, 2) and also reveals the unique local conformational features connected with this process.
METHODS
All calculations were carried out using version 10.0 of the jumna (junction minimization of nucleic acids) program (16). This program differs from most molecular modeling approaches in that it represents DNA using a combination of internal and helicoidal coordinates, rather than Cartesian atomic coordinates. All bond lengths are taken to be fixed and valence angle changes are limited to the phosphodiester backbones and the sugar rings. These choices enable the total number of variables representing a nucleic acid fragment to be reduced by roughly a factor of 10. When appropriate, jumna also allows helical symmetry to be imposed by simply grouping together helically equivalent variables. In this case, it is possible to further reduce the cost of energy calculations and to avoid end-effects by optimizing the energy of one symmetry repeating unit within a regular polymeric environment. Whereas one turn of double helical DNA (≈650 atoms) is normally represented by nearly 2,000 Cartesian variables, jumna requires ≈300 variables without symmetry and a minimum of only 30 variables with symmetry. This significant reduction, coupled with the use of chemically meaningful variables (single bond rotations and valence angle deformations), greatly improves the efficiency of energy minimization.
Helicoidal coordinates are introduced by breaking the nucleic acid into a series of 3′-monophosphate nucleotides. Each nucleotide is positioned in space with respect to a helical axis system, using three translational (Xdisp, Ydisp, Rise) and three rotational (Inclination, Tip, Twist) variables. The internal movements of the nucleotides are represented by sugar puckering (four variables), the glycosidic bond and two bond torsions (ɛ, C3′–O3′; and ζ, O3′–P) and two valence angles (C3′–O3′–P; O3′–P–O5′) within the phosphodiester backbone. Internucleotide links (O5′–C5′) are maintained using quadratic distance constraints. The bond rotations involving these linkages are dependent variables.
jumna uses the Flex force field, developed specifically for nucleic acids (16, 17). This enables the calculation of conformational enthalpies, which include Lennard–Jones and electrostatic contributions between nonbonded atoms (including an angle-dependent hydrogen bonding term) as well as valence angle and bond torsion contributions. Solvent damping of electrostatic interactions is treated using a sigmoidal distance-dependent dielectric function (17, 18), and counterion binding is mimicked by halving the net phosphate charge (0.25e being added to the point charge on each anionic oxygen). Although this is a rather simple model, which ignores detailed solvent or salt effects and entropic features, it has been found to yield double helical structures and to predict conformational transitions, in good agreement with experimental data (19, 20).
Finally, this representation of DNA enables any structural feature of the model to be controlled very simply. This feature has already been extensively used to map the energy changes associated with changes in sugar pucker and with the backbone or helical conformations (17, 21). More recently adiabatic mapping has been used as a function of chosen distance constraints to stretch a helically symmetric DNA double helix (15). Here we use a similar procedure to locally stretch or unwind an oligomeric DNA. Stretching involves performing energy minimizations for structures deformed by steadily increasing distance constraints between chosen backbone phosphorus atoms. Unwinding involves a constraint on the angle between the C1′–C1′ vectors of chosen base pairs projected into a plane perpendicular to the local helical axis of the molecule.
RESULTS
Analysis of the Deformation Geometry.
The x-ray studies of TBP bound to the TATA box have revealed a novel form of DNA involving a local unwinding of 105° and an overall curvature of 80°. A recent analysis of this structure has shown that the 8 bp of DNA bound to the protein undergo a transition to a modified A-like helical form, termed TA-DNA (10), which is characterized by strong positive base pair inclination (≈50°) and a rotation around the glycosidic angle to much less negative values (approximately −115°) than those found in A-DNA (−160°). [TA-DNA appears to be a less extreme form of the so-called vertical double helices proposed by Olson (22).] This observation led to the idea that TA-DNA might be produced from an intermediate A-DNA state (10), a hypothesis that is additionally supported by the fact that the majority of the sugars of the bound DNA region have C3′-endo puckers characteristic of A-DNA and that the TATA sequence is known to be able to adopt the A conformation (23).
These results imply that TBP binding should be viewed as inducing a local conformational change in DNA and that the overall bending of the structure is largely a consequence of changes in base pair inclination at the junctions between this new conformation and the flanking B-DNA regions.
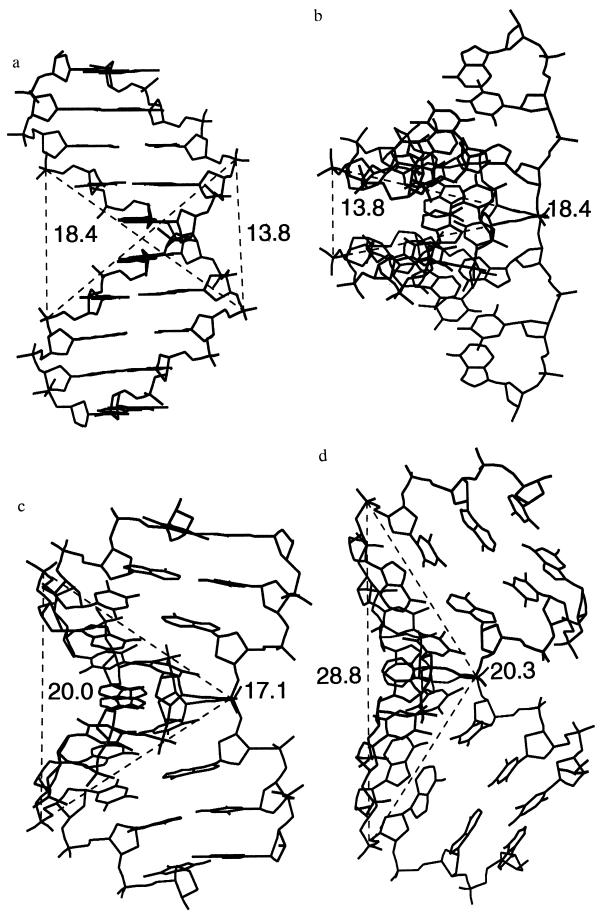
Another geometrical observation sheds light on the conformational transition involved. If we measure the intra- and interstrand distances between the phosphorus atoms flanking the central TATA sequence and compare the results obtained for canonical B-DNA, canonical A-DNA, and for the complexed form of the TATA box sequence (Fig. 1), it is striking to note that only one distance out of four changes significantly between the three conformational forms. This distance corresponds to the interstrand separation between the phosphorus atoms at the 3′ extremities of the TATA sequence. While the length of the strands (the two intrastrand distances) and the separation between the 5′ extremities vary only slightly, the 3′–3′ distance changes from 13.8 Å in B-DNA to 20.0 Å in A-DNA and finally to 28.6 Å in the complexed TATA box (Fig. 1). TBP binding can thus be interpreted as stretching the 3′–3′ distance bracketing the TATA sequence by a factor of almost 2.1.
Figure 1.
Interstrand distances between the phosphorus atoms flanking a TATA sequence within DNA. (a) B-DNA viewed perpendicularly to the helical axis. (b) B-DNA viewed along the 5′–5′ vector. (c) A-DNA viewed along the 5′–5′ vector. (d) The complexed TATA box (1) viewed along the 5′–5′ vector.
In a recent study concerning the “molecular combing” of DNA (24) it has been shown that the macroscopic limit to DNA stretching occurs at a relative extension of roughly 2.1 times. The binding of TBP thus creates a local elongation of DNA, at least on the minor groove side of the duplex, which is close to this absolute limit. Recent molecular modeling studies associated with further nanomanipulation experiments (14, 15) have been able to propose a DNA conformational transition compatible with the experimental force measurements. The results suggest that the stretched conformation strongly depends on the ends of the DNA duplex that are stretched. In the case of 3′–3′ stretching of B-DNA, the resulting conformation involves strong unwinding, but little base pair inclination. On the other hand, 3′–3′ stretching of A-DNA results in coupled unwinding and strong positive inclination, compatible with the changes seen within the TBP–TATA box complex. (It should however be remarked that the TBP stretching does not result in an overall lengthening of the DNA since only the minor groove side of the duplex is stretched. In macroscopically stretched DNA both the 3′–3′ and 5′–5′ distances increase in a coupled manner.)
These different observations led us to believe that there was probably a simple conformational route for generating the complexed conformation of the TATA box involving either local stretching or helical unwinding. Moreover, it appeared possible that inducing this local conformational change in DNA, without taking the protein directly into account, could help in understanding (i) the overall conformation of DNA complexed to TBP (bending, kinking, etc.) and (ii) the energetics of the remarkable DNA deformation induced by TBP.
Deforming a Regular Alternating (AT)n Sequence.
Given the observations above, we have tried to reproduce the structure of the TATA box by locally stretching or unwinding central 4–6 bp of a simple alternating (AT)n oligomer (15 bp in length). The central TATATATA region of this oligomer satisfies the consensus sequence for the TATA box and is close to the binding sequence (underlined) used in the TBP–TATA box crystal structure of Kim et al. (1), GTATATAAAACG.
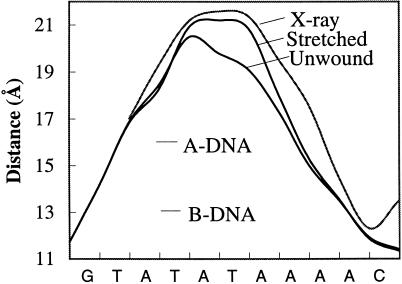
We began by stretching either a 4-, 5-, or 6-bp segment within the oligomer using a simple distance constraint between the 3′-3′ phosphorus atoms delimiting the segment in question, reminimizing the structure after every step, and using step sizes of 0.2–0.3 Å. In the same way, we locally unwound DNA by diminishing the angle between the terminal C1′–C1′ vectors of the 4, 5, and central 6 bp of the TATA box, using steps of 6°–10° between energy minimizations. The reason for applying these constraints to the central 4–6 bp can be judged from measurements of the 3′–3′ phosphorus distances for successive dinucleotide steps along the complexed TATA box structure (Fig. 2). These curves clearly show that the major deformation is limited to roughly 6 bp.
Figure 2.
The 3′–3′ phosphorus distances (Å) for successive dinucleotide base pairs along the TATA box sequence for the x-ray structure of the TATA box (1) and the simulated stretched and unwound conformations (the curve shown is a polynomial fit to the successive P–P distances). The values for canonical A- and B-DNA are shown for comparison.
To estimate the importance of the A-like backbone conformation for the central TATA box sequence, we considered three different starting conformations: B-DNA, A-DNA, and a BAB hybrid form with 8 A-DNA nucleotide base pairs contained within flanking B-DNA sequences. (The hybrid form being induced by imposing C3′-endo sugar puckers on the eight central nucleotides of each strand, excluding the 3′-terminal nucleotides as in the crystallographic complex, and then energy minimizing the oligomer without any imposed constraints.)
An rms analysis of the model structures with respect to the x-ray structure of the TATA box complex was used to compare the similarity of the simulated and protein induced deformations of DNA. (This analysis was facilitated by artificially modifying the experimental sequence at the appropriate positions to reproduce an alternating AT sequence.) The rms calculations were carried out both on the central 4 bp of the TATA box and on a 12-bp fragment corresponding to the length of the experimental DNA duplex. The first of these measurements is thus more sensitive to the fine structure of the bound fragment of DNA, while the second adds the requirement that the overall bending of the oligomers should be similar. We also calculate an angular rms value using the backbone torsion angles (α, β, γ, ɛ, ζ), the glycosidic angle (χ), and the sugar puckering (phase and amplitude) of each nucleotide (25). Although this measurement includes all the variables necessary to describe the DNA in question, it is much more sensitive to local conformation than to overall structure. Finally, we also helically analyzed the structures using the curves algorithm (26).
The results of the rms analysis are summarized in Table 1 and the average torsion angles and sugar puckers are given in the Table 2. Comparing the spatial and angular rms values enables us to define two preferential deformation routes. These involve either stretching or unwinding the four central bases pairs of the TATA box, starting from the hybrid BAB form. These results confirm that the presence of an A-like structure appears to be important in the bound portion of the oligomer, and also that the apparent bending is largely due to the junctions created between the central TA-helix (covering 8 bp) and the flanking B-DNA conformations. The results also confirm that local 3′–3′ stretching and unwinding of the DNA duplex are closely coupled to one another as was the case in our studies of the overall stretching of polymeric DNA using helical symmetry constraints (15).
Table 1.
RMS differences between the crystal structure of the DNA fragment within the TBP-TATA-box complex (1) and various model DNA conformations
| Sequence | Constrained segment | Stretched
|
Unwound
|
||||
|---|---|---|---|---|---|---|---|
| B | A | BAB | B | A | BAB | ||
| (AT)n | 4 | 1.2/2.6 | 1.7/2.9 | 1.5/2.2 | 1.7/2.9 | 1.5/2.9 | 1.5/1.7 |
| 50/40 | 25/38 | 23/27 | 44/38 | 32/40 | 26/28 | ||
| 5 | 1.5/2.3 | 1.8/2.9 | 1.7/2.5 | 2.0/2.8 | 1.9/3.5 | 1.8/2.2 | |
| 47/39 | 24/38 | 21/27 | 44/38 | 25/38 | 25/28 | ||
| 6 | 1.9/1.8 | 2.2/3.5 | 2.1/2.9 | 2.1/2.8 | 1.6/2.2 | 1.7/1.7 | |
| 46/39 | 25/38 | 23/27 | 42/39 | 27/39 | 26/28 | ||
| TATA-box | 4 | 1.1/2.8 | 1.5/2.7 | ||||
| 29/23 | 29/23 | ||||||
(In each line, the first value refers to the constrained segment of DNA and the second to the complete 12 base pair oligomer. For each model, the first line gives the Cartesian RMSD in Å and the second line gives the angular RMSD in degrees. B, A and BAB refer respectively to starting conformations in the B-form, the A-form and a mixed B-A-B hybrid).
Table 2.
Average values of torsion angles (°), calculated for the eight central base pairs of the TATA-box in the X-ray (1), model and canonical DNA conformations.
| Structure | χ | ɛ | ζ | α | γ | β | Phase |
|---|---|---|---|---|---|---|---|
| X-ray | −115 | −150 | −92 | −73 | 54 | 166 | 66 |
| Stretched (AT)n | −134 | −157 | −80 | −74 | 58 | 179 | 35 |
| Unwound (AT)n | −140 | −157 | −79 | −72 | 58 | 175 | 45 |
| Stretched TATA box | −131 | −160 | −79 | −74 | 60 | 180 | 37 |
| Unwound TATA box | −135 | −161 | −76 | −73 | 59 | 176 | 42 |
| A-DNA | −160 | −155 | −67 | −75 | 59 | 181 | 18 |
| B-DNA | −102 | −133 | −157 | −41 | 37 | 136 | 155 |
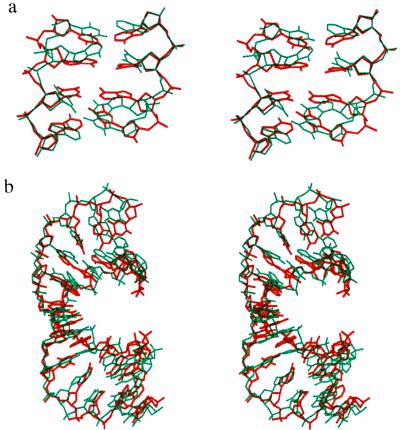
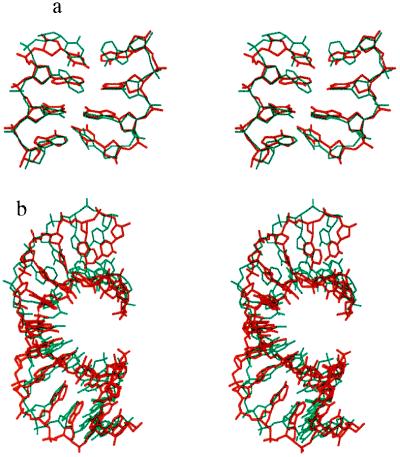
The superposed x-ray and stretched model structures are presented in the Fig. 3 a and b, respectively, for the central 4 and for 12 bp. Both stretching and unwinding deformation routes generate structures showing a striking similarity with the protein induced conformation. By stretching the central 4 bp of the oligomer we generate a structure with rms values of, respectively, 1.5 Å and 2.2 Å for the central 4 bp and for 12 bp, while unwinding applied to the same zone leads to values of 1.5 Å and 1.7 Å. Both deformations lead to a total unwinding close to that of the experimental conformation, although this unwinding is more uniformly distributed in the simulated structure, presumably due to the lack of constraints connected with specific protein interactions.
Figure 3.
Superposition of the x-ray structure of the complexed TATA box (red) with the stretched model conformation (blue) of the (AT)n alternating oligomer for (a) the central TATA sequence and (b) the 12 bp of the bound duplex. The upper view is into the minor groove.
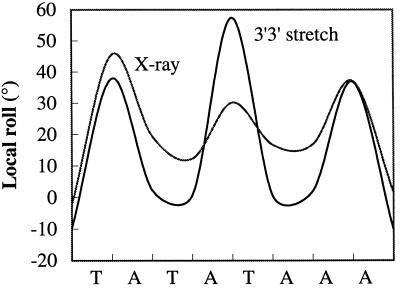
Both deformation routes also produce sharp kinks caused by the large roll angles between the base pairs, opening toward the minor groove, at the terminal steps of the bound DNA, as well as at the central base-pair step. The comparison between the model and x-ray local base pair roll values in Fig. 4 shows this striking correlation in the case of the stretched conformation. Terminal roll angles (38° and 37°) produced by stretching are close to the experimental values (46° and 37°). The central dinucleotide step is somewhat over-distorted (57° versus 30° experimentally), but this is compensated by under-distorted values for the flanking dinucleotides. The large rolls are also accompanied by large rise values as in the experimental conformation. In the case of unwinding, the values are more uniformly distributed and appear to be more closely coupled to the alternating AT sequence. The terminal roll angles nevertheless remain large (27° and 25°).
Figure 4.
Comparison of the local roll angles along the TATA box sequence for the x-ray conformation (1) and for the stretched model (AT)n oligomer (the curve shown is a polynomial fit to the successive roll angles).
It has previously been suggested that the kinks at the end of the bound DNA segment are the result of specific protein interactions, notably involving the partial intercalation of phenylalanine side chains (1–3). It has thus been concluded that these interactions may play an important role in inducing DNA kinking. The present study suggests rather that kinking occurs to relax the junctions formed between TA-DNA and the flanking B-DNA segments. The intercalation of the phenylalanyl side chains may stabilize such local deformations once they are formed, rather than inducing them.
The backbone torsion angles of the model structures agree well with the experimental structure as shown in Table 2. The largest differences involve the glycosidic angles that are 15°–20° more negative than those of the experimental structure (vide infra). It is also noted that once we induce C3′–endo sugars within the central zone, no further transitions occur due to stretching or unwinding and thus we do not see the O4′–endo puckers observed for several central nucleotides within the experimental conformation. These sugars puckers may not be well determined at the resolution currently achieved, or they may also be the consequence of specific protein interactions.
Deforming the Specific Sequence of the TATA Box.
To refine our results and to study the impact of the experimental base sequence on the process of deformation, we repeated the two preferential deformation routes using the GCGTATATAAAACGC sequence of the TBP–TATA box crystal structure of Kim et al. (1). (Note that for ease of comparison with the calculations of the 15-bp alternating AT oligomer, we have extended the underlined experimental sequence to a 15-mer as indicated.) As shown in Table 1, this change of sequence resulted in an improvement in the superposition of the bases for the central four base pairs, as illustrated in Fig. 5 for the stretching pathway. In this case, there is a net improvement in the rms difference with the crystallographic structure, which has now decreased to only 1.1 Å. The only significant changes in detailed conformational parameters involved the rise (mean value 3.4 Å) and the roll (mean value 11°) of the last 4 bp of the bound region (TAAA), which are understandably more regular than those of the alternating TA sequence. However, it is remarked that the glycosidic angles of the central region are now closer to the crystallographic values by being roughly 5° less negative than the value for the alternating sequence (Table 2). The overall oligomer shows a poorer rms fit than the simple alternating AT oligomer, but this is mainly due to worse agreement between the terminal nucleotides of the oligomer and a similar effect is not observed in the angular rms values, which are once again better for the true base sequence. The phosphate–phosphate distance plot for the correct base sequence shows no significant difference with the alternating (AT)n oligomer (results not shown).
Figure 5.
Superposition of the x-ray structure of the complexed TATA box (red) with the stretched model conformation of an oligomer with an identical base sequence (blue) for (a) the central TATA sequence and (b) the 12 bp of the bound duplex. The upper view is into the minor groove.
We conclude from these results that our simple deformation pathway is (i) not strongly affected by, at least, one set of limited changes to the sequence studied, and (ii) that this simple model, ignoring the presence of the protein, reproduces well characteristic features of the experimentally determined TATA box conformation.
Energetics of the Deformation.
To understand the energetics of the TATA box deformation we have broken the process into two stages. First, as described above, we began by creating a BAB hybrid form within the GCGTATATAAAACGC sequence, where only the TATATAAA segment (excluding the 3′-terminal nucleotides) is in an A-DNA conformation. We then distort this central region by stretching or unwinding. Alternatively, we inverted this protocol by stretching or unwinding first and then inducing an A-like conformation in the TATATAAA segment. The energy associated with these various steps is summarized below. The upper route of each diagram consists of a transition from B-DNA to a BAB hybrid as the first step and stretching (subscript s) or unwinding (subscript u) of the hybrid as the second step. The alternative route shown at the lower level consists of stretching or unwinding of B-DNA as the first step, and induction of an A-like conformation as the second step. The numbers correspond to the transition energy (Kcal/mol) for each step. The final structure for each route B(A)sB or B(A)uB is similar to that observed in the crystal structures and shown in the Fig. 5. (Note however that the final structures are not identical and thus that the total deformation energy need not be the same along each pathway.)
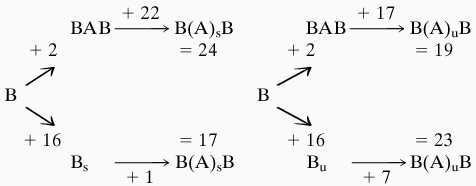 |
The results indicate that if stretching (indicated by the “s” subscript) is used to create the overall deformation, then there is an advantage in inducing the B-A backbone transition after the stretching has occurred. On the other hand, if unwinding (indicated by the “u” subscript) is used, then the energetics favor the overall route involving a B-A transition prior to unwinding. However, given the semiquantitative nature of our modeling, these differences are not significant. It is remarked that the deformation energy of DNA increases roughly quadratically with either the stretching or unwinding constraints and that there is no evidence for an intrinsically stable state in the region of the bound conformation.
Because this overall deformation energy is rather high, it seemed worthwhile to look for ways in which the protein might facilitate the transition. One obvious way involves changing the electrostatically maintained rigidity of DNA by neutralizing certain phosphate groups through interactions with positively charged amino acid side chains belonging to the protein. However, whereas such interactions have been postulated (7) and shown (27) to favor bending toward the neutralized face of DNA, and thus, typically, toward the bound protein, it is not at all clear that they can play a role in the case of the TATA box where protein binding rather induces a conformational transition involving DNA bending away from the protein.
To test this effect we neutralized six phosphate groups in our model DNA, corresponding to the phosphates involved in direct or through-water interactions with lysine or arginine residues of TBP (1, 2). These groups are situated symmetrically on both strands of the TATA box region as shown by the boldface letters below:
| TpApTpApTpApApA | |
| ApTpApTpApTpTpT |
We mimic the interaction of the amino acids with the phosphate groups by adding +0.5e to each of their anionic oxygens. The impact of this change is summarized in the following diagrams.
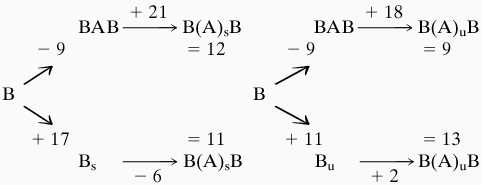 |
It can be seen that the neutralization of only six phosphate groups has a considerable effect by stabilizing the BAB hybrid conformation and thus on the total energy necessary to create the deformed conformation of DNA by stretching or unwinding (although it has only a minor impact on the deformed structures, which remain close to those of Fig. 5). Overall, we observe an energy gain of 6–12 Kcal/mol. In consequence, the energy required for transiting DNA to its bound conformation drops by roughly 50%. It should be added that this effect is unrelated to that recently demonstrated by Elcock and McCammon (28), who showed that DNA bending away from a protein could occur through increased phosphate–phosphate repulsions created by the low dielectric properties of the protein itself. It the present case it appears to be primarily the reduced intrastrand phosphate–phosphate distances in the central zone of the BAB hybrid that are stabilized by phosphate neutralization.
CONCLUSIONS
Based on the conformational analysis of the TBP–TATA box complex (10) and studies of large-scale nucleic acid deformations (14, 15), we have been able to propose a general mechanism for the deformation induced in DNA by TBP binding. Local stretching or unwinding of the TATA box itself turns out to be sufficient to reproduce the overall distortion of DNA and characteristic features of the structure of the bound DNA region. Local stretching and unwinding turn out to be strongly coupled and either constraint mimics very well the deformations created by the protein including the sharp kinks at either end of the TATA box sequence. The intercalation of phenylalanine residues at these positions may thus be a consequence rather than the cause of kinking. The kinks appear as natural structural discontinuities between the TA-DNA conformation, induced for the bound 8 bp and the flanking B-DNA.
Structurally the best results are obtained starting from a BAB hybrid conformation and stretching or unwinding the central 4 bp of the target site of TBP. Energetically, there does not seem to be a large difference between creating the BAB hybrid conformation first and then deforming the DNA or reversing this order. Indeed, it is perfectly feasible that these two events occur concurrently during protein binding. On the other hand, it appears that, despite the simplicity of our model, the phosphate neutralization caused by interactions with cationic residues of TBP plays a major role in binding. If we mimic this neutralization in our model DNA, the energy necessary to create the complexed conformation is reduced by roughly 50% to ≈11 Kcal/mol. This mechanism of this stabilization is quite different from that envisaged by Mirzabekov and Rich (7) or by Elcock and McCammon (28) and mainly involves an easier induction of the central A-DNA conformation.
Finally, one may ask how the TBP could induce DNA to stretch and unwind. In this respect, it is interesting to note that recent molecular dynamics simulations of the TBP show hinge bending and twisting movements between its two domains (12). It is possible to imagine that such pincer-like oscillations could permit neutralization of the phosphates around the central TATA sequence followed by stretching to distort this region. The consequent induction of a wide minor groove that is complementary in shape to the concave surface of TBP and the formation of a large buried surface area with direct interactions between the protein side chains and the DNA could then further stabilize the final conformation.
Acknowledgments
A.L. and R.L. wish to thank the Institut de Développement et des Ressources en Informatique Scientifique (Orsay, France) for their allocation of computer resources and the Association for International Cancer Research (St. Andrews, U.K.) for their support of this research. Z.S. holds the Helena Rubenstein Professorial Chair in Structural Biology and thanks the Israel Science Foundation administrated by the Israel Academy of Sciences and Humanities for their funding.
ABBREVIATION
- TPB
TATA box-binding protein
References
- 1.Kim Y, Gieger J H, Hahn S, Sigler P B. Nature (London) 1993;365:512–520. doi: 10.1038/365512a0. [DOI] [PubMed] [Google Scholar]
- 2.Kim J L, Nikolov D B, Burley S K. Nature (London) 1993;365:520–527. doi: 10.1038/365520a0. [DOI] [PubMed] [Google Scholar]
- 3.Kim J L, Burley S K. Nat Struct Biol. 1994;1:638–653. doi: 10.1038/nsb0994-638. [DOI] [PubMed] [Google Scholar]
- 4.Tan S, Hunziker Y, Sargent D F, Richmond T J. Nature (London) 1996;381:127–134. doi: 10.1038/381127a0. [DOI] [PubMed] [Google Scholar]
- 5.Geiger J H, Hahn S, Lee S, Sigler P. Science. 1996;272:830–836. doi: 10.1126/science.272.5263.830. [DOI] [PubMed] [Google Scholar]
- 6.Nikolov D B, Chen H, Halay E D, Usheha A A, Hisatake K, Lee D K, Roeder R G, Burley S K. Nature (London) 1995;377:119–128. doi: 10.1038/377119a0. [DOI] [PubMed] [Google Scholar]
- 7.Mirzabekov A D, Rich A. Biochemistry. 1979;76:1118–1121. doi: 10.1073/pnas.76.3.1118. [DOI] [PMC free article] [PubMed] [Google Scholar]
- 8.Werner M H, Huth J R, Gronenborn A M, Clore G M. Cell. 1995;81:705–714. doi: 10.1016/0092-8674(95)90532-4. [DOI] [PubMed] [Google Scholar]
- 9.Love J J, Li X, Case D A, Glese K, Grosschedi R, Wright P E. Nature (London) 1995;248:662–678. [Google Scholar]
- 10.Guzikevich-Guerstein G, Shakked Z. Nat Struct Biol. 1996;3:32–37. doi: 10.1038/nsb0196-32. [DOI] [PubMed] [Google Scholar]
- 11.Pastor N, Weinstein H. Protein Eng. 1995;8:543–549. doi: 10.1093/protein/8.6.543. [DOI] [PubMed] [Google Scholar]
- 12.Miakiewicz K, Ornstein R L. J Biomol Struct Dyn. 1996;13:593–600. doi: 10.1080/07391102.1996.10508872. [DOI] [PubMed] [Google Scholar]
- 13.Werner M H, Gronenborn A M, Clore G M. Science. 1996;271:778–784. doi: 10.1126/science.271.5250.778. [DOI] [PubMed] [Google Scholar]
- 14.Cluzel P, Lebrun A, Heller C, Lavery R, Viovy J-L, Chatenay D, Caron F. Science. 1995;271:792–794. doi: 10.1126/science.271.5250.792. [DOI] [PubMed] [Google Scholar]
- 15.Lebrun A, Lavery R. Nucleic Acids Res. 1996;24:2260–2270. doi: 10.1093/nar/24.12.2260. [DOI] [PMC free article] [PubMed] [Google Scholar]
- 16.Lavery R, Zakrzewska K, Sklenar H. Comp Phys Commun. 1995;91:135–158. [Google Scholar]
- 17.Lavery R. Adv Comp Biol. 1994;1:69–145. [Google Scholar]
- 18.Hingerty B, Richie R H, Ferrel T L, Turner J E. Biopolymers. 1985;24:427–439. [Google Scholar]
- 19.Jayaram B, Swaminathan S, Beveridge D L, Sharp K, Honig B. Macromolecules. 1990;23:3156–3165. [Google Scholar]
- 20.Fritsch V, Westhof E. J Am Chem Soc. 1991;113:8271–8277. [Google Scholar]
- 21.Lavery R, Hartmann B. Biophys Chem. 1994;50:33–45. doi: 10.1016/0301-4622(94)85018-6. [DOI] [PubMed] [Google Scholar]
- 22.Olson W K. Proc Natl Acad Sci USA. 1977;74:1775–1779. doi: 10.1073/pnas.74.5.1775. [DOI] [PMC free article] [PubMed] [Google Scholar]
- 23.Shakked Z, Rabinovich D, Kennard O, Cruse W B, Salisbury S A, Viswamitra M A. J Mol Biol. 1983;166:183–201. doi: 10.1016/s0022-2836(83)80005-9. [DOI] [PubMed] [Google Scholar]
- 24.Bensimon D, Simon A, Croquette V, Bensimon A. Science. 1994;265:2096–2098. doi: 10.1126/science.7522347. [DOI] [PubMed] [Google Scholar]
- 25.Lavery R. In: Modelling of Biomolecular Structures and Mechanisms. Pullman A, Jortner J, Pullman B, editors. Dordrecht, The Netherlands: Kluwer; 1995. pp. 217–230. [Google Scholar]
- 26.Lavery R, Sklenar H. J Biomol Struct Dyn. 1989;6:655–667. doi: 10.1080/07391102.1989.10507728. [DOI] [PubMed] [Google Scholar]
- 27.Strauss J K, Maher L J. Science. 1994;266:1829–1834. doi: 10.1126/science.7997878. [DOI] [PubMed] [Google Scholar]
- 28.Elcock A H, McCammon J A. J Am Chem Soc. 1996;118:3787–3788. [Google Scholar]


