

Abstract
Objective
To examine the relationship between perceived family support and other selected correlates of physical activity (PA) with changes in PA over time.
Methods
A total of 421 girls in South Carolina completed questionnaires at 8th, 9th and 12th grades (1998–2003). Family support for PA, PA self-efficacy, perceived behavioral control, attitudes, availability of equipment, and PA were measured.
Results
Growth curve analysis showed that family support, perceived behavioral control, and self-efficacy were independently related to age-related changes in PA as reflected by total METs. Girls who reported lower family support at the 8th grade measure had more rapid declines in PA, and a unit change in family support was related to approximately 1/3 of a standard deviation change in total METs.
Conclusions
Maintenance of support from family members may reduce the decline in PA independent of girl’s self-efficacy and perceived behavioral control.
Keywords: Longitudinal, family support, physical activity, self-efficacy, perceived behavioral control
Introduction
The prevalence of obesity in children and adolescents is increasing in the United States (Jolliffe, 2004; Ogden et al., 2006) and in other countries (Frye and Heinrich, 2003; Booth et al., 2003; Reilly and Dorosty, 1999). In girls, a decline in physical activity (PA) in adolescence may contribute to this increase. Kimm et al. (2002) reported the decline in PA that occurred in girls followed from age 9 or 10 to age 18 or 19 in the NHLBI Growth and Health Study. Over the ten-year period of the study median PA scores declined 64% in White girls and 100% in Black girls. Further, each decline in activity of 10 metabolic equivalent (MET)-times per week was associated with an increase in BMI of 0.14 kg/m2 (Kimm et al., 2005).
Family support has been a consistently reported correlate of PA in adolescents (Kohl and Hobbs, 1998; Sallis et al., 2000). Parents and siblings may support PA by providing transportation and encouragement (Hoefer et al., 2001; Biddle and Goudas, 1996; McGuire et al., 2002; Felton et al., 2002), as well as by participating in PA with adolescents (Felton et al., 2002). Family support was a strong predictor of team sport participation and a modest predictor of moderate-to-vigorous PA in 8th grade girls in one study (Saunders et al., 2004), and a significant predictor of vigorous PA outside of school in 9th and 11th grade girls in another study (Zakarian et al., 1994). But, studies have also shown a decline in perceived social support in girls followed from 5th or 6th grade to 6th or 7th grade (Garcia et al., 1998), and little is known about changes in perceptions of family support during the transition to high school.
Although family support has been shown to be associated with PA in cross sectional studies (Saunders et al., 2004; Zakarian et al., 1994), little is known about changes in the perception of family support over time and its effects on physical activity over time in girls. As pointed out in a recent review, longitudinal studies can help to better understand the relationship between parental support and child PA (Gustafson and Rhodes, 2006. In addition little is known about the association of family support with psychosocial factors that have been shown to influence PA in girls, such as perceived behavioral control (Motl et al., 2005), attitudes (Dishman et al., 2004) and equipment accessibility (Motl et al., 2005). Therefore, the purpose of this study was to use growth curve analyses to understand how the influence of demographic variables, self-efficacy, perceived behavioral control, attitudes, availability of equipment, and perceived family support affect changes in PA over time in adolescent girls. PA and other variables were measured at 8th, 9th and 12th grades.
Methods
Participants
Participants were adolescent girls who completed a measurement protocol during 8th, 9th and 12th grades (1998–2003), as part of a large PA intervention study (Pate et al., 2005) which was based on social cognitive theory (Bandura, 1986). Overall, 2744 girls (average age 13.6 (0.6) years; 49.0% Black) completed the measurement protocol in 8th grade (Table 1). The same girls were invited to complete the protocol again in 9th and 12th grades. The study reported in this paper is based on the 421 girls who provided complete data on perceived family support and PA at the 8th, 9th, and 12th grade time points. This sample was the same age (13.6 (0.6) years) as the larger study sample and had similar means for total METs and BMI. The study sample had higher values for family support, self-efficacy, attitudes and sport equipment, and a higher percentage of girls were Black (58.4%), but effect sizes for differences were small.
Table 1.
Characteristics of 8th grade girls from South Carolina for those followed to 12th grade and those lost to follow-up (1998–2003)
| Characteristics | Lost to follow-up | Followed to 12th grade (n=421) | |||
|---|---|---|---|---|---|
| n | Mean (SD) or Percent | Mean (SD) or percent | p | Effect size‡ | |
| Age at baseline (years) | 2301 | 13.6 (0.7) | 13.6 (0.6) | 0.79 | .00 |
| BMI | 2021 | 23.1 (5.4) | 23.0 (5.3)† | 0.81 | .02 |
| Total METs | 2025 | 62.4 (11.2) | 62.7 (10.3) | 0.63 | .03 |
| Family support | 2140 | 1.7 (0.9) | 1.8 (0.9) | <0.01 | .11 |
| Self efficacy | 2143 | 3.8 (0.7) | 3.9 (0.7) | 0.01 | .14 |
| Attitudes | 2129 | 17.5 ( 3.2) | 18.1 (3.0) | <0.001 | .19 |
| Perceived behavioral control | 2141 | 4.1 (0.7) | 4.2 (0.6) | 0.12 | .15 |
| Sport equipment | 2143 | 4.2 (1.1) | 4.4 (1.0) | <0.01 | .18 |
| Black, % | 2727 | 49.5% | 58.4% | 0.001 | .07 |
| Control Group, % | 2301 | 44.5% | 44.4% | 0.99 | .00 |
n=398
Cohen’s d or Phi
Procedures
Trained data collectors administered the measures to participants in groups of 20–30 girls. The data collectors employed standardized protocols and scripts when administering the measures. The procedures were approved by the University of South Carolina Institutional Review Board. Each participant and her parent or guardian (girls <18 years) provided written informed consent.
Physical Activity
PA was assessed using the 3-Day Physical Activity Recall (3DPAR), which has been validated in 8th and 9th grade girls (Pate et al., 2003). The 3DPAR required participants to recall PA behavior from the previous 3 days, beginning with the most recent day. Subjects were asked to complete a grid divided into 30-minute time blocks, beginning at 7 am and ending at 12 midnight. A list of 55 activities grouped in categories of sleep/bathing, eating, work, after-school/spare-time/hobbies, transportation and physical activity/sports was provided and Girls were asked to enter their predominant activity in each 30-minute block. Data from each of the three years was reduced to total METs per day. MET values were obtained from the Compendium of Physical Activities (Ainsworth et al., 2000).
Perceived Family Support
Perceived family support was measured using five items that assessed the typical weekly frequency with which family members (adult female, adult male, other children) encouraged PA, participated in PA with the girl, provided transportation for PA, watched participation in PA, or told the girl that PA was good for her. A summary score was calculated by first averaging across family members and then across the five questions (Table 2) (Saunders et al., 2004).
Table 2.
Sample items from questionnaires, test-retest reliability and internal consistency for responses by girls from South Carolina (1998–2003)
| Question | Items (Range of sores) | 8th grade ICC (test- retest)* | Cronbach’s alpha | Sample Items | ||
|---|---|---|---|---|---|---|
| 8th | 9th | 12th | ||||
| Family Support | 5 (0–4) | 0.86 | 0.83 | 0.86 | 0.83 | During a typical week, how often has a member of your family encouraged you to do physical activity or sports
A. Male adult B. Female adult C. Other children 0=none to 4=Daily |
|
| ||||||
| Attitudes | 8 (1–25) | 0.72 | 0.63 | 0.67 | 0.61 |
Beliefs
If I were to be physically active on my free time on most days
1= Disagree a lot to 5= Agree a lot |
|
| ||||||
Values
1= Very bad to 5=Very good |
||||||
| Perceived behavioral control | 4 (1–6) | 0.89 | 0.61 | 0.75 | 0.78 |
1=Very easy to 6=Very Difficult |
| Self-efficacy | 8 (1–5) | 0.57 | 0.79 | 0.79 | 0.78 |
1=Disagree a lot to 5=Agree a lot |
The sample ranged from 45 to 76 for Intra-class correlation (ICC) for test-retest calculated by one-way ANOVA
Other Selected Correlates of PA
The psychometric properties of measures assessing PA attitudes, perceived behavioral control, and self-efficacy used in this study have been described previously (Dishman et al., 2002; Motl et al., 2000). Attitudes were measured using eight items that consisted of belief and corresponding value statements. The attitude items were formed as a product of the belief and corresponding value item scores and averaged (Ajzen, 1985). Perceived behavioral control was measured using four items. The items were reversed scored and averaged over the four items. A higher score reflects greater levels of perceived behavioral control. Self-efficacy was measured using eight items and were averaged. Example items of these scales are presented in Table 2. Sport/PA equipment was measured with one item that asked girls if they had enough supplies and pieces of equipment (e.g., balls, bicycles, skates) at home to use for PA. There were five responses, which ranged from 1=disagree a lot to 5=agree a lot.
Body Mass Index
Height was measured to the nearest 1.0 cm with a portable stadiometer, and weight was measured to the nearest 0.1 kg with a digital scale. A total of 382 of the girls had height and weight measure at all 3 times, 33 at two and 1 girl only at the 12th grade measure. Body mass index (BMI) was calculated (kg/meter2), and BMI percentile for sex and age were derived from the CDC growth charts (Centers for Disease Control and Prevention).
Socioeconomic Status
Parent education was used as a measure of socioeconomic status. The highest education reported for either parent when the girls were in the 12th grade was dichotomized into high school or less and greater than a high school education.
Statistical Analysis
Descriptive Statistics
Analyses were performed using SAS (version 8.2). Means (SE) and p-values from repeated measures ANOVA were calculated for total METs, BMI, BMI percentile, attitudes, self-efficacy, perceived behavioral control, sports equipment and family support for the three time points of the study. Pearson correlations between these variables and total METs and for family support with each of the other variables were calculated.
Growth Curve Analyses
Using Proc Mixed, growth curve analyses (Singer and Willett, 2003) (GCA) were used to study the longitudinal changes in total METs reported at 8th, 9th and 12th grade. Hierarchical linear models show growth over time by fitting the slope at the individual level (level 1). A second level (level 2) of analysis relates predictors to inter-individual differences in change. First, an unconditional growth model, which does not contain predictors, was fit to provide a baseline model for comparison. This model had an intercept which reflects the population mean for the initial status, a rate-of-change parameter and a residual term that represents the between-person variance. Then models with single predictors for demographic (group, race, parent education, BMI, BMI percentile) and psychosocial variables were calculated. Family support was entered as a continuous time varying variable as were BMI, BMI percentile, self-efficacy, perceived behavioral control, attitudes, and availability of sport/PA equipment. A model was then created with the significant predictors from previous models, and interactions between race and other variables were tested. Because time was not equally spaced it was coded as 0 (8-8), 1 (9-8) and 4 (12-8) years. Models with a single predictor were compared to the unconditional model (no predictors) by using deviance statistics (which compares log-likelihood) and Alkaike’s information criterion (AIC). Models with single predictors were compared to each other with Bayesian information criterion (BIC). Smaller values indicate better fit. To evaluate the relation of change in total METs with change in family support, correlations between standardized estimates of the slopes were calculated (AMOS 5, Stillwaters Corp, Chicago, IL).
Results
Sixty percent of the 421 girls followed from 8th to 12th grade had a parent with greater than a high school education, 44% were from control schools and 58% were black. Means (SE) for the study variables are shown in Table 3 for 8th, 9th, and 12th grades. Total METs and perceived family support, self-efficacy, reported sport equipment, and BMI percentile declined, while BMI increased, from 8th to 12th grade. There were significant correlations between family support and the other study variables, except BMI at all measurement periods (Table 4). Total METs was significantly correlated with attitudes, perceived behavioral control, self- efficacy and family support at all three measurement periods.
Table 3.
Means (SE) for study variables in 8th, 9th and 12th grades for girls from South Carolina (1998–2003)†
| Variable | 8th grade | 9th grade | 12th grade |
|---|---|---|---|
| Total METs | 63.0 (0.8) | 63.2 (0.8) | 61.8 (0.8)* |
| BMI | 23.0 (0.3)a | 23.7 (0.3)b | 25.2 (0.3)c*** |
| BMI Percentile | 69.9 (1.3)a | 69.8 (1.3)b | 66.6 (1.3)c* |
| Attitudes | 18.1 (0.2) | 18.1 (0.2) | 18.1 (0.2) |
| Perceived Behavioral Control | 4.2 (0.0) | 4.2 (0.0) | 4.0 (0.0)** |
| Self-Efficacy | 3.9 (0.0) | 3.8 (0.0) | 3.8 (0.0) |
| Sport Equipment | 4.4 (0.1) | 4.2 (0.1) | 3.8 (0.1)*** |
| Family Support | 1.8 (0.1) | 1.7 (0.1) | 1.3 (0.1)*** |
Proc mixed repeated measure ANOVA, controlling for group and with school nested in group as a random variable
n=398
n=413
n=417
9th and 12th grade differ, p<.10
8th and 9th grade both differ from 12th grade, p<.01
All differ, p<.05
Table 4.
Pearson correlations with study variables and family support and total METs by grade for girls from South Carolina (1998–2003)
| Variable | 8th | 9th | 12th |
|---|---|---|---|
| Correlations with Family Support | |||
| Total METs | 0.26*** | 0.23*** | 0.26*** |
| BMI | −0.02 | <0.01 | −0.03 |
| BMI percentile | <0.01 | 0.01 | 0.03 |
| Attitudes | 0.12* | 0.10* | 0.13* |
| Perceived Behavioral Control | 0.22*** | 0.23*** | 0.23*** |
| Self-Efficacy | 0.30*** | 0.23*** | 0.17** |
| Sport Equipment | 0.19*** | 0.09 | 0.07 |
| Correlations with Total METs | |||
| BMI | − 0.09* | −0.09* | <0.01 |
| BMI percentile | −0.09* | −0.07 | 0.02 |
| Attitudes | 0.22** | 0.30*** | 0.24*** |
| Perceived Behavioral Control | 0.29*** | 0.38*** | 0.17** |
| Self-Efficacy | 0.40*** | 0.46*** | 0.27*** |
| Sport Equipment | 0.24*** | 0.22*** | 0.19*** |
p<.10
p<.05
p<.10
Results of Growth Curve Analyses
Models for the GCA are presented in Table 5. The first model, an unconditional growth model (without predictors), indicates that the average initial total MET score is 63.1 and that there is a decrease each year of 0.37. The variance components of this model indicate that there was significant within-person variability (σ2=62.7) and between-person variability (σ2=41.7). The correlation between true initial status and true change was −0.34. This suggests that girls with higher MET scores at 8th grade had greater rates of decline in PA. Six models are then presented, each with a single significant predictor variable. Parent education, group (control or intervention), BMI and BMI percentile were not significant (not shown). Models indicate that girls who had higher values at 8th grade for perceived family support, perceived behavioral control, self-efficacy, attitudes or more sport equipment had higher total MET scores. The model with family support as a predictor was:
Table 5.
Growth curve models of total METs using full maximum-likelihood estimation for girls from South Carolina (1998–2003)
| Model 1 | Model 2 | Model 3 | Model 4 | Model 5 | Model 6 | Model 7 | Model 8 | |
|---|---|---|---|---|---|---|---|---|
| Predictors | Unconditional | Race | Family Support | Perceived Behavioral Control | Self-efficacy | Attitude | Sport Equipment | Final Model |
| Fixed Effects | ||||||||
| Intercept | 63.1**** (0.4) | 66.0**** (0.7) | 58.6**** (0.7) | 52.0**** (1.8) | 52.5**** (1.7) | 56.1**** (1.9) | 60.4**** (1.2) | 52.4**** (2.1) |
| Race | −5.1**** (0.9) | −4.3**** (0.8) | ||||||
| Family support | 2.4**** (0.3) | 1.8**** (0.3) | ||||||
| Perceived Behavioral Control | 2.7**** (0.4) | 1.5*** (0.5) | ||||||
| Self-Efficacy | 2.8**** (0.4) | 1.0** (0.5) | ||||||
| Attitude | 0.39*** (0.1) | |||||||
| Sport Equipment | 0.61** (0.3) | |||||||
| Rate of Change | ||||||||
| Intercept | −0.37** (0.16) | −0.94*** (0.3) | −.02 (0.2) | −.26 (0.2) | −0.34** (0.2) | −0.37** (0.2) | −0.29* (0.2) | −.59** (0.3) |
| Race | 0.98*** (0.3) | 1.0*** (0.3) | ||||||
| Variance Components (Random effects) Level 1 | ||||||||
| Within person | 62.7**** (4.3) | 62.7**** (4.3) | 63.9**** (4.4) | 63.2**** (4.4) | 63.8**** (4.4) | 62.5**** (4.3) | 63.5**** (4.4) | 63.8**** (4.4) |
| Level 2 | ||||||||
| In initial status | 41.7**** (6.4) | 35.4**** (6.0) | 33.7**** (6.0) | 36.4**** (6.1) | 33.5**** (6.0) | 40.5**** (6.3) | 39.7**** (6.4) | 25.9*** (5.5) |
| In rate of change | 3.9**** (0.9) | 3.7**** (0.9) | 3.4**** (0.9) | 4.0**** (0.9) | 3.8**** (0.9) | 3.9**** (0.9) | 4.0**** (0.9) | 3.2**** (0.9) |
| Covariance | −4.4** (1.9) | −3.2* (1.8) | −3.4* (1.8) | −4.7** (1.9) | −3.7** (1.8) | −4.4** (1.9) | −4.4** (1.9) | −2.4 (1.7) |
| Deviance | 9426.4 | 9392.9 | 9309.2 | 9332.8 | 9351.5 | 9371.7 | 9352.4 | 9253.8 |
| AIC | 9438.4 | 9408.9 | 9323.2 | 9345.8 | 9365.5 | 9385.7 | 9366.4 | 9275.8 |
| BIC | 9462.7 | 9441.2 | 9351.5 | 9374.1 | 9393.8 | 9413.9 | 9394.7 | 9320.2 |
Notes: Coefficients with standard errors in parentheses
p<.10
p<.05
p<.001
p<.001
and initial total METs ranged from 58.6 for 0 family support to 68.2 for family support of 4 with a decline of .02 per year. The correlation between the slopes of total METs and family support was 0.36 (AMOS, p<.001).
Compared to the unconditional model (Model 1) the difference in deviance was greatest for family support and least for attitudes. For the single predictor models, the model with family support had the lowest AIC and BIC and attitudes had the largest. Only race (1=Black, 0=White) had a significant interaction with time (Figure), showing total MET scores for White girls decreased while the scores for Black girls increased over time. The final model with multiple predictors was:
Figure.
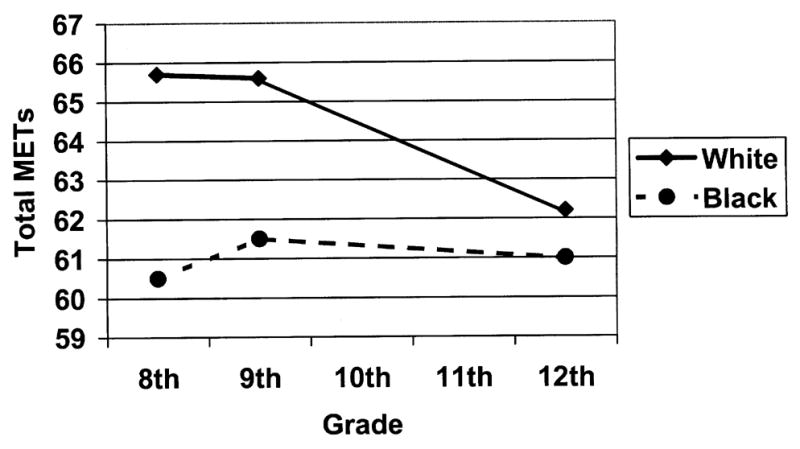
Total METs at 8th, 9th and 12th grade girls from South Carolina by race (1998–2003)
The correlation between slopes of total METs and family support in this adjusted model was 0.33 (AMOS, p<.001). Thus change in PA is significantly correlated with change in perceived family support, independent of race, perceived behavioral control, and self-efficacy.
Family support, self-efficacy and perceived behavioral control had significant positive relationships with changes in total METs, indicating that girls with higher values have higher total MET scores. To further explore the relationship, substitution of constant or varying values for family support were entered into the final model while values of perceived behavioral control and self-efficacy were held constant and are shown in Table 6. Total MET scores were higher for White as compared to Black girls. With maintenance of family support, total METs increased in black girls and decreased in white girls from 8th to 12th grades. An increase in family support was associated with an increase in total METs, while a decrease in family support was associated with a decrease in total METs from 8th to 12th grade.
Table 6.
Total METs for girls from South Carolina from final model with constant or changing level of family support over time, and fixed values of perceived behavioral control and self-efficacy (1998–2003)
| Family Support | Total METs | |||||
|---|---|---|---|---|---|---|
| Eighth grade | Ninth grade | Twelfth grade | Eighth grade | Ninth grade | Twelfth grade | |
| Family support | Black girls | |||||
| Remained low | 0.80 | 0.80 | 0.80 | 61.05 | 61.46 | 62.69 |
| Increased | 0.80 | 1.53 | 2.40 | 61.05 | 62.77 | 65.57 |
| Decreased | 2.40 | 1.53 | 0.80 | 63.93 | 62.77 | 62.69 |
| Remained high | 2.40 | 2.40 | 2.40 | 63.93 | 64.34 | 65.57 |
| White girls | ||||||
| Remained low | 0.80 | 0.80 | 0.80 | 65.35 | 64.76 | 62.99 |
| Increased | 0.80 | 1.53 | 2.40 | 65.35 | 66.07 | 65.87 |
| Decreased | 2.40 | 1.53 | 0.80 | 68.23 | 66.07 | 62.99 |
| Remained high | 2.40 | 2.40 | 2.40 | 68.23 | 67.64 | 65.87 |
Total METs= 52.4 −4.3 Race + 1.8 Family support + 1.5 perceived behavioral control + 1.0 Self-efficacy −0.59 Time + 1.0 Race*time.
Values for family support are pooled values over 3 time points (0.80=25th percentile, 1.53=50th percentile and 2.40=75th percentile), perceived behavioral control=4.75 (75th percentile of pooled values from 3 time points), and self-efficacy=4.38 (75th percentile of pooled values from 3 time points).
Race, 0=White, 1=Black
Discussion
This study was unique because longitudinal data from 8th through 12th grades were used to study the relationship between perceived parental support and decline in PA in girls. A unit change in family support was associated with an estimated 1/3 of a standard deviation change in PA (total METs). Perceived family support was independently related to total METs. Girls with higher values of perceived family support at the 8th grade measure had higher total MET scores at 12th grade regardless of their values for self-efficacy or perceived behavioral control. Leisure-time PA in girls declines significantly during adolescence (Kimm et al., 2002; CDC, 2004), as does participation on sports teams (CDC, 2004). Higher family support seems to attenuate the age-related decline in PA in adolescent girls. The findings of the present study suggest that perceived family support in the years prior to 12th grade may lay the foundation for maintaining an active lifestyle as girls move through adolescence into young adulthood.
Significant positive correlations of family support with self-efficacy and perceived behavioral control were observed at all three time points. Trost et al. (2003), in a study of 7th to 12th graders, used observed variable path analysis and structural equation modeling to show that family support acted directly and indirectly on PA through its influence on self-efficacy. In a similar study in 13–14 year-old youths (Biddle and Goudas, 1996), vigorous PA was predicted by both direct paths from adult encouragement and indirectly through perceived competence. These findings may help to explain the long-lasting effects of family support. Girls who have high levels of family support not only receive direct help in being active but also experience increased confidence as a result of support from their families.
White girls were more active than Black girls at each measurement period, but total METs declined in White girls and increased in Black girls from 8th to 12th grade. Two factors, time spent watching television and employment during non-school hours, may help to explain this trend. Black girls typically report more time watching television than White girls (CDC, 2004; Dowda et al., 2004) and the prevalence of watching television in both Black and White girls declines from 9th to 12th grade (CDC, 2004). In addition, U.S. Labor statistics show an age-related increase in the percentage of students who work during the school year, from 9.4% of fifteen year olds to 39.0% of seventeen year olds (U.S. Department of Labor, 2000). Therefore, given the likely decline in television viewing (a sedentary activity) and increase in employment during non-school hours (often involving light or moderate PA) (Pate et al., in press), it is not surprising that Black girls’ total MET scores would increase from 8th to 12th grade. On the other hand, for White girls, increased employment in 12th grade may have supplanted more VPA in 8th and 9th grades, resulting in lower overall MET scores in 12th grade.
PA interventions that include a family component may help to curb the decline in PA in high school girls, although the evidence on the effectiveness of family components is inconclusive (Kahn et al., 2002). Several small studies appear to have been more successful in increasing PA of youth by increasing family support (Neumark-Sztainer et al., 2003; Sääkslahti et al., 2004; Neumark-Sztainer et al., 2003; Jamner et al., 2004). It seems that direct contact with parents may help, but more research is needed to determine how to intervene to increase family support for children’s PA.
This study had several strengths. PA from multiple domains and psychosocial variables were measured at three time points. There were over 400 girls in the study and about equal numbers of Black and White girls. Girls lived in urban, suburban and rural areas of South Carolina, and there was a wide range in BMI of girls and parent education level. Information regarding number and ages of siblings was not collected in this study, which may have affected estimates of family support. For example if a sibling was of preschool age, he or she would not have been able to provide social support for physical activity in the same manner as a sibling of similar age or older. The use of a PA self-report instrument is a limitation of the study, although the 3DPAR has been validated versus accelerometry (Pate et al., 2003). Future studies should include boys and use an objective measure of physical activity.
In summary, total METs declined as study participants transitioned from 8th to 12th grade. Girls with higher perceived support in the 8th grade were more likely to have higher total METs in the 12th grade compared to girls who had lower perceived family support. Also, girls whose perceived family support declined experienced greater declines in total METs from 8th to 12th grade. Although White girls had higher total METs at each time point, total METs decreased in White girls and increased in Black girls. The changes in total METs were predicted by family support independent of self-efficacy and perceived behavioral control. The findings from the study emphasize that parents should encourage their children to accumulate physical activity through a wide range of activities that include sports, recreation, transportation, chores, work, planned exercise, and school-based PE-classes (Council on Sports Medicine and Fitness and Council on School Health, 2006). Also, interventions to increase family support should be considered when planning PA interventions in adolescent girls.
Acknowledgments
This study was funded by a grant from the National Institutes of Health (RO1HL057775). The authors thank LaVerne Shuler for capably administering the study and Gaye Groover Christmus, MPH for editing the manuscript.
Footnotes
This study was funded by a grant from the National Institutes of Health (RO1HL057775).
Precis
In a sample of over 400 girls, those who maintained higher perceptions of family support from 8th to 12th grades had lower declines in physical activity across the four years.
Publisher's Disclaimer: This is a PDF file of an unedited manuscript that has been accepted for publication. As a service to our customers we are providing this early version of the manuscript. The manuscript will undergo copyediting, typesetting, and review of the resulting proof before it is published in its final citable form. Please note that during the production process errors may be discovered which could affect the content, and all legal disclaimers that apply to the journal pertain.
Contributor Information
Marsha Dowda, Department of Exercise Science, Arnold School of Public Health, University of South Carolina, Columbia, South Carolina.
Rod K. Dishman, Department of Exercise Science, University of Georgia, Athens, Georgia.
Karin A. Pfeiffer, Department of Kinesiology, Michigan State University, East Lansing, MI.
Russell R. Pate, Department of Exercise Science, Arnold School of Public Health, University of South Carolina, Columbia, South Carolina.
References
- Ainsworth BE, Haskell WL, Whitt MC, Irwin ML, Swart AM, Strath SJ, et al. Compendium of physical activities: an update of activity codes and MET intensities. Med Sci Sports and Exerc. 2000;32(9):S489–S505. doi: 10.1097/00005768-200009001-00009. Suppl. [DOI] [PubMed] [Google Scholar]
- Ajzen I. From intentions to actions: A theory of planned behavior. In: Kuhl J, Beckman J, editors. Action-control: from cognition to behavior. New York: Springer; 1985. pp. 11–39. [Google Scholar]
- Bandura A. Social Foundations of Thought and Actions: A Social Cognitive Theory. Prentice Hall; Englewood Cliffs, NJ: 1986. [Google Scholar]
- Biddle S, Goudas M. Analysis of children’s physical activity and its association with adult exercise and encouragement and social cognitive variables. J Sch Health. 2002;66:75–78. doi: 10.1111/j.1746-1561.1996.tb07914.x. [DOI] [PubMed] [Google Scholar]
- Booth ML, Chey T, Wake M, Norton K, Hesketh K, Dollman J, Robertson In the prevalence of overweight and obesity among young Australians, 1969–1997, Am. J Con Nutr. 2003;77:29–36. doi: 10.1093/ajcn/77.1.29. [DOI] [PubMed] [Google Scholar]
- Council on Sports Medicine Fitness and Council on School Health. Active healthy living: Prevention of childhood obesity through increased physical activity. Pediatrics. 2006;117:1834–1842. doi: 10.1542/peds.2006-0472. [DOI] [PubMed] [Google Scholar]
- Centers for Disease Control and Prevention. 2000 CDC Growth Charts- SAS program for the CDC growth charts. http://www.cdc.gov/nccdphp/dnpa/growthcharts/sas.htm.
- Centers for Disease Control Prevention. Youth Risk Behavior Surveillance -- United States. MMWR. 2004;2003;53(SS02):1–96. [Google Scholar]
- Dishman RK, Motl RW, Saunders R, Felton G, Ward DS, Dowda M, Pate RR. Self-efficacy partially mediates the effect of a school- based physical-activity intervention among adolescent girls. Prev Med. 2004;38:628–636. doi: 10.1016/j.ypmed.2003.12.007. [DOI] [PubMed] [Google Scholar]
- Dishman RK, Motl RW, Saunders RP, Dowda M, Felton G, Ward DS, Pate RR. Factorial invariance and latent mean structure of questionnaires measuring social-cognitive determinants of physical activity among Black and White adolescent girls. Prev Med. 2002;34:100–108. doi: 10.1006/pmed.2001.0959. [DOI] [PubMed] [Google Scholar]
- Dowda M, Pate RR, Felton GM, Saunders R, Ward DS, Dishman RK, Trost SG. Physical activities and sedentary pursuits in African American and Caucasian girls. Res Q Exerc Sport. 2004;75:352–360. doi: 10.1080/02701367.2004.10609168. [DOI] [PubMed] [Google Scholar]
- Felton GM, Dowda M, Ward DS, Dishman RK, Trost SG, Saunders R, Pate RR. Differences in physical activity between black and White girls living in rural and urban areas. J Sch Health. 2002;72:250–255. doi: 10.1111/j.1746-1561.2002.tb07338.x. [DOI] [PubMed] [Google Scholar]
- Frye C, Heinrich J. Trends and predictors of overweight and obesity in East German children. Int J Obes. 2003;27:3–969. doi: 10.1038/sj.ijo.0802321. [DOI] [PubMed] [Google Scholar]
- Garcia AW, Pender NJ, Antonakos CL, Ronis DL. Changes in PA beliefs and behaviors of boys and girls across the transition to junior high school. J Adolesc Health. 1998;22:394–402. doi: 10.1016/s1054-139x(97)00259-0. [DOI] [PubMed] [Google Scholar]
- Gustafson SL, Rhodes RE. Parental correlates of physical activity in children and early adolescents. Sports Med. 2006;36:79–97. doi: 10.2165/00007256-200636010-00006. [DOI] [PubMed] [Google Scholar]
- Hoefer WR, McKenzier TL, Sallis JF, Marshall SJ, Conway TL. Parental provision of transportation for adolescent activity. Am J Prev Med. 21:48–51. doi: 10.1016/s0749-3797(01)00314-2. [DOI] [PubMed] [Google Scholar]
- Jamner MS, Spruijt-Metz D, Bassin S, Cooper DM. A controlled evaluation of school-based intervention to promote physical activity among sedentary adolescent females: Project FAB. J Adolesc Health. 2004;34:279– 289. doi: 10.1016/j.jadohealth.2003.06.003. [DOI] [PubMed] [Google Scholar]
- Jolliffe D. Extent of overweight among US children and adolescents from 1971 to 2000. Int J Obes. 2004;28:4–9. doi: 10.1038/sj.ijo.0802421. [DOI] [PubMed] [Google Scholar]
- Kahn EB, Ramsey LT, Brownson RC, Heath GW, et al. The effectiveness of interventions to increase physical activity: a systematic review. Am J Prev Med. 2002;22 (4S):73–107. doi: 10.1016/s0749-3797(02)00434-8. [DOI] [PubMed] [Google Scholar]
- Kimm SY, Glynn NW, Kriska AM, Barton BA, Kronsberg SS, Daniels SR, et al. Decline in PA in Black and White girls during adolescence. N Eng J Med. 2002;347:709–715. doi: 10.1056/NEJMoa003277. [DOI] [PubMed] [Google Scholar]
- Kimm SY, Glynn NW, Obarzanek E, Kriska AM, Daniels SR, Barton RA, Liu K. Relation between the changes in physical activity and body-mass index during adolescence: a multicentre longitudinal study. Lancet. 2005;366(9482):301–307. doi: 10.1016/S0140-6736(05)66837-7. [DOI] [PubMed] [Google Scholar]
- Kohl HW, Hobbs KE. Development of physical activity among children and adolescents. Pediatrics. 1998;101:549–554. [PubMed] [Google Scholar]
- McGuire MT, Hannan PJ, Neumark-Sztainer D, Crossrow NH, Story M. Parental correlates of physical activity in a racially/ethnically diverse adolescent sample. J Adolesc Health. 2002;30:253–261. doi: 10.1016/s1054-139x(01)00392-5. [DOI] [PubMed] [Google Scholar]
- Motl RW, Dishman RK, Trost SG, Saunders RP, Dowda M, Felton G, et al. Factorial validity and invariance of questionnaires measuring social-cognitive determinants of physical activity in adolescent girls. Prev Med. 2000;31:584–594. doi: 10.1006/pmed.2000.0735. [DOI] [PubMed] [Google Scholar]
- Motl RW, Dishman RK, Ward DS, Saunders RP, Dowda M, Pate RR, Felton G. Perceived physical environment and physical activity across one- year among adolescent girls: Self-efficacy as possible mediator? J Adolesc Health. 2005;37:403–408. doi: 10.1016/j.jadohealth.2004.10.004. [DOI] [PubMed] [Google Scholar]
- Motl RW, Dishman RK, Ward DS, Saunders RP, Dowda M, Felton G, Pate RR. Examining social-cognitive determinants of intention and physical activity among Black and White adolescent girls using structural equation modeling. Health Psychol. 2002;21:459–467. [PubMed] [Google Scholar]
- Murray DM. Design and analysis of group-randomized trials. New York: Oxford University Press; 1998. [Google Scholar]
- Neumark-Sztainer D, Story M, Hannan PJ, Rex J. New Moves: a school-based obesity prevention program for adolescent girls. Prev Med. 2003;37:41–51. doi: 10.1016/s0091-7435(03)00057-4. [DOI] [PubMed] [Google Scholar]
- Neumark-Sztainer D, Story M, Hannan PJ, Tharp T, Rex J. Factors associated with changes in physical activity: A cohort study of inactive adolescent girls. Arch Pediatr Adolesc Med. 2003;157:803–810. doi: 10.1001/archpedi.157.8.803. [DOI] [PubMed] [Google Scholar]
- Ogden CL, Carroll MD, Curtin LR, McDowell MA, Tabak CJ, Flegal KM. Prevalence of overweight and obesity in the United States. 1999–2004. JAMA. 295:1549–1555. doi: 10.1001/jama.295.13.1549. [DOI] [PubMed] [Google Scholar]
- Pate RR, Dowda M, O’Neill JR, Ward DS. Journal of Physical Activity & Health. Change in physical activity in participation among adolescent girls from 8th to 12th grade. In Press. [DOI] [PubMed] [Google Scholar]
- Pate RR, Ross R, Dowda M, Trost SG, Sirard JR. Validation of a 3-day physical activity recall instrument in female youth. Pediatr Exerc Sci. 2003;15:257–265. [Google Scholar]
- Pate RR, Ward DS, Saunders RP, Felton G, Dishman R, Dowda M. Promotion of physical activity among high-school girls: A randomized controlled trial. Am J Pub Health. 2005;95:1582–1587. doi: 10.2105/AJPH.2004.045807. [DOI] [PMC free article] [PubMed] [Google Scholar]
- Reilly JJ, Dorosty AR. Epidemic of obesity in UK children. Lancet. 1999;354:1874–1875. doi: 10.1016/S0140-6736(99)04555-9. [DOI] [PubMed] [Google Scholar]
- Sääkslahti A, Numminen P, Salo P, Tuominen J, Helenius H, Välimäki I. Effects of a three-year intervention on children’s physical activity from age 4 to 7. Ped Exerc Sci. 2004;16:167–180. [Google Scholar]
- Sallis JF, Prochaska JJ, Taylor WC. A review of correlates of physical activity of children and adolescents. Med Sci Sports Exerc. 2001;32:963–975. doi: 10.1097/00005768-200005000-00014. [DOI] [PubMed] [Google Scholar]
- Saunders RP, Motl RW, Dowda M, Dishman RK, Pate RR. Comparison of social variables for understanding physical activity in adolescent girls. Am J Health Behav. 2004;28:426–436. doi: 10.5993/ajhb.28.5.5. [DOI] [PubMed] [Google Scholar]
- Singer JD, Willett JB. Modeling change and event occurrence. New York: Oxford University Press; 2003. Applied longitudinal data analysis. [Google Scholar]
- Trost SG, Sallis JF, Pate RR, Freedson PS, Taylor WC, Dowda M. Evaluating a model of parental influence on youth physical activity. m J Prev Med. 2003;25:277–282. doi: 10.1016/s0749-3797(03)00217-4. [DOI] [PubMed] [Google Scholar]
- U.S. Department of Labor. Report on the Youth Labor Force. 2000:40. URL: http://www.bls.gov/pub/rylf/rylfhome.htm.
- Zakarian JM, Hovell MF, Hofsetter CR, Sallis JF, Keating KJ. Correlates of vigorous exercise in a predominantly low SES and minority high school population. Prev Med. 1994;23:314–324. doi: 10.1006/pmed.1994.1044. [DOI] [PubMed] [Google Scholar]