

Abstract
The purpose of the present study was to examine the time course of race and expression processing to determine how these cues influence early perceptual as well as explicit categorization judgments. Despite their importance in social perception, little research has examined how social category information and emotional expression are processed over time. Moreover, although models of face processing suggest that the two cues should be processed independently, this has rarely been directly examined. Event-related brain potentials were recorded as participants made race and emotion categorization judgments of Black and White men posing either happy, angry, or neutral expressions. Our findings support that processing of race and emotion cues occur independently and in parallel, relatively early in processing.
Faces convey important social information that is useful for a variety of inferences. For instance, information about racial group membership and emotional expression can be informative about an individual’s likely traits, attributes, and behavioral intentions (Bodenhausen & Macrae, 1998; Brewer, 1988; Devine, 1989; Fiske, Lin, & Neuberg, 1999), and perhaps not surprisingly, extensive research has documented our ability to quickly and efficiently extract both types of information from faces (Eimer & Holmes, 2002; Eimer, Holmes, & McGlone, 2003; Felmingham, Bryant, & Gordon, 2003; Holmes, Vuilleumeir, & Eimer, 2003; James, Johnstone, & Hayward, 2001; Ito, Thompson, & Cacioppo, 2004; Ito & Urland, 2003, 2005; Schupp, Junghöfer, Weike, & Hamm, 2003; Schupp, Ohman, Junghöfer, Weike, Stockburger, & Hamm, 2004; Vanderploeg, Brown, & Marsh, 1987). While it is possible to consider how individual sources of information affect social inferences, such as how race affects evaluations, it is also important to consider the more naturalistic question of how multiple sources of social information are processed from faces. That is, we can consider how both race and emotion information are processed from the same face.
Models of face processing suggest that information about social identity and emotional expression are processed separately and in parallel (Bruce & Young, 1986; Haxby, Hoffman, & Gobbini, 2000). According to Bruce and Young (1986), social category information such as age and gender and information regarding emotional expression are processed by functionally separate components of the face perception system. Moreover, these separable components are assumed to operate in parallel (see also Mouchetant-Rostaing & Giard, 2003), suggesting little interaction between the two types of information, at least in initial stages of perception. Haxby et al. (2000) have similarly argued that the perception of invariant, relatively unchangeable aspects of a face, which would presumably include social category information, are theoretically and neurally dissociable from the perception of changeable aspects of a face such as facial expressions. However, despite the theoretical importance of this issue, little research has simultaneously examined the perception of race and expression. Instead, the majority of previous research has examined these cues in isolation, independent of one another; research on race perception typically examines responses to faces with emotionally neutral expressions (e.g., Devine, Plant, Amodio, Harmon-Jones, & Vance, 2002; Levin, 2000; Greenwald & Banaji, 1995), and research on emotional expression often examines responses to faces depicting only one race (typically Caucasian) (e.g., Eimer, Holmes, & McGlone, 2003; Hansen & Hansen, 1988). While it is necessary to investigate the independent effects of these cues, they are typically perceived simultaneously, making it important to understand how the cues are perceived in combination throughout processing.
Our purpose in the present study was therefore to examine how both race and expression information are processed from the same face. In addition, we wished to examine the time course of race and emotion processing. The development of increasingly sophisticated social cognition and neuroscience methods has allowed social psychologists to obtain more precise information about the timing and ordering of social perception processes. This research tells us that what may be considered a single outcome (“face perception”) is likely composed of numerous, theoretically separate processes (Haxby et al., 2000). Using measures with sensitive time course information allows us to examine not only how race and expression information are processed, but also how this unfolds over time, starting with early perceptual processes and ending with explicit race and expression categorization judgments.
The importance of examining time course information is highlighted by recent research demonstrating interactive effects between race and emotion information in explicit categorization judgments. Hugenberg and Bodenhausen (2003, 2004) have found both that facial expressions influence racial categorization of racially-ambiguous faces and that race influences emotion perception of emotionally-ambiguous faces. Specifically, consistent with cultural stereotypes linking Blacks with more negative attributes, especially with aspects related to hostility and threat, White participants higher in implicit prejudice were more likely to categorize racially-ambiguous faces as African American when the face displayed an angry expression as opposed to a happy expression (Hugenberg & Bodenhausen, 2003). Similarly, White individuals high in implicit prejudice more readily perceived anger than happiness in the faces of unambiguous Black but not White faces (Hugenberg & Bodenhausen, 2004). Moreover, when categorizing by facial expression, participants respond more quickly to angry and sad facial expressions than happy expressions for Black targets, both of which are affectively-congruent with negative evaluations, but respond more quickly for happy facial expressions for White targets (Hugenberg, 2005). These effects differ from those predicted by face processing models. This may be accounted for by the type of response considered. Face processing models treating race and expression processing as independent are generally interpreted as referring to relatively early stages of perception whereas Hugenberg and Bodenhausen measured explicit, self-reported response. The difference in the pattern of results and type of responses considered suggests the importance of examining a wider time course of responding in order to determine if the likelihood of interactions among race and expression information differs as a function of type of response assessed.
In addition, it is worth noting that the interactive effects just discussed were obtained in situations where one of the cues was ambiguous, and/or with somewhat atypical-looking faces generated from animation software. This raises the question of whether interactive effects among types of facial information are more likely when cues are ambiguous and/or novel, or whether they occur more broadly and should therefore also be expected when perceiving actual faces with unambiguous race and facial expressions. We will examine this in the present study by investigating the simultaneous perception of race and expression information when both are relatively easy to perceive.
Investigating the Time Course of Social Perception
Investigating the time course of social perception requires a measure that has both high temporal resolution and is known to be sensitive to different psychological processes that may occur during the perception of race and expression. Event-related brain potentials (ERPs) are particularly well suited for this. ERPs utilize high sampling rates to record electrical brain activity that can index early attentional and perceptual processing across time. ERP waveforms are comprised of distinguishable components, some negative going and some positive going, that occur at a particular latency and over particular scalp sites. Individual components are thought to reflect different psychological processes, and multiple components are typically elicited by the same stimulus, allowing for the measurement of multiple responses that unfold over time to the same stimulus. In particular, component amplitude is thought to reflect the degree to which the psychological process associated with the individual component has been engaged and component latency is thought to reflect the point in time by which the psychological operation has been completed.
ERP Components Relevant to Race and Expression Perception
We focus on four particular ERP components of relevance to the perception of race and expression. These components provide a basis for examining sensitivity to race and expression information from faces across time. Past research suggests that some of the earliest components sensitive to race and expression information -- including the N100, a negative deflection occurring around 100 ms after stimulus onset, and the P200, a positive deflection occurring around 200 ms -- may reflect orienting to threatening and/or distinctive stimuli. At the N100, threatening primes elicit more attention (i.e. larger amplitudes) than positive primes (Weinstein, 1995); in a passive viewing task, angry faces elicit larger amplitudes than neutral faces (Felmingham, Bryant, & Gordon, 2003), and Black faces elicit larger amplitudes than White faces from White participants (Ito & Urland, 2003, 2005). A similar pattern of results are obtained for drawings of faces, where negative expressions elicit larger amplitudes at the N100 than happy expressions (Vanderploeg, Brown, & Marsh, 1987). Previous research on the P200 has obtained a similar pattern of results, with larger P200s to angry and fearful facial expressions than to neutral facial expressions (Eimer & Holmes, 2002; Eimer, Holmes, & McGlone, 2003), and larger P200s to Blacks than Whites from White participants (Ito & Urland, 2003, 2005).
These findings of greater attention to more threatening and/or more distinctive and novel stimuli may reflect an automatic vigilance effect in which attention is quickly and relatively automatically directed to stimuli with potentially negative implications for the self (Carretié, Mercado, Tapia, & Hinojosa, 2001). We expect to replicate past effects showing greater attention and larger N100s and P200s to angry as compared to happy and neutral expressions (cf., Eimer & Holmes, 2002; Eimer, Holmes, & McGlone, 2003; Felmingham, Bryant, & Gordon, 2003; Vanderploeg, Brown, & Marsh, 1987); similarly, Black faces should elicit greater attention and therefore larger N100s and P200s than White faces from the largely non-White participants in the present sample (Ito & Urland, 2003, 2005). We will also examine whether these cues are processed in parallel, or appear to interact at this point in time in order to examine assumptions that race and expression are processed independently.
Slightly later in processing, the N200, a negative deflection occurring at approximately 250 ms, has similarly been broadly associated with selective attention, but in the context of person perception, N200 amplitude has been more specifically associated with deeper processing of faces participants might benefit from individuating or have practice individuating. For instance, N200s are larger to pictures of one’s own face than to other’s faces (Tanaka, Curran, Porterfield, & Collins, 2005), and to famous as compared with unfamiliar faces (Bentin & Deouell, 2000). In the case of expression and race, although automatic vigilance mechanisms make it adaptive to initially devote greater attentional resources to angry faces and faces of racial outgroup members (as reflected in the N100 and P200), individuals with positive or neutral expressions, and those who are racial ingroup members are probably more desirable for greater individuation. Consequently, this component is typically larger to neutral than fearful faces (Eimer & Holmes, 2002; Holmes, Vuilleumeir, & Eimer, 2003) and to faces of one’s own race than other races (Ito, Thompson, & Cacioppo, 2004; Ito & Urland, 2003; James, Johnstone, & Hayward, 2001; Tanaka, Kiefer, & Bukach, 2004; Walker & Tanaka, 2003). For the N200, individuation and deeper processing predict larger N200s to faces displaying happy, approachable expressions and to Whites (cf., Holmes et al., 2003; Ito & Urland, 2003; James et al., 2001; Tanaka et al., 2004; Walker & Tanaka, 2003). And again, we are interested in whether race and facial expression interact at the N200.
A final component typically measured when investigating affect is the P300, a positive deflection occurring after 300 ms. This component is often conceptualized as indexing attention to motivationally relevant stimuli or stimuli that are highly arousing. Typically, this takes the form of larger amplitudes to emotionally-valenced stimuli (Dolcos & Cabeza, 2002; Eimer, Holmes, & McGlone, 2003). When utilizing faces, fearful faces have elicited larger P300s than neutral faces (Eimer & Holmes, 2002; Holmes et al., 2003) but angry faces have also elicited larger P300s than both happy and neutral facial expressions (Schupp, et al., 2003, 2004) which may reflect the greater arousal associated with viewing angry compared with happy expressions. Past P300 research showing larger responses to more arousing stimuli predicts larger P300s to angry expressions. This component has not been examined for race perception using the type of paradigm we employ here, but findings of larger P300s to more arousing stimuli may predict larger P300s to racial outgroups members.1 As with the other components, we will assess whether the two types of cues combine to affect the P300.
In addition to ERP responses, we also recorded response latencies as participants made explicit race and emotion categorizations in order to obtain a behavioral indication of whether race and emotion influence each other. Predicted results can be generated from several lines of research. Research on emotion perception has found faster categorization of happy than angry facial expressions (Eimer, Holmes, & McGlone, 2003; see Leppänen & Hietanen, 2003, for a review). This is thought to occur because happy faces have a higher base rate and are therefore more familiar and easier to categorize (Beaupré & Hess, 2003). Happy expressions may also be more discriminable than negative expressions because the latter are more similar to each other in featural arrangement (Johnston, Katsikitis, & Carr, 2001). An extensive body of research also shows faster categorization of and greater attentional capture by Black than White faces (e.g., Levin, 2000; Stroessner, 1996), predicting faster responses to Black than White faces. Combining these two effects predicts the fastest responses to happy Black faces. However, as noted earlier, Hugenberg (2005) found evaluative congruency effects in emotion categorization response times such that responses were fastest to Black faces displaying negative expressions and to White faces displaying happy expressions. The addition of a race categorization task will allow us to assess whether a similar evaluative congruency effect occurs in this type of categorizing.
A final purpose of the study was to examine whether any effects obtained during the categorization of race and emotion are due to race and emotion cues per se or to low-level perceptual features that may covary with race and expression. We did this by recording ERP as participants viewed face images that were both inverted and blurred, thereby preserving perceptual features such as color and luminance but leaving them unrecognizable as faces.
Methods
Participants
Thirty undergraduates (15 male, 15 female) from the University of Colorado-Boulder participated for course credit. One participant was excluded from data analyses because he incorrectly responded every time to two types of trials. Thus, analyses were based on data from 29 participants. Participant’s ages ranged from 18 to 28 (Mage=19.69) and the sample was primarily Caucasian2 (26 White/Caucasian, 2 Hispanic/Mexican American, and 1 Cuban).
Materials
Color photos were collected from a metropolitan college and university in Colorado from 23 Black males and 25 White males, each posing three facial expressions (happy, angry, and neutral), in accordance with Ekman and Friesen’s (1975) guidelines. Participants gave written consent to have their pictures used in research and were paid $5.00. Each pose was taken from a frontal orientation.
Twenty-one pilot participants rated the pictures for attractiveness on a 1 to 9 Likert scale (1=Very Unattractive to 9=Very Attractive). Participants also categorized the facial expression in each photo from the options of Happy, Sad, Angry, Disgusted, Surprised, Fearful, Threatening, and Neutral, then judged the intensity of the chosen facial expression on a 1 to 9 Likert scale (1=Low Intensity to 9=High Intensity). In addition, participants categorized the ethnicity of each face from the options of African American/Black, Asian American, Hispanic/Latino, White/Caucasian, and Other, then rated their confidence in their chosen option on a 1 to 9 Likert scale (1=Not At All Confident to 9=Very Confident). Angry faces selected for the main experiment were categorized as angry or threatening by the majority of participants (MBlack=80.79% of participants classified the face as angry or threatening and MWhite=82.18% of participants classified the face as angry or threatening) and rated as above the mean in intensity (MBlack=5.98 and MWhite=6.09). The happy (MBlack=97.83% and MWhite=98.43%) and neutral (MBlack=79.60% and MWhite=71.85%) photos for these same individuals were then examined to ensure high agreement in the emotion displayed and high intensity ratings for the happy expressions (MBlack=6.95 and MWhite=6.93). Based on these criteria, 10 Black and 10 White individuals, each posing a happy, angry, and neutral expression, were selected. Selected happy facial expressions were rated as significantly more intense than the angry expressions (F(1,36)=13.95, p<.01, Mangry=6.03 and Mhappy=6.94). However, it is important to note that there were no significant differences in the mean intensity ratings between each race, nor were there any significant differences between mean attractiveness ratings for Black and White faces.
Procedure
Upon arrival, participants were seated and asked to read and sign a consent form. After a brief description of the ERP setup process and the experiment, participants were fitted for ERP recording. The study was described as an investigation of brain activity when people view faces of different races making facial expressions. All participants completed two main blocks of trials, performing either a race or emotion categorization task, where they were instructed to be as fast and accurate as possible. Each trial began with a fixation cross for 250 ms followed by a face for 750 ms terminated by an inter-trial interval (ITI) of either 1000 ms or 1500 ms. Participants could respond any time during the photo or ITI. The ITI was randomized to help maintain participants’ attention by varying the presentation of the next picture. Participants were instructed to press buttons labeled Black or White or Angry, Neutral, or Happy in the race and emotion tasks, respectively. There was no time limit for responding. All pictures were sized to 640×480 and displayed in millions of colors. Block order was randomized and the response labels were counterbalanced across participants; however, neutral was always the center response button in the emotion categorization task. The experiment consisted of 240 randomized trials within each block. Each face was shown four times in each block for a total of 40 trials in each cell constituting a 2 (Race: Black, White) × 3 (Facial Expression: Happy, Angry, Neutral) × 2 (Task: Race Categorization, Emotion Categorization) × 2 (Block Order) mixed model design, with all but the last factor manipulated within subjects.
To assess whether any obtained ERP and behavioral effects in the first two blocks were due to low-level perceptual features rather than race and emotion effects per se, participants also completed a spatial location task involving blurred stimuli following the race and emotion categorization tasks. For this task, the neutral expression Black and White faces were inverted and blurred with a Gaussian blur at 24.3 pixels per radius. This preserved the perceptual features of the stimuli such as color and luminance but rendered them unrecognizable as faces. Also included as control stimuli in this block were five pictures each of cat and dog faces inverted and blurred in a similar fashion. Pictures were sized to 640×480 and displayed in millions of colors. No mention was made of the face nature of the stimuli. The task was instead presented as a spatial processing task, with participants asked to judge whether the picture was right or left of the fixation cross that began the trial, responding via button press either right or left. The fixation cross was presented for 250 ms, followed by a blurred image for 750 ms regardless of response, and then by an ITI beginning after their response and varying in length from 1000 ms to 1500 ms. Again, participants could respond any time after the presentation of the face or during the ITI. All participants completed this task last and it consisted of 120 trials, 20 per cell, with each face type presented right and left of fixation 2 times. Following the completion of the task, sensors were removed while the participants were debriefed and thanked.
ERP Recording and Component Processing
ERP data were recorded from 28 tin electrodes embedded in a stretch-lycra cap (Electro-Cap International, Eaton, OH), positioned according to the 10–20 international system (Jasper, 1958). The ground electrode was mounted in the cap on the midline between the frontal pole and the frontal site. Tin electrodes were also placed over the left and right mastoid, with scalp data referenced online to the left mastoid. To assess vertical eye movements, electrodes were placed on the supra- and sub-orbit of the left eye. To assess horizontal eye movements, electrodes were placed on the outer canthi of the left and right eyes. Electrode impedances were below 10 KΩ. Electrode gel (Eaton, OH) was used as the conducting medium for all electrodes. ERP recordings were amplified with a gain of 500 by NeuroScan Synampes (Sterling, VA), with a bandpass of .15–30 Hz, and digitized at 1000 Hz. Offline, data were re-referenced to a computed average of the left and right mastoids.
The ERP data were submitted to a regression procedure for correction of eyeblink artifact. Epochs were then created starting at 100 ms pre-stimulus onset and continuing for 1000 ms after stimulus onset and baseline corrected to the mean voltage of the pre-stimulus period. Each trial was then visually inspected for remaining blink or muscle artifact. When artifact was detected the trial was removed from analyses.
For the race and emotion categorization tasks, waveforms derived from correct trials were then averaged for each participant for the six trial types in each block. Looking across both blocks, four distinct deflections were revealed from visual inspection of the averages (Figure 1 & 2): the N100 (M=124 ms), P200 (M=174 ms), N2003 (M=249 ms), and P300 (M=445 ms). Peak component amplitudes and latencies were scored for each participant in each condition at 10 scalp sites (F3, Fz, F4, C3, Cz, C4, P3, Pz, P4, and Oz) by locating the maximal negative deflections between 70–170 ms (N100) and 200–300 ms (N200) and the maximal peak positive deflections between 120–220 ms (P200) and 270–570 ms (P300). Preliminary analyses found similar effects at midline and lateral scalp sites. Additionally, similar effects were found when Participant Gender and Block Order4 were included as predictors; therefore, for ease of presentation, results are presented for only the midline sites Fz, Cz, and Pz (where the components were maximal) and omitting Participant Gender and Block Order. These components were analyzed with separate 2 (Race: Black, White) × 3 (Facial Expression: Happy, Angry, Neutral) × 2 (Task: Race Categorization, Emotion Categorization) × 3 (Sagittal Site: Frontal, Central, Parietal) repeated measures mixed model GLMs. All effects for each model with more than one degree of freedom were evaluated using a Greenhouse-Geisser (1959) correction although uncorrected degrees-of-freedom for these contrasts are reported in the text (Jennings, 1987).
Figure 1.
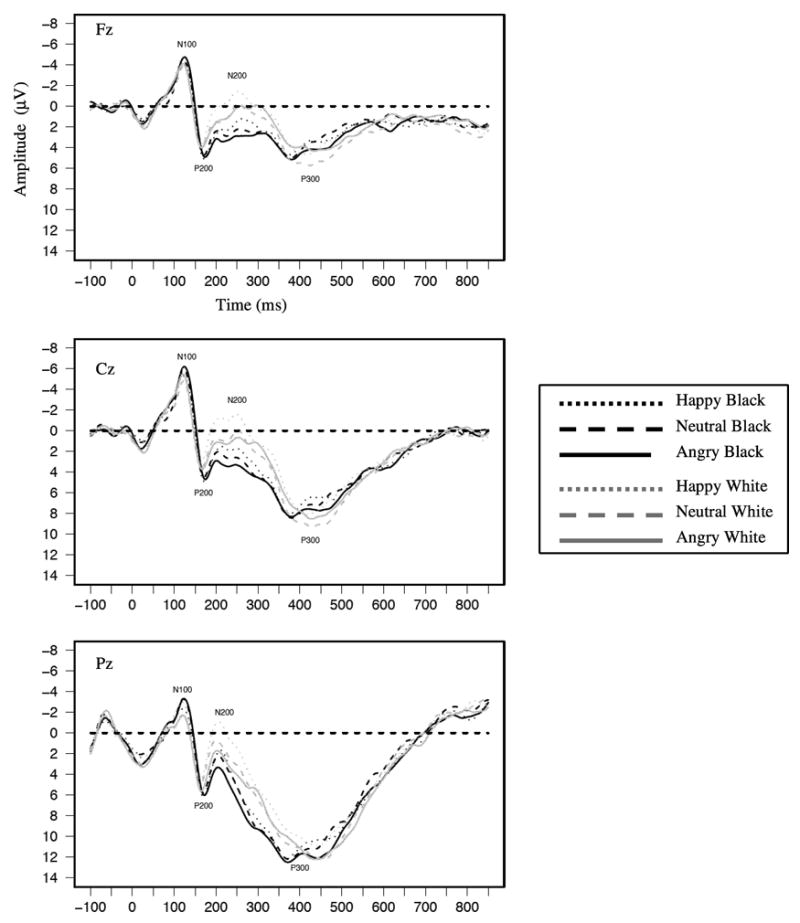
Grand average waveforms as a function of target race and emotion for the race task shown separately at Fz, Cz, and Pz.
Figure 2.
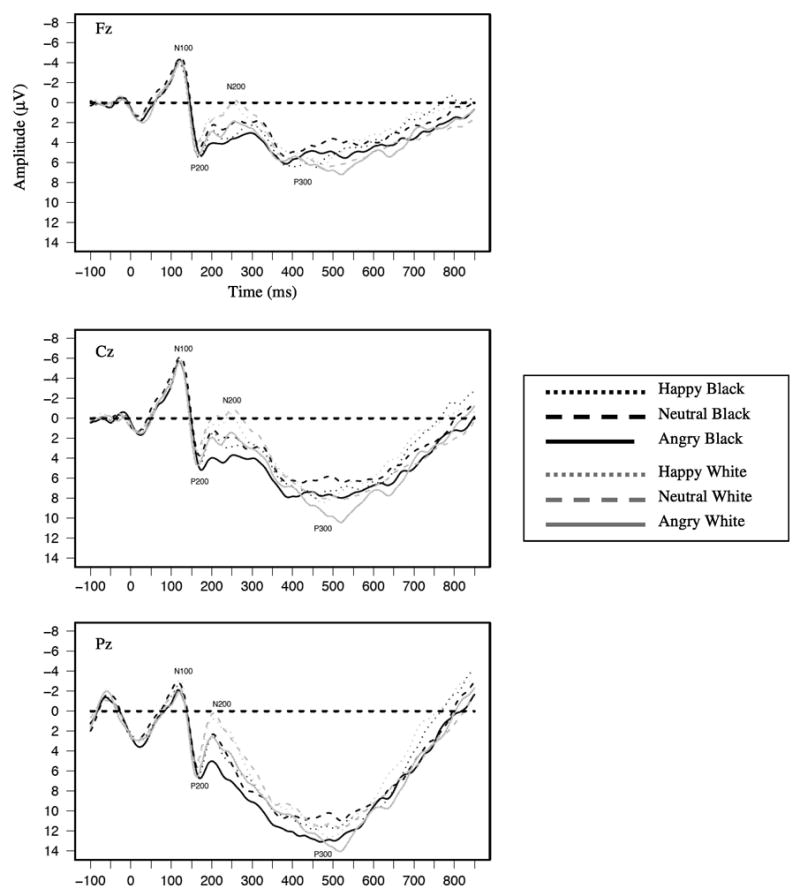
Grand average waveforms as a function of target race and emotion for the emotion task shown separately at Fz, Cz, and Pz.
ERP waveforms in the spatial location task were quite different, showing only two distinct deflections (Figure 3): the N100 (M=143 ms) and the P300 (M=294 ms). These components’ amplitudes were scored as the maximal peak negative deflection between 70–190 ms (N100) and at the maximal peak positive deflection between 270–570 ms (P300). The latency window for the N100 was lengthened slightly because the average latency of this component was slightly longer in this task. Similar to the race and emotion task, preliminary analyses found similar effects at midline and lateral scalp sites and when Participant Gender was added as predictors; therefore, results are presented for the midline sites (Fz, Cz, and Pz) with Participant Gender omitted. The N100 and P300 were analyzed separately using 3 (Type of Face: Black, White, Pet) × 3 (Sagittal Site: Frontal, Central, Parietal) GLMs.
Figure 3.
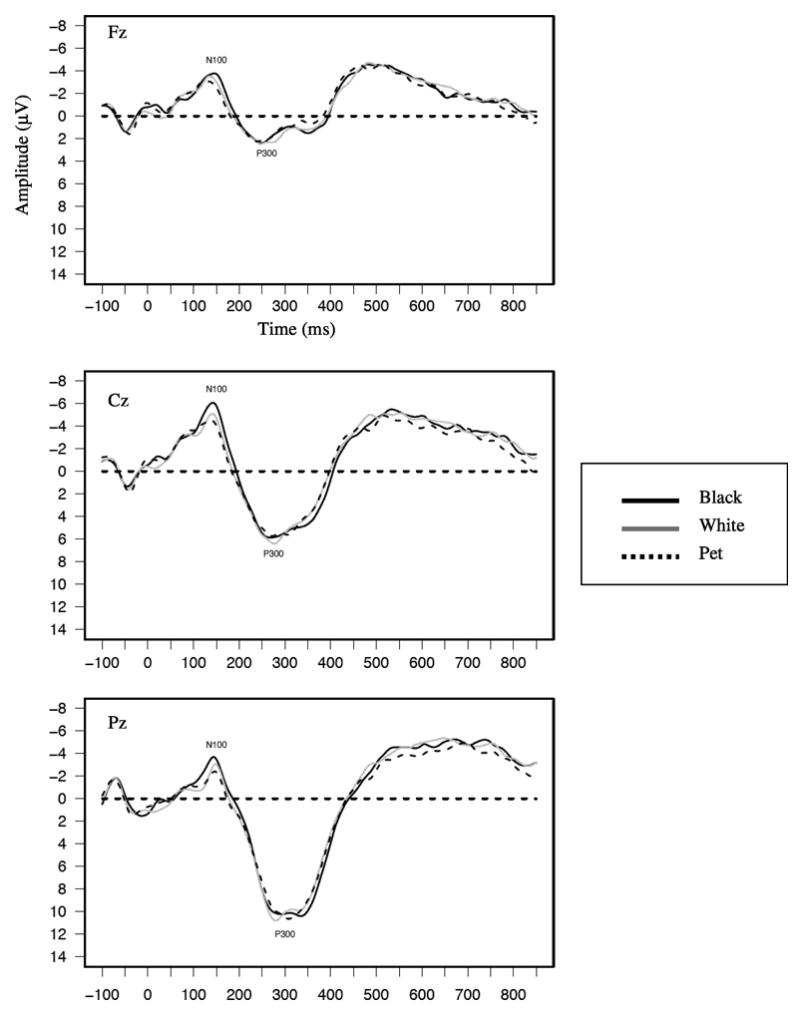
Grand average waveforms as a function of blurred face seen for the spatial location task shown separately at Fz, Cz, and Pz.
Results and Discussion
Our analyses are broken down into four sections. First we report amplitude analyses from the race and emotion blocks for four ERP components, N100, P200, N200, and P300, with the assumption that component amplitude reflects the degree to which the psychological operation associated with that component has been engaged. We then examine response latencies to making race and emotion categorization decisions. We then present regression analyses that examine how effects reflected in the ERP components are related to explicit emotion and race categorization judgments. Finally, we present the amplitude analyses for ERP responses in the spatial location task.
ERP Effects in the Race and Emotion Tasks
N100 amplitude
Waveforms averaged across participants separately as a function of face race and expression are shown in Figure 1 and Figure 2. Waveforms are shown separately for the race (Figure 1) and emotion (Figure 2) tasks. The N100 can be seen as the negative-going deflection with a mean latency of 124 ms. Mean N100 amplitudes at Cz, where the component was the largest, are shown in Table 1. Replicating past findings (Ito & Urland, 2003), a race main effect was found at the N100, with larger N100s to Black than White faces (M=−5.04 μV and M=−4.59 μV, respectively, F(1,28)=7.08, p=.01). The emotion main effect was not significant, but the Race × Emotion interaction was marginally significant (F(2,56)=3.04, p=.06). Simple effects tests revealed larger N100s to Black than White faces for angry expressions (M=−5.19 μV and M=−4.44 μV, respectively, F(1,28)=8.95, p<.05) and for neutral expressions (M=−5.07 μV and M=−4.36 μV, respectively, F(1,28)=6.53, p<.05). Of interest, N100 amplitudes did not differ for Black happy and White happy faces. Thus, Black faces were associated with greater attention than White faces when displaying negative and neutral expressions, but attention to Black and White faces did not differ when they were displaying a clearly positive expression.5
P200 amplitude
Both past race and emotion effects were replicated in the P200 (see Figure 1, Figure 2, & Table 2). Consistent with past race findings (Ito & Urland, 2003, 2005), the race main effect showed larger amplitudes to Black than to White faces (M=7.57 μV and M=6.81 μV, respectively, F(1,28)=9.12, p<.01). There was also an emotion main effect (F(2,56)=4.81, p<.05); simple effects tests replicated past research showing larger P200s to angry than to neutral facial expressions (F(1,28)=7.11, p<.01, M=7.56 μV and M=6.70 μV, respectively). P200s to happy facial expressions were larger than those to neutral expressions (F(1,28)=4.11, p=.05, M=7.30 μV for happy). Although angry expressions were directionally associated with larger P200s than happy expressions, this comparison was not significant.6
Coupled with the N100 amplitude results, P200 effects clearly replicate past research in suggesting greater attention to the racial group that is most distinctive and/or negative. The larger P200s to angry than neutral expressions, and tendency for larger P200s to angry than happy expressions is also consistent with an attentional distinctiveness/threat effect. Evidence of interactions between race and emotion were more mixed, with a marginal interactive effect seen in the N100 but not P200.
N200 amplitude
As with the P200, past race and emotion effects were both replicated in the N200 (see Figure 1, Figure 2, & Table 3). For race, the main effect replicated past findings (Ito & Urland, 2003, 2005; Ito et al., 2004) by showing larger (more negative) N200s to White than Black faces (M=−.51 μV and M=1.87 μV, respectively, F(1,28)=64.89, p<.01). The main effect of emotion was also significant (F(2,56)=10.92, p<.01). N200s were larger (i.e. more negative-going) to happy than angry facial expressions (M=.12 μV and 1.58 μV, respectively, F(1,28)=20.69, p<.01). N200s were also larger to neutral (M=.33 μV) than angry expressions, F(1,28)=16.15, p<.01), while happy and neutral expressions did not differ. Emotion also interacted with task, (F(2,56)=5.06, p=.01). Of importance, N200s were larger to happy than angry expressions in both tasks. The interaction was attributable to differences to neutral expressions across the tasks. Specifically, the difference between happy and neutral expressions was larger in the race task (M=.93 μV) than emotion task (M=−.50 μV, F(1,28)=8.59, p<.01).7 Consistent with past research, these race and emotion effects suggest individuation and deeper processing of (largely) ingroup Whites and faces displaying happy, approachable expressions at this point in processing (cf., Holmes et al., 2003; Ito & Urland, 2003; James et al., 2001; Tanaka et al., 2004; Walker & Tanaka, 2003). Like the P200, there was no evidence of an interaction between race and emotion in the N200.
P300 amplitude
Although the P300’s past sensitivity to the arousing properties of a stimulus may have resulted in larger responses to outgroup Blacks, there was no main effect of race (see Figure 1, Figure 2, & Table 4). There was a significant Sagittal × Race interaction (F(2,56)=5.34, p<.01), but there were no differences between P300s to Blacks and Whites at any of the sagittal sites. The interaction instead resulted from a slightly different scalp distribution for Black versus White faces. P300 amplitude increased linearly from Fz to Pz for both Black and White faces, but this effect was bigger for Black than White faces (F(1,28)=4.48, p=.04).
The main effect of emotion was also marginally significant (F(2,56)=3.01, p=.06), showing that P300 amplitudes were larger to angry (M=10.71 μV) than to neutral (M=10.10 μV, F(1,28)=64.18, p=.05) or happy expressions (M=10.04 μV, F(1,28)=5.33, p<.05). This effect was qualified by a Task × Emotion interaction (F(1,28)=6.22, p<.01) revealing the significant emotion effect (i.e., larger P300s to angry than neutral or happy expressions) in only the emotion task (Fs(1,28)= 13.03 and 5.71, p<.05, respectively). By contrast, there were no differences among emotional expressions in the race task.
Although there was no race main effect in the P300, the emotion findings do support past research demonstrating that the P300 is sensitive to motivationally relevant and arousing stimuli, which in this study would have been strongest for angry expressions. However, it is worth noting that this effect was only found when the task goals were to differentiate these expressions. This contrasts with N100, P200, and N200 results, where effects of race and emotion were typically seen in both tasks. Perhaps at this later stage in processing, task goals are more important to attention allocation.8 Once again there was no interaction between race and emotion (see Table 4).9
Behavioral Responses in the Race and Emotion Tasks
Latencies on correct trials were log-transformed and averaged for the six trial types in each task. A 2 (Race: Black, White) × 3 (Emotion: Happy, Angry, Neutral) × 2 (Task: Race Categorization, Emotion Categorization) ANOVA revealed a task main effect such that participants were faster to respond during the race categorization task (M=528.52 ms) than during the emotion categorization task (M=832.65 ms; F(1,27)=151.20, p<.01). This effect is probably at least partly driven by the use of two category labels in the race task but three category labels in the emotion task. There was also an emotion main effect (F(2,54)=19.39, p<.01). Supporting past research (Eimer, Holmes, & McGlone, 2003; Leppanen & Hietanen, 2003), simple effects tests revealed that participants were faster to respond to happy (M=650.23 ms) than angry (M=701.50 ms) or neutral expressions (M=690.03 ms, Fs(1,27)=36.21 and 25.16, ps<.01, respectively).
Both effects were qualified by an Emotion × Task interaction (F(2,54)=23.66, p<.01). Paired-t tests reveled that reaction times were faster to happy (M=771.16 ms) than angry expressions (M=877.83 ms) in the emotion task (t(27)=7.63, p<.01), but not in the race task (Ms=529.30 and 525.18 ms, respectively). In the emotion task, reaction times were slower to neutral than to happy expressions (F(1,28)=5.24, p<.01) but did not differ from angry expressions. In the race task, neutral expressions were not different from either happy or angry.
There was also a Race × Task interaction (F(1,27)=11.28, p<.01). In the race task, participants were faster to Blacks (M=521.11 ms) than to Whites (M=535.93 ms; (F(1,27)=5.15, p=.03), but this pattern reversed in the emotion task, where participants were faster to Whites as compared with Blacks (M=825.23 ms and M=840.07 ms, respectively, F(1,27)=4.23, p=.05). Taken together, these two interactions show replication of past emotion and race categorization effects when the dimension is task relevant. That is, responses were faster to happy expressions in the emotion task, and to Blacks in the race task, but the effects did not extend to the condition where the dimension was not task-relevant (e.g., responses were not faster to happy expressions when explicitly attending to race).
Although there were no interactions involving both race and expression, the pattern of results can be interpreted as showing that participants were sensitive to race information in both tasks. This is shown in the significant race effects in both task conditions. It was the case, though, that the direction of the effects differed in the two tasks. The reversal of the expected categorization advantage for Black faces in the emotion task may reflect greater practice differentiating emotional expressions of Whites than Blacks from our primarily Caucasian sample. By contrast, as previously noted, emotional expression affected response latencies only when it was task relevant.
Predicting Behavioral Responses from ERP Responses
In addition to using the ERP and response latency measures to examine race and expression perception at different points in processing, we were also interested in directly determining whether early perceptional effects reflected in the ERPs contribute to later categorization. In order to do this, multiple regression models were constructed in which each ERP component was used to predict latency to make race and emotion judgments. We thought it best to use multiple regression analyses because of the possible correlations among the ERP components. This could occur either because of correlations among the psychological operations indexed by the separate components (e.g., the vigilance processes reflected in the N100 could be correlated with vigilance processes reflected in the P200), or due to simple statistical dependencies because of the time course nature of the data. Thus, to control for the possibility of correlated sources of variance attributable to the components as well as to control for variability among participants in their overall ERP amplitudes, we simultaneously regressed the N100, P200, and N200 onto reaction times. We used only the N100, P200, and N200 for these analyses because the relatively late latency of the P300 makes it possible that any psychological operation it reflects might overlap temporally with processes associated with the execution of response. We also conducted these analyses separately for each task because of task interactions in the ERP and response latency results.
A series of four analyses were performed in which parallel contrasts were computed in the ERP components and the response latencies. In one set of analyses, we computed race main effect contrasts in the N100, P200, and N200, and used those to predict the race main effect in response latency (separately for each task). The remaining analyses examined different emotions’ contrasts computed as the difference in responses to (a) happy versus angry faces, (b) emotional (happy and angry) versus non-emotional (neutral) faces, and (c) angry versus non-angry (happy and neutral) faces. The first contrast tests for differences between positive and negative stimuli. The second contrast compares emotional to non-emotional stimuli. The third contrast assesses vigilance by comparing potentially threatening to non-threatening stimuli. Results are presented separately for the one race and three emotion contrasts
Race contrasts
Table 5 presents the full results for the regression analyses predicting differences in response latency to Blacks and Whites from differences in ERP amplitudes to Blacks and Whites. Starting first with the race task, N200 differences to Whites relative to Blacks emerged as a significant predictor, controlling for the N100 and P200 differences (β=7.49, F(1,23)=6.31, p<.05, PRE=.21). Recall that response latencies were faster to Blacks than Whites in the race task, and N200s were larger to Whites than Blacks. The direction of the effect showed that as attention to Whites relative to Blacks increased in the N200, participants were faster to categorize Blacks as compared to Whites. Considering the association of N200 amplitude with depth of processing in the context of face perception (Tanaka et al., 2005), this effect is consistent with Levin’s (2000) argument that faster categorization of Black than White faces occurs because Black faces are processed in terms of race-specifying features at the expense of more individuated processing. No other effects were significant in this analysis.
For the difference in reaction times to Black and White faces in the emotion task, none of the predictors reached significance (see Table 5).
Emotion contrasts
Table 6 presents the full results for the regression analyses predicting differences in response latency to happy versus angry expressions from differences in ERP amplitudes to happy versus angry expressions. In the race task, the N100 happy/angry contrast was a significant predictor of response latency, controlling for the P200 and N200 differences (β=8.28, F(1,23)=10.30, p<.01, PRE=.30). The direction of the effect showed that as attention to angry expressions relative to happy expressions increased in the N100, participants were slower to categorize happy as compared to angry expressions. Note that the emotion main effect was not significant in the N100, and there were no significant differences in N100s to happy and angry faces at the mean level in the race task. Directionally, though, N100s were larger to angry than happy expressions, and the regression analyses show that individual variability in the degree to which this occurred predicted differences in responses latencies in categorizing the facial expressions.
In the emotion task, the P200 emerged as a significant predictor of the difference in reaction time to happy and angry faces, controlling for the N100 and N200 differences (β=20.77, F(1,23)=6.30, p<.05, PRE=.21). The direction of this effect is the same as the N100 effects in the race task: larger amplitude differences in the P200 in favor of angry expressions were associated with slower responses to happy relative to angry expressions. As in the race task, P200s to angry expressions tended to be larger than those to happy ones, although the difference was not reliable at the mean level. Nevertheless, the regression analyses show that variability in the magnitude of this difference predicted response latencies. Thus, across both tasks, ERP responses indicative of greater attention to angry as compared to happy expressions were associated with relatively slower explicit categorization decisions to happy expressions. This pattern of results may reflect that participants for whom angry expressions attract more attention (as reflected in the N100 in the race task and the P200 in the emotion task) have difficulties in attentional disengagement from threatening faces (Koster, Crombez, Van Damme, Verschuere, & Houwer, 2004; Fox et al., 2001) that may later translate into slower responses to happy faces.
Neither of the other two emotion contrasts yielded any significant effects. Thus, the degree to which ERPs differed between emotional (happy and angry) as compared to neutral faces did not predict reaction time differences as a function of whether the face was emotional. Similarly, the degree to which ERP responses differed to angry as compared to the other two types of faces did not predict any differences in response time to angry versus happy and neutral faces.
Spatial Location Task
Recall that the third block of trials in which participants made spatial location judgments about blurred images revealed a very different ERP morphology than the race and emotion tasks (see Figure 3), with only two components evident, which we refer to as the N100 and P300. These were analyzed with separate 3 (Type of Face: Black, White, Pet) × 3 (Sagittal Site: Frontal, Central, Parietal) GLMs. A comparison of the present results to those obtained in the race and emotion blocks will allow us to determine whether the prior effects are due to race and emotion per se, or due to other physical features that may covary with race and emotion (e.g., low-level visual properties such as luminance).
The only significant effect in each component was the sagittal main effect, Fs(2,56)=10.77 and 80.40, ps<.05, respectively. For the N100, amplitudes were larger at Cz (M=−6.141 μV) than the average of amplitudes at Pz (M=−4.44 μV) and Fz (M=−4.57 μV, F(1,28)=43.37, p<.01). For the P300s, amplitudes were larger at Pz (M=11.94 μV) than at the average of Fz (M=4.67 μV) and Cz (M=8.29 μV, F(1,28)=92.17, p<.01)
Of importance, analyses of the N100 and P300 in the spatial location block revealed no effects of target race or emotion, clearly showing that the effects obtained in the race and emotion tasks were not due to low-level perceptual features but rather to emotion and race cues themselves.
General Discussion
Past face perception researchers have assumed that race and expression information are processed by independent, parallel streams, but this question has rarely been empirically addressed (Bruce & Young, 1986; Haxby et al., 2000). The research that has directly examined the issue demonstrates that race and emotion cues can affect each other (Hugenberg & Bodenhausen, 2003; 2004), but these effects have primarily been obtained when one of the cues was ambiguous and therefore difficult to process. Moreover, only explicit judgments have been assessed. In order to fully inform our understanding of face perception, we were primarily interested in understanding how these cues are processed when both sources of information are relatively unambiguous. We were also interested in combining the use of ERP and behavioral measures to track the time courseof different aspects of social perception.
The pattern of ERP results we obtained is consistent with past research on the perception of race and emotion. At the earliest stages of processing that we assessed, N100 and P200 effects clearly replicate past research suggesting greater attention to the racial group that is most distinctive and/or negative. In the case of the present sample, which was non-Black and largely White, this resulted in larger N100s and P200s to Blacks than Whites. The larger P200s to angry than neutral expressions, and tendency for larger P200s to angry than happy expressions is also consistent with an attentional distinctiveness/threat effect.
At the next stage of processing reflected in the N200, results were consistent with past research in showing larger N200s to Whites than Blacks and to happy than angry expressions. These effects are consistent with past researcher’s suggestions that the N200 reflects individuation and deeper processing when viewing faces, which we would expect to be greater for faces of Whites (because they are members of a culturally powerful group and/or the ingroup) and faces displaying happy, approachable expressions (Holmes et al., 2003; Ito & Urland, 2003; James et al., 2001; Tanaka et al., 2004; Walker & Tanaka, 2003).
As perception continued, P300s results also replicated past research showing larger P300s to the most motivationally relevant and arousing stimuli (angry expressions). P300 effects were limited to the emotion task, when task demands served to focus attention on this cue.
Finally, in the later explicit categorization stage, latencies to make explicit race and expression judgment replicated as well as extended past effects. As in previous research, reaction times were faster to Blacks and happy expressions when that dimension was task relevant. That is, participants were faster to respond to Black faces in the race task, and to happy expressions in the emotion task. We extend these past findings by showing that when explicitly attending to facial expressions, participants were faster to categorize White than Black targets. This shows that participants were sensitive to race information in both tasks but that different processes may govern response latency in the two tasks. Lower contact with Blacks and the viewing of Whites as a cultural racial default (Levin, 2000; Stroessner, 1996) likely make Black faces more discriminable than White ones. The faster responses to Blacks in the race task may indicate that discriminability plays a large role in this task. On the other hand, our participants may have had more experience decoding the emotional expressions of Whites than Blacks. The faster responses to Whites in the emotion task may indicate that familiarity plays a larger role in this task.
It is interesting to note that task effects were more evident later in processing, emerging in the P300 and explicit judgments. In the N100, P200, and N200, race and emotion effects were generally identical in both task conditions. By contrast, in response latencies, the race effects went in opposite directions as a function of task. Task differences where also seen for emotional expression. In both the P300 and response latencies, expression had an effect only when emotion was explicitly task relevant. These results suggest that the N100, P200, and N200 are reflecting more obligatory aspects of processing, leading to sensitivity to race and emotion information even when not explicitly task relevant. Processes that occur later in processing and are reflected in the P300 and in explicit judgments are likely more thoughtful, and are more influenced by task goals. Thus, these results show that race and emotion processing is both automatic yet affected by explicit processes depending on the point in processing.
Despite clear evidence that race and emotion affected both early perceptual and later explicit processes, there was little evidence that the two types of cues interact to affect perception. Of importance, there were no interactions between race and emotion in the P200, N200, P300, or response latencies for explicit judgments. This supports models of face perception suggesting that these two types of information are typically processed independently and in parallel. As Haxby et al. (2000) noted, face perception involves encoding of both relatively invariant, unchangeable aspects of a face such as eye shape and lip width as well as changeable aspects of the face such as whether the eyes are open wide and the mouth is turned up or down (see also Bruce & Young, 1986). Some aspects of face perception rely more heavily on one type of cue. Recognition of a unique individual, for instance, depends more heavily on the invariant aspects of a face, and needs to be achieved under different configurations of the changeable aspects of the face (e.g., both when the person is smiling or frowning). Likewise, perception of the changeable aspects of the face, as during expression or speech recognition, needs to be achieved across unique individuals. For these reasons, social category judgments and expression perception have typically been associated with functionally distinct aspects of face perception, capable of being processed in parallel. Our results suggest that under relatively common viewing conditions – when both the race and expression information are easy to perceive – the cues have little effect on each other. This is true both of relatively early aspects of perception, as reflected in the ERP responses, as well as more explicit judgments.
This is not to say that the two types of cues cannot interact. Situations of ambiguity in one or both sources of information may be resolved by integrating the two types of information. As Hugenberg and Bodenhausen (2003, 2004) have shown, expression information can influence race categorization when there is difficulty in determining an individual’s race and vice versa. Moreover, to the degree that impression formation integrates across different types of information, both from the face as well as from other sources (e.g., behavioral information), interactions between race and expression seem likely. Consistent with this, Chiu, Ambady, and Deldin (2004) showed that both race and emotion affected judgments about whether participants reported wanting to work with different targets. Measures of anticipated cognitive effort were also affected by the interaction between race and expression information.
Somewhat surprisingly, the only evidence of a race by emotion interaction in the present study was the marginal interaction obtained in the N100. Follow-up contrasts showed that N100s were larger to Blacks than Whites for angry and neutral expressions, but did not differ as a function of race for happy expressions. This pattern could reflect a vigilance effect, where the increased attention generally shown to Black faces is attenuated when the face displays a clearly positive and therefore non-threatening expression. On the other hand, no similar effect was seen in any other ERP component or in response latencies. Moreover, it is surprising that this effect was seen in our earliest measure, and not in any of the subsequent measures. We are therefore cautious in interpreting its implications. Although this may reflect a moderation of vigilance by emotion, it could also be due to some physical properties of the stimuli. For instance, angry and neutral expressions both tended to differ from happy expressions because the latter involved an open mouth that revealed teeth. It is possible that the N100 was reflecting physical properties such as this and not race and emotion perception per se. Considering all the measures together, then, our results support the general conclusion that race and emotion cues are processed independently beginning at least as early as 170 ms (the mean latency of the P200) and continuing through to explicit race and emotion judgments. Although there may be situations where perceivers are forced to draw upon other cues to inform their decision, when cues are clearly interpretable, processing appears to occur quickly and in parallel.
A second goal of this study was to examine how attention relates to later categorization. The regression analyses allow us to track how these early perceptual processes relate to explicit categorization decisions. These analyses revealed that sensitivity to race at earlier points in perception affects response latencies in making race judgments, and that sensitivity to expression at earlier points in perceptions affects response latencies in making emotion judgments. The relation between attentional differences as a function of race and response latencies in the race task are consistent with suggestions that outgroup faces are processed in terms of race-specifying features at the expense of more individuated processing (Levin, 2000). We found that the degree to which N200s were larger to Whites than Blacks predicted faster responses to Black than White faces in the race categorization task. N200 amplitude has been associated with depth of processing in face perception, so this effect suggests that differences in an ERP component associated with variations in depth of processing are associated with variations in an explicit measure sensitive to the salience of race-specifying information. Note that these effects were limited to the race categorization task. No comparable relation was found when participants were explicitly attending to expression.
Considering the emotion effects obtained in both tasks, larger amplitude differences in favor of angry expressions were associated with slower responses to happy relative to angry expressions. As noted previously, this may reflect a trade-off between initial attentional engagement and response latency. That is, initially directing more attention to one class of stimuli (i.e., angry expressions) may slow subsequent responses to other stimuli (i.e., happy expressions) due to difficulties in attentional disengagement from threatening faces (Koster et al., 2004; Fox et al., 2001).
Looking across the regression analyses, we see that effects were obtained with three different ERP components (N100, P200, N200). The N100 and P200 often show similar effects of race and emotion, and both components have been associated with vigilance and sensitivity to novelty. The N200, as noted, has been associated with depth of processing/individuation. The fact that N100 and P200 effects predicted differences in response latency as a function of emotional expression whereas the N200 predicted differences in response latency as a function of target race may reflect the nature of processing most important for each stimulus dimension. That is, differences in processes related to vigilance and novelty may be more integral in differentiating responses to faces showing different expressions, but differences in processes related to individuation may contribute more to variance in responses to faces of different races. In considering why the emotion effects were seen in the N100 in one analysis and in the P200 in the other, this could simply reflect conceptually similar results that manifested at slightly different points in time. This could relate to something systematic (i.e., the effects occur earlier in one task than another), or simply to some feature in this particular sample. Differentiating between the two explanations would require examining the same issue in a different sample.
Finally, the inclusion of the spatial location task with the blurred images extends past research on race and emotion by showing that race and emotion effects on ERPs reflect something about the perception of race and emotion information themselves, and not just the low-level physical features that may covary with race and emotion information. This conclusion is supported first by the absence of race or emotion effects in the ERP components recorded during the spatial location task. In addition, the morphology of the waveforms was very different. It was particularly notable that the P200 and N200 obtained when the stimuli could readily be perceived as faces were not elicited by the blurred images.
Researchers interested in social perception have just begun to investigate how cues relevant to social inferences are perceived in combination. This is a particularly important question when applied to face perception given the many different types of information available from a single face. Looking across the different measures we assessed, our results suggest that perceivers very quickly process both race and emotion information, even when it is not explicitly task relevant. Each of these types of information appears to be processed independently and in parallel. Moreover, the psychological processes governing perception at different points in time may differ, starting first with a coarse vigilance process (seen in the N100 and P200) that eventually changes to reflect differences in individuation (seen in the N200). Analyses comparing the ERP and response latency results suggest that individual variation in the vigilance processes may be more important in making explicit emotion categorization judgments whereas individual variation in the individuation processes may be more important in making explicit race categorization judgments. While effects are relatively more obligatory at the earliest stages of processing, explicit task goals begin to affect responses by at least 445 ms (the mean latency of the P300), and continue into explicit judgments. There is also evidence of asymmetry between the race and emotion effects, with race effects occurring regardless of task (albeit in different directions), but emotion effects being confined at these later points in processing to instances where emotion was explicitly task relevant.
This is the first examination to our knowledge of the processing of both race and emotion cues over time, using both explicit measures as well as implicit neurological indices. We found support for the assertion that these cues are processed quickly and independently at virtually all stages of processing. These findings are a step toward understanding how social category information is processed in combination, providing an initial framework from which to proceed. Future face perception models should strive to include this valuable and rich information that we extract from faces everyday in order to fully capture all facets of face perception.
Acknowledgments
This research was supported by a Ford Foundation Predoctoral Fellowship to the first author, and NIMH MH071257 to the second author.
We thank Becky Tucker for assistance with data collection, Heather Coulter for technical support, and the CU Stereotyping and Prejudice lab for helpful comments.
Footnotes
P300s have been examined during race perception using an oddball procedure in which faces of one race (e.g., White) are presented much more frequently than faces of another race (e.g., Black) (Ito & Urland, 2003, 2005). In this paradigm, P300 amplitude is typically sensitive to the discrepancy between the rare (i.e., oddball) and frequently presented stimuli along salient dimensions, such as race. In the current procedure, faces of different races will be presented with equal probability. In this procedure, P300 amplitude typically reflects arousal or motivational relevance, as noted in the text.
Excluding the non-White participants from analyses did not impact the pattern or significance of the results.
As can be seen from the waveforms, there were two negative deflections that typically presented from 200–300 ms for most of the participants. The first deflection typically occurred around 200 ms while the second typically occurred around 250 ms. Because the N200 associated with individuation typically occurs around 250 ms and because this was the maximal deflection occurring negatively for this epoch, the peak was systematically scored at the corresponding deflection around 250 ms.
There were only two effects involving participant gender. First was a Gender × Race interaction in the P200 (F(1,25)=5.16, p<.05). Although both males and females showed larger P200s to Blacks than Whites, the difference was only significant for male participants (F(1,25)=14.05, p<.01). In the N200, there was a Block × Emotion × Gender interaction (F(2,50)=5.59, p<.01). Simple effects contrasts showed that N200s were similar in amplitude for males and females for all of the emotions in both tasks except for happy expressions in the race task, where females had larger amplitudes to happy expressions than males (F(1,25)=4.52, p<.05).
There were two significant effects involving the sagittal variable in the N100 analysis, but neither change the theoretical interpretation of effects reported in the main text. The sagittal main effect (F(2,56)=36.43, p<.01) showed that the N100 was maximal at Cz (M=−6.20 μV) as compared with the average of Fz (−4.92 μV) and Pz (M=−3.30 μV, F(1,28)=94.60, p<.01). The Race × Sagittal interaction (F(2,56)=4.91, p<.05) showed that N100 amplitudes were larger to Blacks than Whites at Cz (MBlack=−6.40 μV and MWhite=−6.00 μV, F(1,28)=4.78, p<.05) and Pz (MBlack=−3.70 μV and MWhite=−3.00 μV, F(1,28)=11.80, p<.01) but not at Fz.
The sagittal main effect in the P200 (F(2,56)=3.05, p<.01) revealed larger P200s at Pz (M=7.68 μV) than at the average of Cz (M=6.87 μV) and Fz (M=7.02 μV; F(1,28)=4.10, p<.05).
N200 analysis also revealed two sagittal effects. The main effect (F(2,56)=15.43, p<.01), showed that the N200 was maximal at Cz (M=−0.06 μV) as compared with the average of Fz (M=0.14 μV) and Pz (M=1.95 μV, F(1,28)=41.54, p<.01). Additionally, there was a Sagittal × Emotion interaction (F(4,112)=3.77, p<.05). Within-subjects contrasts revealed that N200s were larger to happy than angry expressions at all sites, but the difference was greater at Cz (M=1.4 μV) than at Fz (M=.97, F(1,28)=4.93, p<.05).
The sagittal main effect in the P300 (F(2,56)=61.94, p<.01) revealed larger P300s at Pz (M=13.34 μV) than at the average of Fz (M=7.34 μV) and Cz (M=10.16 μV, F(1,28)=65.22, p<.01). This effect was qualified by a Task × Sagittal interaction (F(1,28)=5.96, p<.05). Simple effects contrasts revealed that at Fz amplitudes were larger in the emotion task (M=13.20 μV) than in the race task (M=6.74 μV, F(1,28)=66.403, p<.01). However, at Cz and Pz amplitudes were larger in the race task (Ms=13.48 μV and 10.29 μV) than in the emotion task (Ms=10.03 μV and 7.95, Fs(1,28)=45.36 and 16.57, ps<.01).
Complete analyses were also run on latency for each component, but results differed across components and did not yield a clear theoretical conclusion. In particular, race main effects were seen in P200 and P300 latency (F(2,56)=53.20, p<.01 and F(2,56)=3.32, p=.05, respectively), but showed opposite effects. Whites were associated with faster P200s, but Blacks were associated with faster P300s. Emotion main effects were obtained in the N100 and P200 (F(1,28)=49.89, p<.01 and F(2,56)=3.77, p<05). In both cases, ERP responses were fastest to happy expressions. In the case of the N100, responses to happy expressions were faster than to neutral, but not angry expressions. In the P200, responses to happy and neutral expressions did not differ, and both were faster than responses to angry expressions. For both the race and emotion main effects, the latency results do not map easily onto the amplitude results (e.g., P200s were larger to Blacks but faster to Whites, and P300 amplitude did not differ by race while response were faster to Blacks). The Race × Emotion interaction was not significant for any component.
Publisher's Disclaimer: This is a PDF file of an unedited manuscript that has been accepted for publication. As a service to our customers we are providing this early version of the manuscript. The manuscript will undergo copyediting, typesetting, and review of the resulting proof before it is published in its final citable form. Please note that during the production process errors may be discovered which could affect the content, and all legal disclaimers that apply to the journal pertain.
References
- Beaupré MG, Hess U. In my mind, we all smile: A case of in-group favoritism. Journal of Experimental Social Psychology. 2003;39(4):371–377. [Google Scholar]
- Bentin S, Deouell LY. Structural encoding and identification in face processing: ERP evidence for separate mechanisms. Cognitive Neuropsychology. Special Issue: The cognitive neuroscience of face processing. 2000;17:35–54. doi: 10.1080/026432900380472. [DOI] [PubMed] [Google Scholar]
- Bodenhausen GV, Macrae CN. Stereotype activation and inhibition. In: Wyer JR, editor. Advances in social cognition. Vol. 11. Mahwah, NJ: Erlbaum; 1998. pp. 1–52. [Google Scholar]
- Brewer MB. A dual process model of impression formation. In: Srull TK, Wyer RS, editors. Advances in social cognition. Vol. 1. Hillsdale, NJ: Erlbaum; 1988. pp. 1–36. [Google Scholar]
- Bruce V, Young A. Understanding face recognition. British Journal of Psychology. 1986;77(3):305–327. doi: 10.1111/j.2044-8295.1986.tb02199.x. [DOI] [PubMed] [Google Scholar]
- Carretié L, Mercado F, Tapia M, Hinojosa JA. Emotion, attention, and the ‘negativity bias’, studied through event-related brain potentials. International Journal of Psychophysiology. 2001;41:75–85. doi: 10.1016/s0167-8760(00)00195-1. [DOI] [PubMed] [Google Scholar]
- Chiu P, Ambady N, Deldin P. Contingent negative variation to emotional in- and out-group stimuli differentiates high- and low-prejudiced individuals. Journal of Cognitive Neuroscience. 2004;16:1830–1839. doi: 10.1162/0898929042947946. [DOI] [PubMed] [Google Scholar]
- Correll J, Park B, Judd CM, Wittenbrink B. The police officer’s dilemma: Using ethnicity to disambiguate potentially threatening individuals. Journal of Personality and Social Psychology. 2002;83:1314–1329. [PubMed] [Google Scholar]
- Devine PG. Prejudice and stereotypes: Their automatic and controlled components. Journal of Personality and Social Psychology. 1989;56:5–18. [Google Scholar]
- Devine PG, Plant EA, Amodio DM, Harmon-Jones E, Vance SL. The regulation of explicit and implicit race bias: The role of motivations to respond without prejudice. Journal of Personality and Social Psychology. 2002;82(5):835–848. [PubMed] [Google Scholar]
- Dolcos F, Cabeza R. Event-related potentials of emotional memory: Encoding pleasant, unpleasant, and neutral pictures. Cognitive, Affective, and Behavioral Neuroscience. 2002;2(3):252–263. doi: 10.3758/cabn.2.3.252. [DOI] [PubMed] [Google Scholar]
- Eimer M, Holmes A. An ERP study on the time course of emotional face processing. Neuroreport: For Rapid Communication of Neuroscience Research. 2002;13(4):427–431. doi: 10.1097/00001756-200203250-00013. [DOI] [PubMed] [Google Scholar]
- Eimer M, Holmes A, McGlone FP. The role of spatial attention in the processing of facial expression: An ERP study of rapid brain responses to six basic emotions. Cognitive, Affective, & Behavioral Neuroscience. 2003;3(2):97–110. doi: 10.3758/cabn.3.2.97. [DOI] [PubMed] [Google Scholar]
- Ekman P, Friesen WV. Unmasking the face: A guide to recognizing emotions from facial clues. Oxford, England: Prentice-Hall; 1975. [Google Scholar]
- Fiske ST, Lin M, Neuberg SL. The continuum model: Ten years later. In: Chaiken S, Trope Y, editors. Dual-process theories in social psychology. New York, NY: Guilford Press; 1999. pp. 231–254. [Google Scholar]
- Felmingham KL, Bryant RA, Gordon E. Processing angry and neutral faces in post-traumatic stress disorder: An event-related potentials study. Neuroreport: For Rapid Communication of Neuroscience Research. 2003;14(5):777–780. doi: 10.1097/00001756-200304150-00024. [DOI] [PubMed] [Google Scholar]
- Fox E, Russo R, Bowles R, Dutton K. Do threatening stimuli draw and hold visual attention in subclinical anxiety? Journal of Experimental Psychology: General. 2001;130(4):681–700. [PMC free article] [PubMed] [Google Scholar]
- Greenhouse SW, Geisser S. On methods in the analysis of profile data. Psychometrika. 1959;24:95–112. [Google Scholar]
- Greenwald AG, Banaji MR. Implicit social cognition: Attitudes, self- esteem, and stereotypes. Psychology Review. 1995;102:4–27. doi: 10.1037/0033-295x.102.1.4. [DOI] [PubMed] [Google Scholar]
- Hansen CH, Hansen RD. Finding the face in the crowd: An anger superiority effect. Journal of Personality and Social Psychology. 1988;54(6):917–924. doi: 10.1037//0022-3514.54.6.917. [DOI] [PubMed] [Google Scholar]
- Haxby JV, Hoffman EA, Gobbini MI. The distributed human neural system for face perception. Trends in Cognitive Science. 2000;4:223–233. doi: 10.1016/s1364-6613(00)01482-0. [DOI] [PubMed] [Google Scholar]
- Holmes A, Vuilleumeir P, Eimer M. The processing of emotional facial expression is gated by spatial attention: Evidence from event-related brain potentials. Cognitive Brain Research. 2003;16:174–184. doi: 10.1016/s0926-6410(02)00268-9. [DOI] [PubMed] [Google Scholar]
- Hugenberg K. Social categorization and the perception of facial affect: Target race moderates the response latency advantage for happy faces. Emotion. 2005;5(3):267–276. doi: 10.1037/1528-3542.5.3.267. [DOI] [PubMed] [Google Scholar]
- Hugenberg K, Bodenhausen GV. Facing prejudice: Implicit prejudice and the perception of facial threat. Psychological Science. 2003;14(6):640–643. doi: 10.1046/j.0956-7976.2003.psci_1478.x. [DOI] [PubMed] [Google Scholar]
- Hugenberg K, Bodenhausen GV. Ambiguity in social categorization: The role of prejudice and facial affect in race categorization. Psychological Science. 2004;15(5):342–345. doi: 10.1111/j.0956-7976.2004.00680.x. [DOI] [PubMed] [Google Scholar]
- Ito TA, Thompson E, Cacioppo JT. Tracking the time courseof social perception: The effects of racial cues on event-related brain potentials. Personality and Social Psychology Bulletin. 2004;30(10):1267–1280. doi: 10.1177/0146167204264335. [DOI] [PubMed] [Google Scholar]
- Ito TA, Urland GR. Race and gender on the brain: Electrocortical measures of attention to the race and gender of multiply categorizable individuals. Journal of Personality and Social Psychology. 2003;85(4):616–626. doi: 10.1037/0022-3514.85.4.616. [DOI] [PubMed] [Google Scholar]
- Ito TA, Urland GR. The influence of processing objectives on the perception of faces: An ERP study of race and gender perception. Cognitive, Affective, and Behavioral Neuroscience. 2005;5(1):21–36. doi: 10.3758/cabn.5.1.21. [DOI] [PubMed] [Google Scholar]
- Jasper HH. Recent advances in our understanding of ascending activities of the reticular system. In: Jasper HH, Proctor LD, Knighton RS, Noshay WC, Costello RT, editors. Reticular formation of the brain. Oxford, England: Little, Brown; 1958. pp. 319–331. [Google Scholar]
- James MS, Johnstone SJ, Hayward WG. Event-related potentials, configural encoding, and feature-based encoding in face recognition. Journal of Psychophysiology. 2001;15(4):275–285. [Google Scholar]
- Johnston PJ, Katsikitis M, Carr VJ. A generalized deficit can account for problems in facial emotion recognition in schizophrenia. Biological Psychology. 2001;58(3):203–227. doi: 10.1016/s0301-0511(01)00114-4. [DOI] [PubMed] [Google Scholar]
- Koster EHW, Crombez G, Van Damme S, Verschuere B, Houwer JD. Does imminent threat capture and hold attention? Emotion. 2004;4(3):312–317. doi: 10.1037/1528-3542.4.3.312. [DOI] [PubMed] [Google Scholar]
- Leppänen JM, Hietanen JK. Affect and face perception: Odors modulate the recognition advantage of happy faces. Emotion. 2003;3(4):315–326. doi: 10.1037/1528-3542.3.4.315. [DOI] [PubMed] [Google Scholar]
- Levin DT. Race as a visual feature: Using visual search and perceptual discrimination tasks to understand face categories and the cross-race recognition deficit. Journal of Experimental Psychology: General. 2000;129(4):559–574. doi: 10.1037//0096-3445.129.4.559. [DOI] [PubMed] [Google Scholar]
- Mouchetant-Rostaing Y, Giard MH. Electrophysiological correlates of age and gender perception on human faces. Journal of Cognitive Neuroscience. 2003;15:900–910. doi: 10.1162/089892903322370816. [DOI] [PubMed] [Google Scholar]
- Schupp HT, Ohman A, Junghöfer M, Weike AI, Stockburger J, Hamm AO. The facilitated processing of threatening faces: An ERP analysis. Emotion. 2004;4(2):189–200. doi: 10.1037/1528-3542.4.2.189. [DOI] [PubMed] [Google Scholar]
- Schupp HT, Junghöfer M, Weike AI, Hamm AO. Attention and emotion: An ERP analysis of facilitated emotional stimulus processing. Neuroreport: For Rapid Communication of Neuroscience Research. 2003;14(8):1107–1110. doi: 10.1097/00001756-200306110-00002. [DOI] [PubMed] [Google Scholar]
- Stroessner SJ. Social categorization by race or sex: Effects of perceived non- normalcy on response times. Social Cognition. 1996;14(3):247–276. [Google Scholar]
- Tanaka JW, Curran T, Porterfield AL, Collins D. Activation of pre- existing and acquired face representations: The N250 ERP as an index of face familiarity. 2005 doi: 10.1162/jocn.2006.18.9.1488. Manuscript Submitted. [DOI] [PubMed] [Google Scholar]
- Tanaka JW, Kiefer M, Bukach CM. A holistic account of the own-race effect in face recognition: Evidence from a cross-cultural study. Cognition. 2004;93(1):B1–B9. doi: 10.1016/j.cognition.2003.09.011. [DOI] [PubMed] [Google Scholar]
- Vanderploeg RD, Brown WS, Marsh JT. Judgments of emotion in words and faces: ERP correlates. International Journal of Psychophysiology. 1987;5(3):193–205. doi: 10.1016/0167-8760(87)90006-7. [DOI] [PubMed] [Google Scholar]
- Walker PM, Tanaka JW. An encoding advantage for own-race versus other- race faces. Perception. 2003;32(9):1117–1125. doi: 10.1068/p5098. [DOI] [PubMed] [Google Scholar]
- Weinstein AM. Visual ERPs evidence for enhanced processing of threatening information in anxious university students. Biological Psychiatry. 1995;37(12):847–858. doi: 10.1016/0006-3223(94)00249-3. [DOI] [PubMed] [Google Scholar]