

Abstract
Spectroscopic and calorimetric techniques have been employed to characterize the impact of incorporation of the fluorescent base analog 2-aminopurine into the 1492 or 1493 position of an E. coli rRNA A-site model oligonucleotide, as well as the energetics and dynamics associated with recognition of this A-site model oligomer by aminoglycoside antibiotics. The results of these studies indicate that incorporation of 2AP into either the 1492 or 1493 position does not perturb the structure or stability of the host RNA or its aminoglycoside binding affinity. In addition, the results also highlight drug-induced reduction in the mobilities of the bases at both positions 1492 and 1493 as a potentially key determinant of bactericidal potency.
1. Introduction
The five natural nucleic acid bases (adenine, thymine, guanine, cytosine, and uracil) do not exhibit any significant degree of fluorescence. This property precludes the use of conventional fluorescence techniques to study of RNA and DNA molecules that contain only natural bases. 2-Aminopurine (2AP) is a purine analog, which, unlike guanine and adenine, possesses significant fluorescent properties.1–3 Selective incorporation of 2AP residues allows one to render nucleic acid molecules fluorescent. By so doing, one is then in a position to use fluorescence-based approaches to characterize the structure, energetics, and dynamics of nucleic acids and their complexes with other biologically relevant molecules.3–10
Here, we site specifically introduce 2AP into either of two different positions (1492 or 1493) of an RNA oligonucleotide (Ec) that models the E. coli 16 S rRNA A-site (see Figure 1). We determine the impact of each 2AP substitution on the structure and stability of the RNA, and use the intrinsic fluorescence properties of 2AP to characterize the energetics and dynamics associated with the interactions between the rRNA A-site model oligomer and the aminoglycoside antibiotics, paromomycin, geneticin (G418), neomycin, and ribostamycin (see drug structures in Figure 2).
Figure 1.
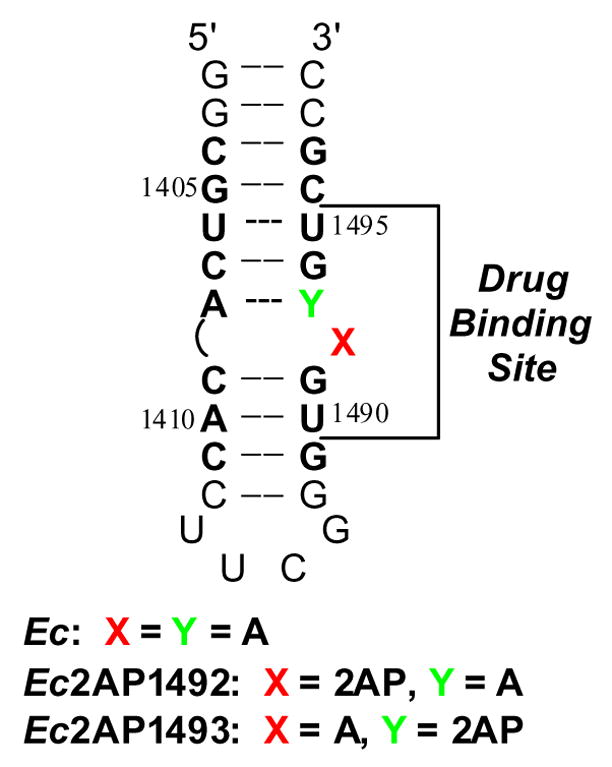
Secondary structure of the E. coli 16 S rRNA A-site model oligonucleotide (Ec). Bases present in E. coli 16 S rRNA are depicted in bold face and are numbered as they are in 16 S rRNA. 2AP denotes 2-aminopurine. The aminoglycoside binding site (as revealed by footprinting, NMR, and crystallographic studies11–15) is indicated.
Figure 2.
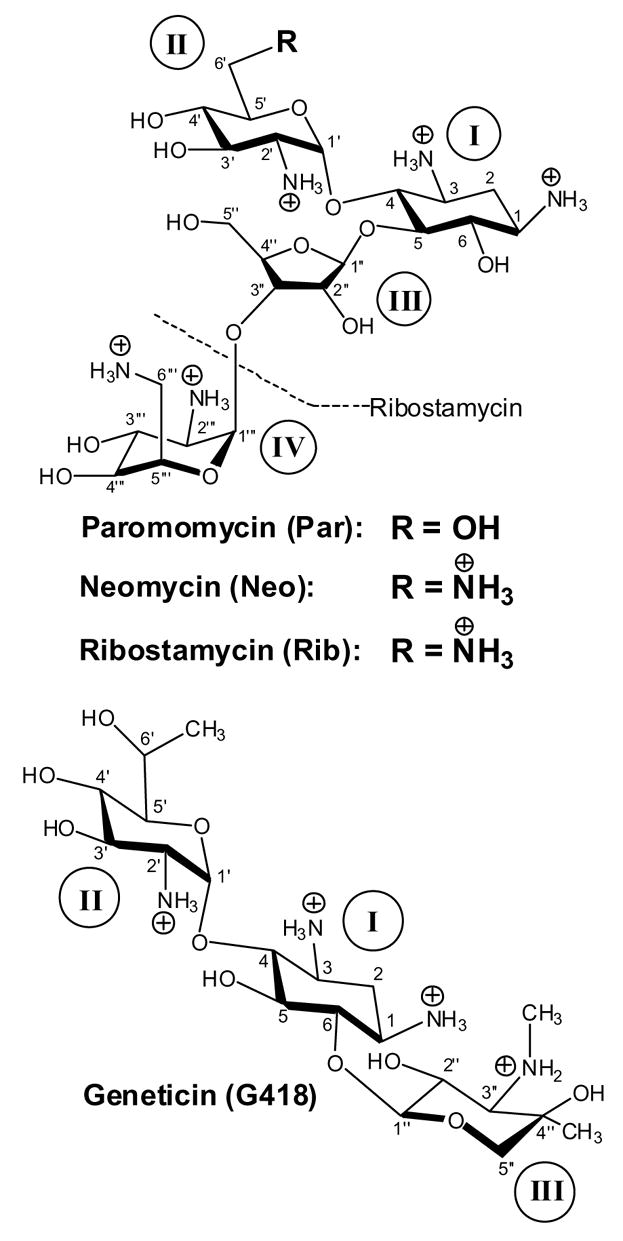
Structures of the four aminoglycosides studied here in their fully protonated cationic states, with the atomic and ring numbering systems denoted in Arabic and Roman numerals, respectively. Unlike neomycin and paromomycin, ribostamycin lacks ring IV (as indicated by the dashed line).
2. Results and discussion
2.1. Substitution of either A1492 or A1493 with 2AP does not perturb the structure or stability of Ec
An important criterion that must be met when introducing a fluorescent label into any biomolecule is that the structure and stability of the biomolecule be minimally perturbed as a result of the modification. We have previously used temperature-dependent absorption spectroscopy to show that substituting A1492 with 2AP does not alter the thermal stability of Ec.9 We sought to determine whether the same is true for the substitution of A1493 with 2AP. Figure 3 shows the UV melting profiles of Ec and Ec2AP1493 at pH 7.5 and a Na+ concentration of 100 mM. Note that the Ec and Ec2AP1493 duplexes exhibit nearly identical thermal stabilities, with melting temperatures (Tm) of 69.7 and 69.6 °C, respectively. Thus, like the substitution of A1492 with 2AP, the corresponding substitution of A1493 with 2AP does not perturb the thermal stability of the host RNA duplex.
Figure 3.
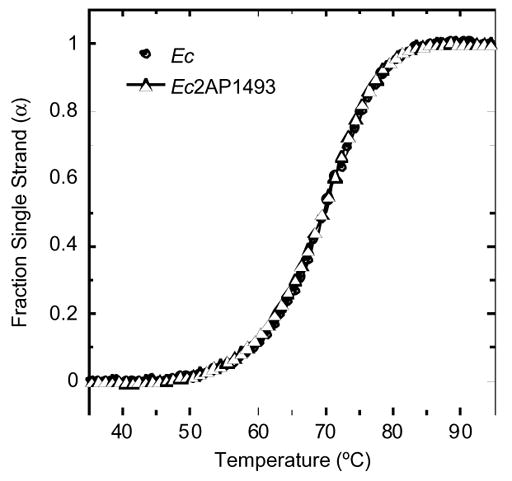
UV melting profiles acquired at 274 nm for the Ec and Ec2AP1493 duplexes. For clarity of presentation, the melting curves were normalized by subtraction of the upper and lower baselines to yield plots of fraction single strand (α) versus temperature.16 Buffer conditions were 10 mM EPPS (pH 7.5), 0.1 mM EDTA, and sufficient NaCl to bring the total Na+ concentration to 100 mM.
We also sought to explore the impact, if any, of substituting A1492 or A1493 with 2AP on the structure of Ec. To this end, we used circular dichroism (CD) spectroscopy to characterize the conformations Ec, Ec2AP1492, and Ec2AP1493 at pH 7.5 and a Na+ concentration of 100 mM. Figure 4 shows the resulting CD spectra acquired at 25 °C.
Figure 4.
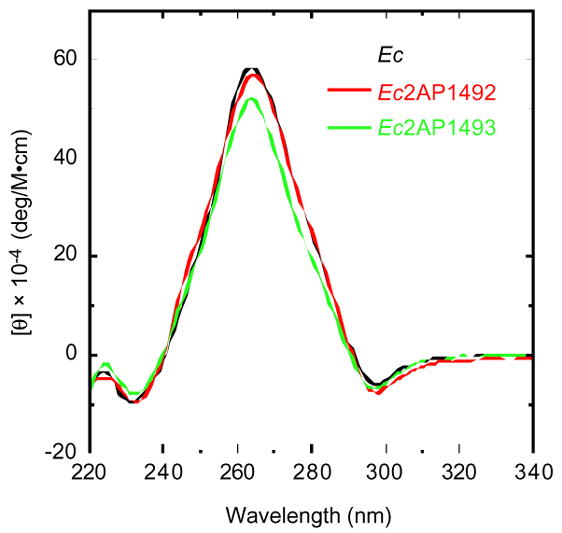
CD spectra of Ec (black), Ec2AP1492 (red), and Ec2AP1493 (green) acquired at 25 °C. Molar ellipticity ([θ]) is expressed in units of deg/M·cm, where M refers to moles of RNA duplex per liter. Buffer conditions were identical to those described in the legend to Figure 3.
Note that all three duplexes exhibit similar CD spectra, with these spectra being characteristic of A-like conformations.17,18 The similarity of the CD spectra suggests that substitution of neither A1493 nor A1492 with 2AP perturbs the structure of Ec to a significant degree. Taken together, our UV melting and CD results indicate that substitution of either A1492 or A1493 with 2AP preserves both the structure and stability of Ec.
2.2. Characterizing aminoglycoside-rRNA A-site binding affinities by analyzing drug-induced changes in 2AP fluorescence
The incorporation of 2AP into Ec offers the possibility of detecting and characterizing Ec-drug binding interactions by monitoring drug-induced changes in the fluorescence of the incorporated 2AP residue. As illustrative examples, Figure 5 shows the fluorescence titrations of Ec2AP1492 and Ec2AP1493 with paromomycin (a) and G418 (b) at pH 7.5 and a Na+ concentration of 100 mM. Note that addition of each drug increases the fluorescence intensity of the 2AP residue when located at position 1492, while decreasing the fluorescence intensity of the 2AP residue when located at position 1493. These drug-induced changes in 2AP fluorescence are indicative of drug binding to the host RNA.9,19,20
Figure 5.
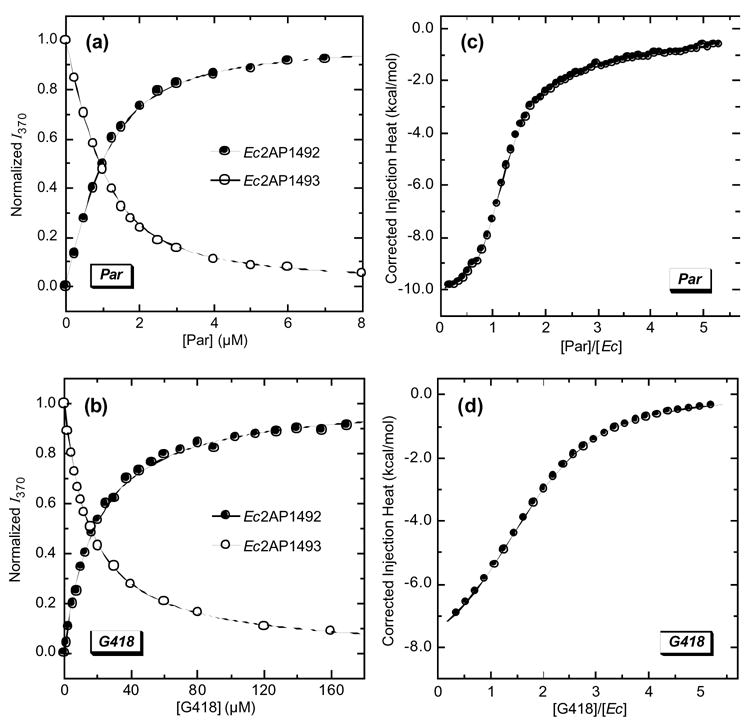
(a) Fluorescence profiles for the titration of paromomycin (Par) into a solution of either Ec2AP1492 or Ec2AP1493 at 25 °C. (b) Fluorescence profiles for the titration of G418 into a solution of either Ec2AP1492 or Ec2AP1493 at 25 °C. In (a) and (b), the solid lines represent fits of the experimental data with Eq. 1. For clarity of presentation, the fluorescence intensity at 370 nm (I370) was normalized by dividing the observed change in I370 (I370 - I0) by the total calculated change in I370 (I∞ - I0). (c) ITC profile at 25 °C for the titration of paromomycin into a solution of Ec. (d) ITC profile at 25 °C for the titration of G418 into a solution of Ec. In (c) and (d), the experimental data points reflected the dilution-corrected injection heats, while the solid lines reflect the calculated fits of the data with a model for two independent sets of binding sites. The binding parameters derived from these fits are summarized in Table S1 of the Supplementary Material. The buffer conditions in all experiments were identical to those described in the legend to Figure 3.
We determined drug-RNA association constants (Ka) for the binding reactions by analyzing the drug-induced changes 2AP fluorescence with the following formalism:
| (1) |
In this relationship, I0 and I are the fluorescence emission intensity of the RNA in the absence and presence of drug, respectively; I∞ is the fluorescence emission intensity of the RNA in the presence of an infinite drug concentration; and [D]tot and [R]tot are the total concentrations of drug and RNA, respectively. The drug-RNA Ka values derived from fits of the fluorescence titrations shown in Figures 5(a) and (b) with Eq. 1 are listed in Table 1. Inspection of these data reveals similar Ka values for paromomycin binding to Ec2AP1492 { Ka = (2.1 ± 0.3) × 106 M−1} and Ec2AP1493 {Ka = (3.7 ± 0.2) × 106 M−1}, with the difference between the Ka values being close to the experimental uncertainty. The same is also true for the binding of G418 to Ec2AP1492 {Ka = (5.4 ± 0.4) × 104 M−1} and Ec2AP1493 { Ka = (6.7 ± 0.3) × 104 M−1}. These observations indicate that the affinity of each drug for the host RNA is essentially the same, regardless of whether the 2AP residue is located at the 1492 or the 1493 position.
Table 1.
Associations constants ( Ka) for the binding of paromomycin (Par) and G418 to Ec, Ec2AP1492, and Ec2AP1493 at 25 °C
| Drug | RNA | Method | Ka (M−1)a |
|---|---|---|---|
| Par | Ec | ITC | (2.3 ± 0.2) × 106 |
| Par | Ec2AP1492 | Fluorescence | (2.1 ± 0.3) × 106 |
| Par | Ec2AP1493 | Fluorescence | (3.7 ± 0.2) × 106 |
| G418 | Ec | ITC | (5.3 ± 0.6) × 104 |
| G418 | Ec2AP1492 | Fluorescence | (5.4 ± 0.4) × 104 |
| G418 | Ec2AP1493 | Fluorescence | (6.7 ± 0.3) × 104 |
Ka values were derived from fits of the fluorescence or ITC titration data shown in Figure 5. The indicated uncertainties represent the 95 % confidence intervals.
2.3. Substitution of either A1492 or A1493 with 2AP does not alter aminoglycoside affinity for Ec
We sought to determine whether 2AP substitution at the 1492 or 1493 position of Ec impacts aminoglycoside affinity for the host RNA. This assessment requires a comparison of the fluorescence-derived aminoglycoside binding affinities for the 2AP-substituted RNA molecules (Ec2AP1492 and Ec2AP1493) with the corresponding binding affinities for the unsubstituted RNA molecule (Ec). We used isothermal titration calorimetry (ITC) to derive the requisite drug-Ec Ka values. Figure 5 shows the ITC profiles for the titration of paromomycin (c) and G418 (d) into a solution of Ec at 25 °C, pH 7.5, and a Na+ concentration of 100 mM. Each experimental data point in Figures 5(c) and (d) reflects the dilution-corrected heat associated with a single drug injection into the RNA. These injection heat data were analyzed as described in the Experimental section to yield Ka values of (2.3 ±0.2) × 106 M−1 and (5.3 ±0.6) × 104 M−1 for the Ec binding of paromomycin and G418, respectively. Note the similarity between these ITC-derived drug-Ec Ka values and the corresponding fluorescence-derived drug-Ec2AP1492 and drug-Ec2AP1493 Ka values (see Table 1). This gratifying concordance indicates that substitution of neither A1493 nor A1492 with 2AP alters aminoglycoside affinity for the host RNA duplex. In more general terms, this observation implies that drug binding information derived from studies conducted on rRNA A-site model oligomers substituted at either their 1492 or 1493 positions with 2AP is reflective of the behavior associated with drug binding to the unmodified A-site sequence.
2.4. Characterizing the impact of aminoglycosides on rRNA A-site nucleotide mobility by analyzing drug-induced changes in the time dependence of 2AP fluorescence anisotropy
The incorporation of 2AP into Ec allows one to characterize not only Ec-aminoglycoside binding affinities, but also Ec dynamics in the absence and presence of drug. We used time-resolved fluorescence anisotropy to characterize the dynamics of Ec2AP1493 in the absence and presence of the aminoglycosides paromomycin, G418, neomycin, and ribostamycin. Figure 6 shows a representative set of polarized fluorescence intensity decays for the four drug complexes of Ec2AP1493, with the emission polarizer oriented either parallel (IVV) or perpendicular (IVH) to the excitation polarization. A similar set of polarized fluorescence intensity decays was obtained for drug-free Ec2AP1493 (not shown). All the polarized fluorescence intensity decays were deconvolved as described in the Experimental section to yield the anisotropy decay parameters listed in Table 2. The anisotropy decays were best described by the sum of two exponential terms (Eq. 4). The r(0) values for the biexponential fits range from 0.290 to 0.375, in good agreement with previously reported r(0) values for 2AP in both DNA and RNA, which range from 0.266 to 0.377.4,5,8,10
Figure 6.
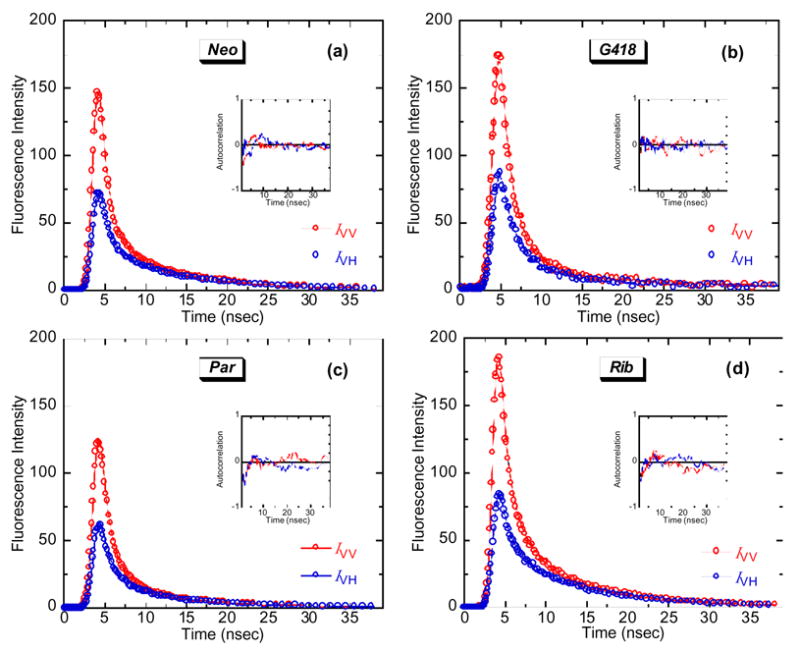
Polarized fluorescence intensity decay profiles at 25 °C for the complexes of Ec2AP1493 with (a) neomycin (Neo), (b) G418, (c) paromomycin (Par), and (d) ribostamycin (Rib). The decay profile with the emission polarizer oriented parallel to the excitation polarization (IVV) is depicted in red, while the decay profile with the emission polarizer oriented perpendicular to the excitation polarization (IVH) is depicted in blue. In each panel, the open circles represent the experimental data points, while the solid lines reflect the nonlinear least squares fits of the data with Eq. 2. The inset in each panel shows the autocorrelation functions of the weighted residuals for the fits of the corresponding decay profiles. Buffer conditions were identical to those described in the legend to Figure 3.
Table 2.
Fluorescence anisotropy decay parameters for Ec2AP1493 and its complexes with neomycin (Neo), G418, paromomycin (Par), and ribostamycin (Rib) at 25 °Ca
| Sample | β1 | φ1 (nsec) | β2 | φ2 (nsec) | r(0)b |
|---|---|---|---|---|---|
| Ec2AP1493 | 0.223 ± 0.043 | 5.82 ± 1.74 | 0.152 ± 0.064 | 0.47 ± 0.09 | 0.375 ± 0.108 |
| Ec2AP1493-Neo | 0.120 ± 0.026 | 7.12 ± 2.12 | 0.189 ± 0.021 | 1.93 ± 0.01 | 0.308 ± 0.047 |
| Ec2AP1493-G418 | 0.160 ± 0.076 | 12.77 ± 3.69 | 0.174 ± 0.026 | 2.00 ± 0.10 | 0.334 ± 0.102 |
| Ec2AP1493-Par | 0.150 ± 0.052 | 4.53 ± 0.22 | 0.141 ± 0.065 | 1.84 ± 0.19 | 0.290 ± 0.118 |
| Ec2AP1493-Rib | 0.274 ± 0.002 | 3.92 ± 0.39 | 0.041 ± 0.010 | 0.69 ± 0.08 | 0.315 ± 0.013 |
For each sample, the values of βi and φi represent averages of at least two independent experiments, with the indicated uncertainties reflecting the standard deviations from the mean.
Values of r(0) were calculated from the sum of β1 and β2, with the indicated uncertainties reflecting the maximum possible errors as propagated through this summation.
The longer of the two rotational correlation times (φ1) reflects the overall tumbling of the RNA duplex.10 The shorter rotational correlation time (φ2) reflects the internal motion of the 2AP base in the RNA, with the subnanosecond value of φ2 (0.47 ± 0.09 ns) obtained in the absence of bound drug being characteristic of previously reported values for 2AP residues in short DNA and RNA duplex constructs at temperatures ≥ 20 °C.4,5,8,10 Note that drug binding increases φ2, an observation indicative of a drug-induced decrease in the mobility of the 2AP base at position 1493. We have previously observed a similar trend with regard to the mobility of the base at position 1492.10
2.5. Greater extents of aminoglycoside-induced reduction in the mobilities of the nucleotides at positions 1492 and 1493 correlate with enhanced bactericidal potency
The bactericidal activities of 2-DOS aminoglycosides are ascribed to their deleterious effects on bacterial translation, which include inhibition of initiation, mistranslation, and premature termination.21,22 Recent structural and biochemical studies have suggested a potential mechanism by which aminoglycosides achieve their antitranslational effects.23,12,24–28,13,29,14,19,30,15 According to this mechanism, A1492 and A1493 are in conformational equilibria between intrahelical and extrahelical states. When in their extrahelical states, both bases engage in interactions with minihelix formed by the mRNA codon and the tRNA anticodon. These interactions are favored in the presence of the cognate tRNA anticodon and disfavored in the presence of a noncognate tRNA anticodon. Upon binding to the rRNA A-site, 2-DOS aminoglycosides shift the conformational equilibria of A1492 and A1493 toward the extrahelical states. As a consequence of this conformational switch, the interactions between the A1492 and A1493 of the rRNA and the codon-anticodon minihelix are enhanced, even when the anticodon is noncognate.
From an entropic viewpoint, the mobilities of A1492 and A1493 should modulate the interactions of the two bases with the codon-anticodon minihelix. High degrees of base mobility should disfavor the interactions by conferring a high energetic barrier to complex formation. By contrast, low degrees of base mobility should disfavor the interactions by lowering the energetic barrier. In support of this notion, we have previously observed a correlation between the extent (Δφ2) to which neomycin, paromomycin, ribostamycin, and G418 reduced the mobility 2AP1492 base in Ec2AP1492 and the bactericidal potencies of the drugs {defined as the minimum inhibitory concentration (MIC) at which no bacterial growth is observed}.10 The relevant MIC values of the four drugs and the Δφ2 values for Ec2AP1492 are summarized in Table 3. In addition, Table 3 also lists the corresponding Δφ2 values for Ec2AP1493. Note that the general correlation between larger values of Δφ2 for Ec2AP1492 and smaller values of MIC (i.e., increased bactericidal potency) also extends to the Δφ2 values for Ec2AP1493. In other words, larger extents of drug-induced reduction in the mobilities of the bases at both positions 1492 and 1493 appear to correlate with enhanced bactericidal potency. This observation suggests that drug-induced alteration in the dynamics of nucleotide mobility at the rRNA A-site is a potentially key determinant of the antibacterial activities of aminoglycosides. An important next step toward assessing the veracity of this hypothesis will be to examine how drug-induced changes in rRNA nucleotide mobility correlate with the antitranslational activities of the drugs in vitro.
Table 3.
Antibacterial activities and rRNA A-site nucleotide mobility effects of neomycin (Neo), G418, paromomycin (Par), and ribostamycin (Rib)
| Drug | MIC (μM)a | Ec2AP1492 Δφ2 (nsec)b,c | Ec2AP1493 Δφ2 (nsec)b |
|---|---|---|---|
| Neo | 3.1 | 1.75 | 1.46 |
| G418 | 6.3 | 1.46 | 1.53 |
| Par | 12.5 | 1.14 | 1.37 |
| Rib | 25 | 0.50 | 0.22 |
Antibacterial activities versus E. coli DH5α cells were determined as previously described.10 MIC values reflect the minimum inhibitory concentrations of drug at which no bacterial growth was observed.
The Δφ2 values for Ec2AP1492 were calculated using φ2 data taken from reference 10.
It should be emphasized that the bactericidal activities of aminoglycosides are also likely to be influenced by factors that are not manifested in vitro, such as cellular uptake and efflux. Thus, a complete understanding of the properties that govern the antibacterial activities of aminoglycosides will require not only in vitro characterizations like those discussed above, but also studies of cellular transport and permeation.
3. Experimental
3.1. RNA and drug molecules
Ec, Ec2AP1492, and Ec2AP1493 were obtained in their PAGE-purified sodium salt forms from Dharmacon Research, Inc. (Lafayette, CO). The concentrations of all RNA solutions were determined spectrophotometrically using the following extinction coefficients at 260 nm and 85 °C: 253,390 ± 3170 (mol strand/L)−1·cm−1 for Ec, 248,370 ± 940 (mol strand/L)−1·cm−1 for Ec2AP1492, and 235,140 ± 2840 (mol strand/L)−1·cm−1 for Ec2AP1493. These extinction coefficients were determined by enzymatic digestion and subsequent colorimetric phosphate assay using previously established protocols.31 All experimental RNA solutions were preheated at 85 °C for 5 min. and slowly cooled to room temperature prior to their use. Paromomycin·H2SO4, neomycin·3H2SO4·3H2O, and G418·2H2SO4 were obtained from Fluka, while ribostamycin·2.5H2SO4 was obtained from Sigma. All drugs were used without further purification.
3.2. Temperature-dependent absorption spectroscopy
Temperature-dependent absorption experiments were conducted on an AVIV Model 14DS Spectrophotometer (Aviv Biomedical; Lakewood, NJ) equipped with a thermoelectrically controlled cell holder. Quartz cells with a 1 cm pathlength were used for all the absorbance studies. Temperature-dependent absorption profiles were acquired at 274 nm with a 5 sec averaging time. The temperature was raised in 0.5 °C increments, and the samples were allowed to equilibrate for 1.5 min at each temperature setting. In these UV melting studies, the RNA solutions were 2 μM in strand. Buffer solutions contained 10 mM EPPS (pH 7.5), 0.1 mM EDTA, and sufficient NaCl to bring the total sodium ion concentration to 100 mM.
3.3. Circular dichroism (CD) spectroscopy
CD experiments were conducted at 25 °C on an AVIV Model 60DS spectropolarimeter (Aviv Biomedical; Lakewood, NJ) equipped with a thermoelectrically controlled cell holder. A quartz cell with a 1 cm pathlength was used for all the CD studies. CD spectra were recorded from 220 to 340 nm in 1 nm increments with an averaging time of 2 sec. In these CD studies, the RNA solutions were 5 μM in strand, and the buffer conditions were identical to those described above for the UV melting experiments.
3.4. Steady-state fluorescence spectroscopy
Steady-state fluorescence experiments were conducted at 25 °C on an AVIV model ATF105 spectrofluorometer (AVIV Biomedical; Lakewood, NJ) equipped with a thermoelectrically controlled cell holder. The excitation and emission wavelengths were set at 310 and 370 nm, respectively. The excitation and emission slitwidths were set at 3 and 4 nm, respectively. A quartz cell with a 1 cm pathlength in both the excitation and emission directions was used for all measurements. For the drug titrations, 1.2 to 20 μL aliquots of drug (at concentrations ranging from 250 μM to 10 mM) were sequentially added to RNA solutions that were 1 μM in strand. After each addition, the sample was left to equilibrate for 3 minutes, whereupon the average emission intensity at 370 nm (I370) over a period of 30 seconds was recorded. The I370 values of all samples were corrected by subtraction of the corresponding values of buffer alone. Buffer conditions were identical to those described above for the UV melting experiments.
3.5. Isothermal titration calorimetry (ITC)
ITC measurements were performed at 25 °C on a MicroCal VP-ITC (MicroCal, Inc.; Northampton, MA). In a typical experiment, aliquots of drug were sequentially injected from a 250 μL rotating syringe (300 RPM) into an isothermal sample chamber containing 1.42 mL of an Ec solution. In the paromomycin experiment, 5 μL aliquots of 250 μM drug were injected into an Ec solution that was 10 μM in strand. In the G418 experiment, 10 μL aliquots of 2.5 mM drug were injected into an Ec solution that was 100 μM in strand. Each drug-RNA experiment was accompanied by the corresponding control experiment in which aliquots of the drug were injected into a solution of buffer alone. The duration of each injection was 5 sec in the paromomycin experiment and 10 sec in the G418 experiment. In all experiments, the initial delay prior to the first injection was 60 sec, and the delay between injections was 300 sec. Buffer conditions in all the ITC studies were identical to those described above for the UV melting experiments.
Each injection generated a heat burst curve (μcal/sec vs. sec). The area under each curve was determined by integration [using the Origin version 5.0 software (MicroCal, Inc.; Northampton, MA)] to obtain a measure of the heat associated with that injection. The heat associated with each drug-buffer injection was subtracted from the corresponding heat associated with each drug-RNA injection to yield the heat of drug binding for that injection. The resulting dilution-corrected injection heats were plotted as a function of the [drug]/[Ec] ratio {see Figures 5(c) and (d)} and fit with a model for two independent sets of binding sites, which we have previously determined to reflect primary (specific) and secondary (nonspecific) binding interactions.32,33 The ITC-derived values of Ka listed in Table 1 correspond to the specific binding interaction.
3.6. Time-resolved fluorescence anisotropy
Time-resolved fluorescence anisotropy experiments were conducted at 25 °C on a PTI LaserStrobe fluorescence lifetime spectrometer equipped with a thermoelectrically controlled cell holder. A sheet polarizer was placed in the emission direction and a Glan-Thompson type polarizer was placed in the excitation direction. A PTI Model GL-3300 nitrogen laser (at a 10 Hz frequency) was used to excite the samples at 337 nm, and fluorescence decay curves were acquired logarithmically at an emission wavelength of 410 nm (24 nm slitwidth) in 400 channels (with 5 laser shots per time point). The start and end delays of the acquisitions were 37 and 75 ns, respectively. The instrument response function was detected at 337 nm using light scattered by a dilute suspension of non-dairy creamer. Each final decay profile reflected an average of 10 independent scans and was deconvolved in the Felix32 program (PTI, Inc.). These decays were best fit by the following sum of three exponentials:
| (2) |
Goodness of fit was judged based on a reduction in χ2 and inspection of the autocorrelation function of the weighted residuals. The RNA concentration was 5 μM in strand, and, when present, RNA-saturating concentrations of drug were employed. These drug concentrations were as follows: [neomycin] = 20 μM, [paromomycin] = 40 μM, [ribostamycin] = 500 μM, and [G418] = 1.8 mM. Buffer conditions for these experiments were identical to those described above for the UV melting experiments.
Fluorescence intensity decays measured with the emission polarizer oriented either parallel {IVV(t)} or perpendicular {IVH(t)} to the excitation polarization were deconvolved simultaneously with a magic angle decay {D(t)} using the following relationships:
| (3a) |
| (3b) |
In these relationships, G is the instrumental correction factor and r(t) is the anisotropy decay, which was best fit by the following sum of two exponentials:
| (4) |
The limiting anisotropy at time zero {r(0)} was derived from the sum of β1 and β2. Values of G ranged from 1.07 to 1.11, and were determined using the following relationship:
| (5) |
Supplementary Material
Acknowledgments
We thank Dr. Smita S. Patel for use of her PTI LaserStrobe fluorescence lifetime spectrometer. This work was supported by NIH grant CA097123. M.K. was supported by an NIH postdoctoral fellowship (F32 AI62041). C.M.B. was supported by an NIH training grant (5T32 GM08319) in Molecular Biophysics.
Footnotes
Supplementary Material
Supplementary data associated with this article can be found in the online version.
Publisher's Disclaimer: This is a PDF file of an unedited manuscript that has been accepted for publication. As a service to our customers we are providing this early version of the manuscript. The manuscript will undergo copyediting, typesetting, and review of the resulting proof before it is published in its final citable form. Please note that during the production process errors may be discovered which could affect the content, and all legal disclaimers that apply to the journal pertain.
References
- 1.Bierzynski A, Kozlowska H, Wierzchowski KI. Biophys Chem. 1977;6:223–229. doi: 10.1016/0301-4622(77)85003-5. [DOI] [PubMed] [Google Scholar]
- 2.Bierzynski A, Kozlowska H, Wierzchowski KL. Biophys Chem. 1977;6:213–222. doi: 10.1016/0301-4622(77)85002-3. [DOI] [PubMed] [Google Scholar]
- 3.Lycksell PO, Gräslund A, Claesens F, McLaughlin LW, Larsson U, Rigler R. Nucleic Acids Res. 1987;15:9011–9025. doi: 10.1093/nar/15.21.9011. [DOI] [PMC free article] [PubMed] [Google Scholar]
- 4.Nordlund TM, Andersson S, Nilsson L, Rigler R, Gräslund A, McLaughlin LW. Biochemistry. 1989;28:9095–9103. doi: 10.1021/bi00449a021. [DOI] [PubMed] [Google Scholar]
- 5.Guest CR, Hochstrasser RA, Sowers LC, Millar DP. Biochemistry. 1991;30:3271–3279. doi: 10.1021/bi00227a015. [DOI] [PubMed] [Google Scholar]
- 6.Rachofsky EL, Osman R, Ross JBA. Biochemistry. 2001;40:946–956. doi: 10.1021/bi001664o. [DOI] [PubMed] [Google Scholar]
- 7.Rachofsky EL, Seibert E, Stivers JT, Osman R, Ross JBA. Biochemistry. 2001;40:957–967. doi: 10.1021/bi001665g. [DOI] [PubMed] [Google Scholar]
- 8.Tsujikawa L, Strainic MG, Watrob H, Barkley MD, deHaseth PL. Biochemistry. 2002;41:15334–15341. doi: 10.1021/bi026539m. [DOI] [PubMed] [Google Scholar]
- 9.Kaul M, Barbieri CM, Pilch DS. J Am Chem Soc. 2004;126:3447–3453. doi: 10.1021/ja030568i. [DOI] [PubMed] [Google Scholar]
- 10.Kaul M, Barbieri CM, Pilch DS. J Am Chem Soc. 2006;128:1261–1271. doi: 10.1021/ja056159z. [DOI] [PubMed] [Google Scholar]
- 11.Recht MI, Fourmy D, Blanchard SC, Dahlquist KD, Puglisi JD. J Mol Biol. 1996;262:421–436. doi: 10.1006/jmbi.1996.0526. [DOI] [PubMed] [Google Scholar]
- 12.Fourmy D, Recht MI, Blanchard SC, Puglisi JD. Science. 1996;274:1367–1371. doi: 10.1126/science.274.5291.1367. [DOI] [PubMed] [Google Scholar]
- 13.Vicens Q, Westhof E. Structure. 2001;9:647–658. doi: 10.1016/s0969-2126(01)00629-3. [DOI] [PubMed] [Google Scholar]
- 14.Vicens Q, Westhof E. J Mol Biol. 2003;326:1175–1188. doi: 10.1016/s0022-2836(02)01435-3. [DOI] [PubMed] [Google Scholar]
- 15.François B, Russell RJ, Murray JB, Aboul-ela F, Masquida B, Vicens Q, Westhof E. Nucleic Acids Res. 2005;33:5677–5690. doi: 10.1093/nar/gki862. [DOI] [PMC free article] [PubMed] [Google Scholar]
- 16.Marky LA, Breslauer KJ. Biopolymers. 1987;26:1601–1620. doi: 10.1002/bip.360260911. [DOI] [PubMed] [Google Scholar]
- 17.Gray DM, Ratliff RL. Biopolymers. 1975;14:487–498. doi: 10.1002/bip.1975.360140305. [DOI] [PubMed] [Google Scholar]
- 18.Gray DM, Ratliff RL, Vaughan MR. Methods Enzymol. 1992;211:389–406. doi: 10.1016/0076-6879(92)11021-a. [DOI] [PubMed] [Google Scholar]
- 19.Shandrick S, Zhao Q, Han Q, Ayida BK, Takahashi M, Winters GC, Simonsen KB, Vourloumis D, Hermann T. Angew Chem, Int Ed Engl. 2004;43:3177–3182. doi: 10.1002/anie.200454217. [DOI] [PubMed] [Google Scholar]
- 20.Blount KF, Zhao F, Hermann T, Tor Y. J Am Chem Soc. 2005;127:9818–9829. doi: 10.1021/ja050918w. [DOI] [PubMed] [Google Scholar]
- 21.Chambers HF. In: Basic and Clinical Pharmacology. Katzung BG, editor. McGraw-Hill; New York: 2004. pp. 764–772. [Google Scholar]
- 22.Puglisi JD, Blanchard SC, Dahlquist KD, Eason RG, Fourmy D, Lynch SR, Recht MI, Yoshizawa S. In: The Ribosome: Structure, Function, Antibiotics, and Cellular Interactions. Garrett RA, Douthwaite SR, Liljas A, Matheson AT, Moore PB, Noller HF, editors. ASM Press; Washington, D. C: 2000. pp. 419–429. [Google Scholar]
- 23.Karimi R, Ehrenberg M. Eur J Biochem. 1994;226:355–360. doi: 10.1111/j.1432-1033.1994.tb20059.x. [DOI] [PubMed] [Google Scholar]
- 24.Fourmy D, Yoshizawa S, Puglisi JD. J Mol Biol. 1998;277:333–345. doi: 10.1006/jmbi.1997.1551. [DOI] [PubMed] [Google Scholar]
- 25.Yoshizawa S, Fourmy D, Puglisi JD. EMBO J. 1998;17:6437–6448. doi: 10.1093/emboj/17.22.6437. [DOI] [PMC free article] [PubMed] [Google Scholar]
- 26.Yoshizawa S, Fourmy D, Puglisi JD. Science. 1999;285:1722–1725. doi: 10.1126/science.285.5434.1722. [DOI] [PubMed] [Google Scholar]
- 27.Carter AP, Clemons WM, Brodersen DE, Morgan-Warren RJ, Wimberly BT, Ramakrishnan V. Nature. 2000;407:340–348. doi: 10.1038/35030019. [DOI] [PubMed] [Google Scholar]
- 28.Ogle JM, Brodersen DE, Clemons WM, Jr, Tarry MJ, Carter AP, Ramakrishnan V. Science. 2001;292:897–902. doi: 10.1126/science.1060612. [DOI] [PubMed] [Google Scholar]
- 29.Vicens Q, Westhof E. Chem Biol. 2002;9:747–755. doi: 10.1016/s1074-5521(02)00153-9. [DOI] [PubMed] [Google Scholar]
- 30.Zhao F, Zhao Q, Blount KF, Han Q, Tor Y, Hermann T. Angew Chem, Int Ed Engl. 2005;44:5329–5334. doi: 10.1002/anie.200500903. [DOI] [PubMed] [Google Scholar]
- 31.Plum GE. In: Current Protocols in Nucleic Acid Chemistry. Beaucage SL, Bergstrom DE, Glick GD, Jones RA, editors. John Wiley & Sons; New York: 2000. pp. 7.3.1–7.3.17. [Google Scholar]
- 32.Kaul M, Barbieri CM, Kerrigan JE, Pilch DS. J Mol Biol. 2003;326:1373–1387. doi: 10.1016/s0022-2836(02)01452-3. [DOI] [PubMed] [Google Scholar]
- 33.Kaul M, Pilch DS. Biochemistry. 2002;41:7695–7706. doi: 10.1021/bi020130f. [DOI] [PubMed] [Google Scholar]
Associated Data
This section collects any data citations, data availability statements, or supplementary materials included in this article.