

Abstract
Background:
Ultrahigh-field MRI at 8 T offers unprecedented resolution for imaging brain structures and microvasculature.
Objective:
The aim of this study is to apply high-resolution MRI for stroke imaging and to characterize findings at 1.5 and 8 T.
Methods:
Seventeen subjects with minor ischemic infarcts were studied using T2-weighted gradient echo (GE) and rapid acquisition with relaxation enhancement (RARE) images at 8 T with resolution up to 200 μm. In 10 subjects, T1- and T2-weighted fast spin echo (FSE) and fluid-attenuated inversion recovery (FLAIR) images were also acquired at 1.5-T MRI.
Results:
The 8-T images showed infarcts as sharply demarcated areas of high-signal intensity (n=21) and revealed more infarctions than 1.5-T images (n=14) (P <.003). The low-signal intensity areas that surrounded infarctions were suggestive of hemosiderin deposits. The 8-T characteristics of microvessels terminating within the infractions were distinct from normal vasculature. The 8-T images revealed an angioma at the site of a second stroke, not apparent on 1.5-T images.
Conclusions:
Ultrahigh-field MRI at 8 T is feasible for stroke imaging. The 8-T MRI visualized infarcts and microvasculature with high resolution, revealing infarcts and vascular pathologies that were not apparent at 1.5 T.
Keywords: Ultrahigh-field MRI, 8 T, Stroke, Vasculature, Infarcts
1. Introduction
Ischemic stroke is a common health problem and the leading cause of disability. Magnetic resonance-based techniques provided evidence that small-vessel cerebrovascular disease, a common cause of stroke, is frequent among otherwise healthy older adults. Elevated levels of plasma iron, hemorrhages and intraparenchymal hemosiderin deposits are associated with aging, progression of neuro-logical disorders [1] and adverse outcome after stroke. Periventricular hyperintensities are common findings on T2-weighted MR images in elderly people [2,3]. Evidence exists that subcortical hyperintensities reflect areas of hypoperfusion, arising as a consequence of longstanding effects of vascular risk factors on cerebral microvasculature [4-6]. Silent infarctions that are revealed on routine MR images of 28% of the elderly and 68% of stroke patients [7] support this notion. Ultrahigh-field MRI at 8 T provided a high signal-to-noise ratio and an unprecedented resolution for structural and microvascular imaging [8-10]. Increased sensitivity to iron and iron-related products [8,9] further enhanced resolution for microvascular and venous imaging [10,11]. The 8-T MRI allowed to image microangiopathy associated with hypertension [12], and visualized perivascular iron deposits, suggestive of blood–brain barrier breakdown [13]. This study reviews our experience with ischemic stroke imaging at ultrahigh field at 8 T and provides comparisons with clinical 1.5-T MRI.
2. Methods
2.1. The 8-T MRI
Studies were performed with an 8-T 80-cm magnet (Magnex Scientific, Abingdon, England). Images were acquired using a custom-built radiofrequency front end on a commercial console (Bruker, Billerica, MA). A modified two-port quadrature drive 16-strut transverse electromagnetic radiofrequency volume coil was individually tuned on the head of each subject using quadrature excitation. A conventional two-dimensional multislice gradient echo (GE) sequence was used to encode the images. A 260-μs gradient spoiling pulse along the slice direction was applied to reduce residual transverse coherence. Gradient echo images were acquired in 2-, 3- and 5-mm slices (3-mm skip) taken in the axial plane with a 20×20-cm field of view (FOV) and encoded into square 512×512 and 1024×1024 pixel matrices, producing an in-plane pixel size of 390 and 195 μm, respectively. Repetition time (TR=600 ms) was selected to maintain a reasonable imaging time of up to 13 min with adequate signal-to-noise ratio. To increase the degree of contrast and T2*-weighting, the nutation angle was set to approximately 20° and the echo time (TE) was set to 12 ms. A receiver bandwidth of 50 kHz was used. These parameters, known to enhance visualization of microvasculature, were derived from our previous experience with 8-T imaging. Gradient echo 8-T magnitude images were processed using the phase contrast enhancement method [14], which improves the contrast between the gray and white matter structures. In general, the higher the iron content or subvoxel field inhomogeneities yield, the greater the contrast and the resultant phase shifts. Rapid acquisition with relaxation enhancement (RARE) images were acquired in some subjects.
2.2. The 1.5-T MRI
Conventional MRI at 1.5 T was repeated in 10 subjects using a commercial system (General Electric Signa, Waukesha, WI) within 1 month after the 8-T studies. T1- and T2-weighted fast spin echo (FSE) and fluid-attenuated inversion recovery (FLAIR) scans were obtained with the parameters comparable to the initial work-up.
2.3. Statistical analysis
Nonparametric Wilcoxon/Kruskal-Wallis test and χ2 test were used to compare number of infarctions and white matter lesions on 1.5- and 8-T images.
3. Subjects
Studies were conducted in the Center for Advance Magnetic Resonance Imaging and at the Autonomic Nervous System Laboratory at the Department of Radiology and Neurology at The Ohio State University. All subjects signed informed consent approved by the OSU Institutional Review Board. An FDA exemption for use of an investigational device was obtained. Stroke patients participating in this 8-T MRI study were selected from a larger cohort evaluating the effects of a minor chronic ischemic stroke on cerebral vasoregulation [15]. All subjects were screened using a detailed protocol including medical history, routine laboratory examinations, transcranial Doppler evaluations and 24-h ambulatory blood pressure monitoring. A normal carotid Doppler ultrasound study (AU5 Biosound Esaote) was required for participation.
3.1. Stroke group
Seventeen subjects (12 women and 5 men), mean age of 51.3±6.8 years with a history of ischemic stroke or transient ischemic attack (TIA), were studied. Subjects were included if they had a minor stroke affecting <1/3 of vascular territory resulting in a minor neurological deficit (Modified Rankin Score Scale <3), and were at least 2 months after an acute stroke. All subjects had routine CT or 1.5-T MRI imaging studies during their clinical workup. The 8-T MRI was not done in acute phase. Upon admission, 5 subjects were diagnosed with TIA and 12 subjects with ischemic stroke. Subjects with hemorrhage, bioimplants, diabetes, arrhythmias, cardiac and renal disease other than hypertension were excluded. Ten subjects were normotensive, seven were treated for hypertension, one for Parkinson’s disease. Antihypertensive and anticoagulant medications were allowed during the MRI studies.
4. Results
For all stroke subjects, MRI findings at 1.5 and 8 T, presenting clinical symptoms, stroke etiology and comorbidity, are summarized in the Table 1. Infarctions were recognized on both 8- and 1.5-T images as sharply demarcated areas of high-signal intensity, located in the gray matter, white matter and basal ganglia. The 8-T GE images showed the greater number of infarctions (N=21) compared to the 1.5-T images (n=14) (P<.003) (Table 2). On 8-T images, cortical infarctions appeared extended into the white matter and were surrounded by areas of low-signal intensity, indicative of iron and blood product deposits. Small arteries and veins were seen as dark lines with low, but homogenous, signal intensity at 8-T GE images with TE>4 ms. Vascular patterns appeared more prominent in the infarcted compared to the noninfarcted hemisphere. Small vessels were visualized supplying or terminating within the infarctions. On some 8-T GE images, these vessels appeared bright with high, but inhomogeneous, signal intensity compared to the normal vessels and the surrounding tissue. Subcortical hyperintensities were visible on the 8-T images within the periventricular white matter, the basal ganglia and the corona radiata that were not apparent on the 1.5-T images. Incidental angiomas and venous cavernomas, iron deposits (perivascularly and within brain tissue), and calcification of the falx cerebri were seen on 8-T images that were not apparent on 1.5-T images. Case 1 documents findings of a “silent” angioma at the site of a subsequent hemorrhagic stroke. Figs. 1-7 illustrate findings on 1.5- and 8-T MRI, highlighting the relationship of infarcts to microvasculature, the details of the infarct site and incidental vascular lesions.
Table 1.
Demographic characteristics, neurological symptoms and 1.5- and 8-T MRI findings
| No. | Sex, race | Age | Diagnosis/side, etiology | Neurological symptoms | 1.5-T MRI | 8-T MRI |
|---|---|---|---|---|---|---|
| 1 | F, AA | 40 | Stroke L NTN, cardioembolism | RUE/LLE numbness, aphasia | L temporal infarct, silent infarcts L frontal, L parietal | L temporal hemorrhagic infarct, silent infarcts L frontal, L parietal, angioma |
| 2 | F, W | 63 | TIA L NTN, undetermined | RUE weakness, R face numbness, resolved <24 h | Normal | L temporal hemorrhagic infarct, angioma, WMC (7) |
| 3 | F, W | 45 | TIA L NTN, small vessel | RUE numbness, slurred speech | Normal | L temporal lacunar infarcts (2), WMC (3) |
| 4 | M, W | 51 | Stroke R NTN, cardioembolism | LLE hemiparesis, L facial droop | R basal ganglia infarct, WMC (6) | R basal ganglia hemorrhagic infarct, WMC (10) |
| 5 | M, AA | 45 | Stroke L HTN, small vessel | R hemiplegia | L basal ganglia infarct | L basal ganglia hemorrhagic infarct, revascularization, vacuolization |
| 6 | F, W | 48 | TIA L NTN, undetermined | RUE weakness, resolved <24 h | Normal | L temporal infarct, WMC (4) |
| 7 | F, W | 61 | TIA R NTN, undetermined | LLE weakness, dysarthria, ataxia, resolved <24 h | Normal, WMC (6) | R frontal infarct, WMC (4) |
| 8 | F, AA | 51 | Stroke R HTN, PFO, small vessel | LUE/LLE weakness, L face asymmetry, slurred speech | R basal ganglia infarct, L frontal silent infarct | R basal ganglia infarct, poor quality images |
| 9 | F, W | 57 | Stroke R HTN, PD, small vessel | LUE weakness | R temporal infarct | R temporal infarct, WML periventricular |
| 10 | F, W | 52 | Stroke R NTN, small vessel | LLE weakness | Normal | R basal ganglia infarct, R frontal silent infarct |
| 11 | M, AA | 55 | Stroke L HTN, cardioembolism | R hemiparesis, speech arrest | L frontal infarct, R frontal silent infarct | L frontal infarct, R frontal silent infarct, cavernoma |
| 12 | F, W | 53 | Stroke L HTN, undetermined | L hemiparesis, aphasia | L temporal infarct | L temporal infarct, WMC (2) |
| 13 | F, W | 39 | Stroke L NTN, undetermined | Hemianopsia, headache | L temporal infarct | L temporal infarct, falx ossification |
| 14 | F, AA | 57 | Stroke R HTN, undetermined | RUE/LLE weakness, numbness | R frontal infarct, WMC (7) | R frontal infarct, L silent lacunar infarct, WMC (9) |
| 15 | F, W | 41 | TIA L HTN, small vessel | RUE/LLE numbness | Normal | L temporal infarct |
| 16 | M, W | 57 | Stroke R NTN, cardioembolism | L hemiparesis | CT normal, no MRI | R basal ganglia infarct |
| 17 | M, W | 52 | Stroke R HTN, small vessel | LUE/LLE weakness | R parietal infarct | R parietal infarct, WML (3), Falx ossification |
HTN=hypertensive, PFO=patent foramen ovale, NTN=normotensive, R=right hemisphere, L=left hemisphere, RUE=right upper extremity, LUE=left upper extremity, PD=Parkinson's disease, LLE=left lower extremity, WMC=punctuate white matter changes.
Table 2.
Comparisons of 1.5-T FSE and 8-T GE MRI
| 1.5-T FSE | 8-T GE | P | |
|---|---|---|---|
| Infarctions | 14 | 23 | .003 |
| WMC | 19 | 42 | NS |
| Angiomas/cavernomas | 0 | 4 | NS |
| Falx ossifications | 1 | 2 | NS |
Fig. 1.
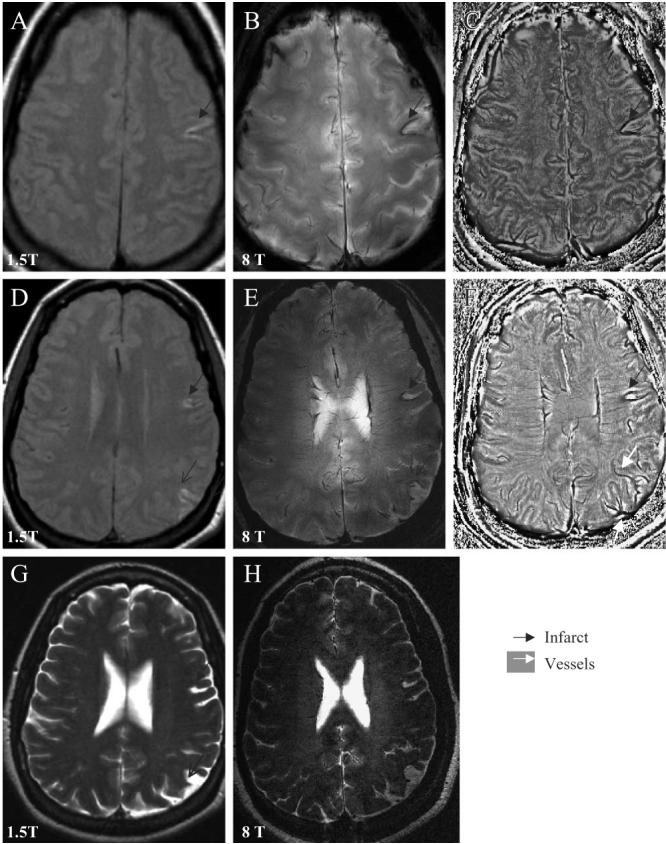
Axial slices through the cortex show the left temporal infarct (black arrow) with iron deposits surrounding the infarct site, the old parietal infarct (black thin arrow) on the 1.5-T T1-weighted FSE images (A, D), 8-T GE magnitude images (B, E) and the corresponding phase images (C, F). Asymmetry of the vascular supply in the infarcted and noninfarcted hemispheres, and venous drainage to the left parietal infarction are better seen on the 8-T GE phase images (C, F). The 1.5-T T2-weighted FSE image (G) and 8-T RARE image (H) reveal of the left frontal, temporal (black arrow) and parietal infarcts (black thin arrow). The 8-T GE: BW=50 kHz, FOV=20×20 cm2, slice thickness=5.0 mm, TR=528.3 ms, TE=7.0 ms, matrix 512×340, flip angle=20°. The 8-T RARE: BW=69.4 kHz, FOV=20×20 cm2, slice thickness=2 mm, TR=3000 ms, TE=2 ms, matrix 512×512, flip angle=68°. The 1.5-T T1-weighted FSE: slice thickness 5 mm, TR=500 ms, TE=14 ms, FOV=22×22 cm2, matrix=256×192, number of slices=16; 1.5-T T2-weighted FSE: slice thickness=5 mm, TR=7000 ms, TE=105 ms, FOV=22×6 cm2, matrix=128×128, number of slices=16.
Fig. 7.

An axial 8-T RARE image at the level of the ventricles shows the infarction in the left basal ganglia (black full arrow). A low-signal intensity area surrounding the infarction and two smaller areas within the infarction suggest of hemosiderin and blood product deposits (black diamond). High-signal punctuate areas within the infarct are suggestive of infarct consolidation and vacuolization (white empty arrow). Small vessels are visible within the infarction as lines of signal void (white arrow). The 8-T RARE: BW=50 kHz, FOV=20×20 cm2, slice thickness=2 mm, TR=2500 ms, TE=20 ms, matrix=512×512.
4.1. The 1.5- and 8-T MRI of stroke
Fig. 1 shows 8- and 1.5-T MR images that were acquired from a 40-year-old woman 1 year after the acute ischemic stroke that presented as expressive aphasia, right-sided numbness that resolved with a minor deficit (Table 1, case 1). The cortical left temporal infarct and old left parietal and left frontal infarcts were seen on the axial slices through the cortex on the 1.5-T T1-weighted FSE (A, D) and T2-weighted FSE (G) images, as well as on the 8-T GE (B, E) and 8 T RARE (H) images. The 8-T GE magnitude images (B, E) were processed using the phase enhancement method [14] to create the phase images (C, F). The left temporal infarct had a typical V shape on both 1.5- and 8-T images. Both magnitude and phase GE images at 8 T showed hemosiderin deposits surrounding the infarction. Medullary veins had normal, signal-void pattern, perpendicular to the ventricles. Phase images (C, F) showed that vascular patterns in the infarcted hemisphere were more prominent compared to the noninfarcted hemisphere and displayed venous drainage to the left parietal infarction. Delineation between the gray and white matter and vascular patterns were enhanced on the 8-T phase images compared to magnitude images. High-resolution axial 8-T GE magnitude images (Fig. 2) display the details of the left temporal and parietal infarcts described in Fig. 1. The infarction is surrounded by a low-signal intensity area, suggestive of intraparenchymal iron deposits (A–D). Normal-appearing medullary veins were seen as linear signal voids perpendicular to the ventricle (C). Small vessels crossing or adjacent to the infarctions (C, D) appeared prominent compared to vasculature in the noninfarcted hemisphere, which may be suggestive of blood flow alteration or a higher deoxyhemoglobin content (D–F).
Fig. 2.

High-resolution axial 8-T GE slices display details, consolidation and venous drainage of the left temporal (A–D) and parietal infarctions (E, F), shown in Fig. 1. Infarctions with high-signal intensity are surrounded by a low-signal intensity area, suggestive of iron deposits extending into the white matter. Normal-appearing medullary veins and cortical penetrating veins are seen as signal voids (white arrow). Details of vascular patterns in the left parietal infarction are seen on slices E and F. The 8-T GE: BW=69.4 kHz, FOV=20×20 cm2, slice thickness=2.3 mm, TR=602.7 ms, TE=10.0 ms, matrix=1024×1024, number of slices=18.
The subject suffered from the second hemorrhagic cortical stroke 2 years later and was imaged with 1.5-T MRI only. Fig. 3 shows an axial 1.5-T FSE T2-weighted image of the left hemispheric infarct (A). We have reviewed 8-T GE images that were obtained 2 years prior to this event. High-resolution 8-T GE slices through the cortex (B–D) revealed a cortical angioma in the location of the second hemorrhagic infarct. The angioma-feeding vessel appeared hyperintense with a low-signal intensity border. Punctuate white matter lesions (3−4) were seen scattered within this area. A distended superficial cortical vein was clearly visible in the left temporal region.
Fig. 3.
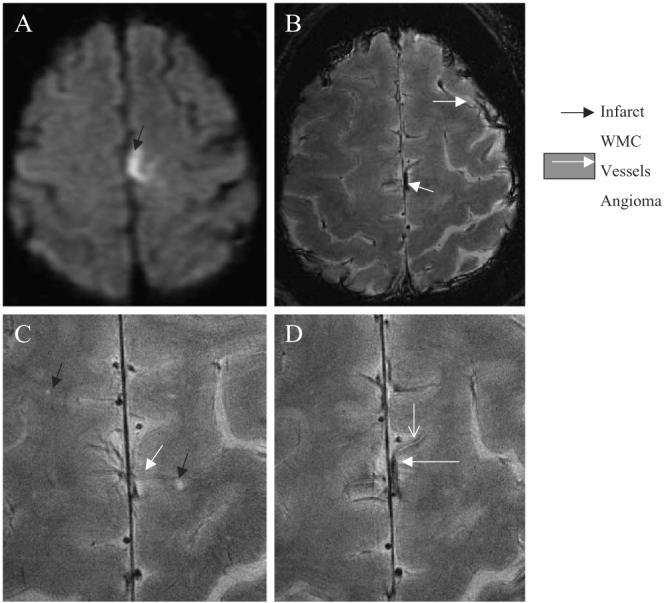
Axial 1.5-T FLAIR image of the second subacute left hemorrhagic hemispheric infarct (A) (black arrow). High-resolution 8-T GE images (B-D) that were obtained 2 years prior to acute event show an angioma in the same location (white arrow), prominent superficial and scattered punctuate white matter changes (black arrow) (C). The angioma feeding vessel shows a high-signal intensity surrounded by a low-signal intensity rim, suggestive of iron deposits. The 8-T GE: BW=69.4 kHz, FOV=20×20 cm2, slice thickness=2.3 mm, TR=602.7 ms, TE=10.0 ms, matrix=1024×1024, N=18. The 1.5-T FLAIR: slice thickness=5 mm, TR=10000 ms, TE=140 ms, inversion time, TI=2200, matrix=192×256, number of slices=16.
Fig. 4 shows comparisons of 1.5-T FLAIR and T2-weighted FSE and 8-T GE and RARE images that were acquired from a 63-year-old woman 2 months after a transient episode of right-face and a right-upper extremity weakness (Table 1, case 2). The 1.5-T FLAIR (A) and the T2-weighted FSE (C) images at the level of ventricles were unremarkable, except for few small white matter changes in the corona radiata and the pons. Left temporal hemorrhagic infarction was seen on the 8-T GE (B) and the RARE (D) slices as a characteristic high-signal intensity area with a low-intensity border. On the 8-T RARE images, the infarction appeared to extend into the white matter. An incidental venous angioma (E, F) in the right periventricular white matter was seen on the 8-T GE images, which was not apparent on 1.5-T images.
Fig. 4.

The 1.5-T FLAIR (A) and T2-weighted FSE (C) images at the level of the ventricles were unremarkable. The 8-T GE image (B) shows the left temporal hemorrhagic infarct as a high-signal intensity area (black arrow) with a low-signal intensity boundaries. The infarction appeared larger on the 8-T RARE image (D). The 8-T GE images (E, F) show an incidental angioma (white arrow) in the right periventricular white matter that was not apparent on the 1.5-T images. The 8-T GE: BW=50 kHz, FOV=20×20 cm2, slice thickness=5 mm, TR=750 ms, TE=10 ms, matrix=512×512. The 8-T RARE: BW=50 kHz, FOV=20×20, slice thickness=5 mm, TR=750 ms, TE=10 ms, matrix=512×512. The 1.5-T FLAIR: TR=4000 ms, TE=148.5 ms. The 1.5-T T2-weighted FSE: TR=5417 ms, TE=104 ms.
4.2. Microvascular patterns in the infarcted hemisphere
The relationship of the lacunar infarctions and penetrating small vessels is demonstrated on the high-resolution 8-T GE and RARE images (Fig. 5 A, B) obtained from a 45-year-old woman with a history of recurrent TIAs (Table 1, case 3). Normal medullary veins are seen as dark lines that run in parallel to the left temporal lacunar infarction. Fig. 5 C shows the second lacunar infarction at the termination of a small penetrating vessel. This vessel shows an inhomogeneous high- and low-signal intensity pattern. The proximal segment appears as a dark line of the signal “void,” typical for normal blood flow that is replaced by high-signal intensity in a distal segment. The vessel terminates in a high-signal intensity area, suggestive of a lacunar infarction. Fig. 5 D is an 8-T RARE image that shows both infarcts, the vessel with mixed signal intensity and punctuate white matter changes. The 1.5-T MRI was not repeated. The pattern of vessels with inhomogeneous signal intensity was distinct from characteristic “signal-void” vessels that has been demonstrated in healthy volunteers.
Fig. 5.

High-resolution axial 8-T GE slices show the left temporal lacunar infarction (A–C) as high-signal intensity area and normal-appearing penetrating vessels as linear signal voids. Panel C shows the cortical vessel with inhomogeneous signal intensity (white arrow) (C). This vessel terminates in a high-signal intensity area, suggestive of the second lacunar infarction (black arrow). The normal pattern of signal void is replaced in a distal vessel segment by high-signal intensity. The 8-T RARE image (D) shows both infarctions (black arrows), cortical vessel with inhomogeneous signal (white arrow) and additional punctuate white matter changes (black diamond). Gradient echo and RARE images were acquired with the following parameters: GE: BW=69.4 kHz, FOV=20×20 cm2, slice thickness 2.3 mm, TR=600 ms, TE=10 ms, matrix 1024×1024; RARE: BW=69.4 kHz, FOV=20×20 cm2, slice thickness=2 mm, TR=3000 ms, TE=22 ms, matrix=512×512, RARE factor 4.
Fig. 6 shows six high-resolution 8-T MR GE images (A–F) demonstrating microvascular patterns associated with the right basal ganglia embolic infarct in a 51-year-old man (Table 1, case 4). Fig. 6A and B illustrates the small vessel terminating within the lacunar infarct. Punctuate foci of low-signal intensity that are seen at the endings of this vessel are suggestive of hemosiderin residuals following an embolic event. Another vessel with a higher signal intensity that is surrounded by a low-signal intensity area is seen laterally to the infarction (A). Fig. 6D–F demonstrates communicating branches of the right middle cerebral artery. Additional minute white matter hyperintensities within the right temporal region are suggestive of the small-vessel disease. The 1.5-T comparisons of this case and the case 11 have been reported [16,17].
Fig. 6.
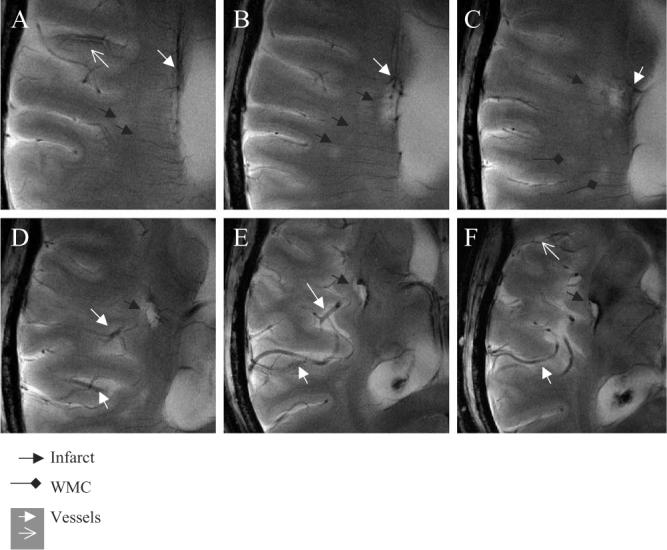
The 8-T GE slices (A–F) demonstrate vascular supply to the lacunar infarctions and vascular patterns in the infarcted region. A small vessel is seen terminating within the lacunar infarction (black arrow) (A), ending with the low-signal intensity foci (A, B). A cortical penetrating vessel with the lumen of high-signal intensity and the low-signal intensity edge (white empty arrow) is seen in this region (A, F). Punctuate areas of signal hyperintensity, suggesting white matter changes (black diamonds) and small infarctions, are seen in this area (black arrows) (A–C). Branches of the right middle cerebral artery supplying the infarcted area appeared prominent (D–F). A larger area of low signal suggestive of iron deposits extends beyond infraction into the basal ganglia. The 8-T GE: BW=50 kHz, FOV=20×20 cm2, slice thickness=3.0 mm, TR=800 ms, TE=20 ms, matrix=1024×1024 (in-plane pixel size, 195 μm).
4.3. Infarct site
The high-resolution 8-T RARE image at the level of the ventricles shows details of the left basal ganglia infarction. The 8-T images were acquired 6 months after an acute stroke, from a 45-year-old man with a history of the right-sided hemiplegia (Fig. 7) (Table 1, case 5). Initial 1.5-T scans were not repeated. The left basal ganglia infarct was seen as a high-intensity signal area, adjacent to the ventricle. A low-signal intensity area, surrounding the infarct, extended into the white matter. Two low-signal intensity areas within the infarct, adjacent to the ventricle, were suggestive of hemosiderin deposits. Punctuate areas of high-signal intensity were suggestive of infarct consolidation and vacuolization. Small vessels that were visible within the infarcted area had a characteristic low-signal intensity appearance and similar size as cortical vessels within noninfarcted regions.
The 8-T images (1) documented more infarctions compared to 1.5-T images, (2) revealed details of the infarct site, (3) illustrated perivascular and intraparenchymal iron deposits, (4) showed the asymmetry in vascular patterns in the infarcted compared to the noninfarcted hemisphere and (5) documented angiomas at the site of a subsequent stroke.
5. Discussion
Ultrahigh-field MRI at 8 T provided new insights into stroke imaging. The 8-T MR images demonstrated infarctions with unprecedented resolution, and revealed lesions that were not apparent at the 1.5-T MRI. The 8-T images have shown a relationship between infarctions and microvasculature, prominent vascular patterns in the infarcted hemisphere and hemosiderin deposits perivascularly and within brain tissue. The chronic infarctions appeared on 8- and 1.5-T images as sharply demarcated areas of high-signal intensity. The infarct size and location were similar on both MR modalities, despite the fact that the 8-T images were GE and the 1.5-T images were FSE. The 8-T images are, in part, T2 weighted. Due to the very short T2 relaxation times at high field, these short TE times are actually associated with greater T2-weighting at the ultrahigh magnetic field.
The areas of low-signal intensity, assumed to reflect hemosiderin deposits, surrounded the infarctions, extending beyond the infarct site into gray and white matter. These signal-void areas were more prominent on the 8-T compared to the 1.5-T images. It is not clear if this phenomenon is related to the product tracings along the perivascular spaces [16] or blood product deposits associated with blood–brain barrier breakdown in the occluded vessel territory. Embolic etiologies of stroke were indicated by the signal-void endings of the vessels terminating in the lacunar infarctions and in the punctuate white matter lesions (Fig. 6B). Atherothrombotic etiologies were indicated by hyperintense cortical penetrating vessels terminating within the lacunar infarctions. In these vessels, a normal low signal was replaced by a high signal in a segment proximal to the infarction. This pattern of signal intensity may reflect differences in magnetic susceptibility of the local field reflecting hyalinic transformation of the vessel wall, and/or arose from blood flow alterations. Iron deposits have been associated with Alzheimer’s disease, Parkinson’s disease, multiinfarct dementia and adverse outcome after strokes [1]. Visualization of microvessels and tissue iron deposits can be helpful for the diagnosis of small-vessel atherosclerosis [18]. Quantification of tissue iron may serve as a marker of small-vessel disease, indicating an increased permeability of the blood–brain barrier with small-vessel disease and after a stroke.
The 8-T images have shown prominent laterality of vascular patterns in the infarcted compared to the non-infarcted hemisphere, suggesting greater deoxyhemoglobin effects in the infarcted hemisphere. This notion is supported by blood flow asymmetry on transcranial Doppler recordings, obtained from this cohort that showed slower blood flow velocities, and reduced vasomotor reactivity in the middle cerebral arteries in infarcted hemispheres [15]. Angiographic findings suggested that laterality of the posterior cerebral artery has indicated presence of collateral flow in patients with the middle cerebral artery occlusions [19]. The 8-T images revealed angiomas and cavernomas that were not apparent on the 1.5-T images or appeared smaller. In one case, an incidental angioma seen on the 8-T images is in the location of the future hemorrhagic stroke (Fig. 3).
Ultrahigh-field MRI can generate greater resolution and higher signal-to-noise contrast for imaging of venous structures within brain tissue, based on blood oxygenation level-dependent (BOLD) contrast [20]. The 8-T GE sequences with relatively short echo times (TE<10 ms) have been shown to be very sensitive to brain structures containing significant concentrations of paramagnetic materials, including deoxyhemoglobin contrast in venous blood and iron in the deep gray matter nuclei [10,21]. This property has been demonstrated in healthy volunteers [22], as well as in patients with stroke [17] and hypertension [12]. However, venous imaging is not a unique feature of the ultrahigh-field MRI, and high-resolution BOLD-venographic images have been obtained at 1.5 and 3 T [23-25]. This technique uses negative and positive phase image processing to suppress the arteries and to better delineate conspicuity of the vessel network within the brain parenchyma [24]. Intracranial and cervical time-of-flight angiography [26], recently implemented at 3T, has demonstrated improved image quality and higher sensitivity for depiction of intracranial aneurysms compared to the 1.5 T [27]. Regional blood flow increases in response to greater neuronal activity are associated with an increase of oxyhemoglobin and a relative reduction of deoxyhemoglobin. At 7 T, these features enabled generation of high-resolution functional blood flow augmentation maps that provided high spatial accuracy of functional and anatomical areas of interest [28,29].
There are some limitations for clinical imaging at ultrahigh magnetic field. The signal can be lost as a result of an increase in magnetic susceptibility artifacts and changes in relaxation times (longer T1 times, shorter T2 and T2* times) [30,31]. Susceptibility artifacts, increasing with the field strength, may affect image quality, and in some cases, even preclude detailed evaluations of the areas closer to the sinuses. Nonetheless, methods do exist to overcome macroscopic susceptibility distortions, although these may also result in loss of the desired imaging contrast. In addition, current radiofrequency coils do not produce a perfectly homogeneous field and required to be tuned individually for every subject, prolonging the preparation time. At present, venous and arterial vasculature cannot always be well differentiated on 8-T GE images. Implementation of time-of-flight MRA and contrast agents may overcome this limitation. With increasing signal-to-noise ratio, however, the higher quality imaging could be achieved because of the smaller voxel sizes and faster acquisition times. Exclusion of subjects with any bioimplants may limit clinical studies in older people. This study was focused on chronic infarctions and the procedure was well tolerated by the subjects. The 1.5-T MRI was not repeated in all subjects.
In summary, this study provided systematic insights into the clinical imaging at ultrahigh magnetic field, and demonstrated feasibility of 8-T MRI for stroke imaging. The 8-T images have demonstrated (1) a greater number of observed infarctions compared to 1.5-T MRI, (2) patterns of microvasculature associated with lacunar infarctions and (3) details of infarct site with an unprecedented resolution. High-field MRI has high susceptibility to iron-related products that provides a unique opportunity to track iron depositions. A general relationship among infarctions, iron deposits and microvasculature warrants more extensive investigations and therapeutic interventions given their importance for neurological disorders and stroke.
Acknowledgments
This study was sponsored by the American Heart Association grant 9930119N to V. Novak, by The Ohio State University General Clinical Research Center grant NIH-5 MOI-RR00034, by The Older American Pepper Center grant 2P60 AG08812−11 research resource cores A and B, and the Beth Israel Deaconess Medical Center General Clinical Research Center grant MO1-RR01302.
References
- 1.Dobson J. Magnetic iron compounds in neurological disorders. Ann N Y Acad Sci. 2004;1012:183–92. doi: 10.1196/annals.1306.016. [DOI] [PubMed] [Google Scholar]
- 2.deGroot JC, de Leeuw FE, Ouderk M, Hofman A, Jolles J, Breteler MM. Cerebral white matter lesions and subjective cognitive dysfunction: the Rotterdam Scan Study. Neurology. 2001;56:1539–41. doi: 10.1212/wnl.56.11.1539. [DOI] [PubMed] [Google Scholar]
- 3.Wahlund LO, Barkhof F, Fazekas F, Bronge L, Augustin M, Sjogren M, et al. A new rating scale for age-related white matter changes applicable to MRI and CT. Stroke. 2001;32:1318–22. doi: 10.1161/01.str.32.6.1318. [DOI] [PubMed] [Google Scholar]
- 4.Marstrand JR, Garde E, Rostrup E, Ring P, Rosenbaum S, Mortensen EL, et al. Cerebral perfusion and cerebrovascular reactivity are reduced in white matter hyperintensities. Stroke. 2002;34:972–6. doi: 10.1161/01.str.0000012808.81667.4b. [DOI] [PubMed] [Google Scholar]
- 5.Pantoni L, Garcia JH. Pathogenesis of leukoaraoisis: a review. Stroke. 1997;28:652–9. doi: 10.1161/01.str.28.3.652. [DOI] [PubMed] [Google Scholar]
- 6.Inzitari D. Leukoaraiosis: an independent risk factor for stroke? Stroke. 2003;34:2067–71. doi: 10.1161/01.STR.0000080934.68280.82. [DOI] [PubMed] [Google Scholar]
- 7.Price TR, Manolio TA, Kronmal RA, Kittner SJ, Yue NC, Robbins J, et al. Silent brain infarction on magnetic resonance imaging and neurological abnormalities in community-dwelling older adults. Stroke. 1997;28:1158–64. doi: 10.1161/01.str.28.6.1158. [DOI] [PubMed] [Google Scholar]
- 8.Robitaille PML, Abduljalil AM, Kangarlu A, Zhang X, Yu Y, Burgess RE, et al. Human magnetic resonance imaging at 8T. NMR Biomed. 1998;11:263–5. doi: 10.1002/(sici)1099-1492(199810)11:6<263::aid-nbm549>3.0.co;2-0. [DOI] [PubMed] [Google Scholar]
- 9.Abduljalil AM, Kangarlu A, Zhang X, Burgess RE, Robitaille PML. Acquisition of human multislice images at 8T. J Comput Assist Tomogr. 1999;23:335–40. doi: 10.1097/00004728-199905000-00001. [DOI] [PubMed] [Google Scholar]
- 10.Bourekas E, Christiforidis G, Abduljalil AM, Kangarlu A, Chakeres DM, Spigos D, et al. High resolution MRI of deep gray nuclei at 8 Tesla. J Comput Assist Tomogr. 1999;23:866–7. doi: 10.1097/00004728-199911000-00009. [DOI] [PubMed] [Google Scholar]
- 11.Burgess RE, Yu Y, Abduljalil AM, Kangarlu A, Robitaille PML. High signal to noise FLASH imaging at 8 Tesla. Magn Reson Imaging. 1999;17:1099–103. doi: 10.1016/s0730-725x(99)00072-7. [DOI] [PubMed] [Google Scholar]
- 12.Novak V, Abduljalil AM, Kangarlu A, Slivka AP, Bourekas E, Novak P, et al. Intracranial ossifications and microangiopathy at 8 Tesla MRI. Magn Reson Imaging. 2001;19:1133–7. doi: 10.1016/s0730-725x(01)00447-7. [DOI] [PubMed] [Google Scholar]
- 13.Novak P, Novak V, Kangarlu A, Abduljalil A, Chakeres D, Robittaille PM. High resolution MRI of the brainstem at 8 Tesla. J Comput Assist Tomogr. 2001;25:242–6. doi: 10.1097/00004728-200103000-00016. [DOI] [PubMed] [Google Scholar]
- 14.Abduljalil A, Schmalbrock P, Novak V, Chakeres DW. Enhanced gray and white matter contrast of phase susceptibility-weighted images in ultra-high field magnetic resonance imaging. J Magn Reson Imaging. 2003;18:284–90. doi: 10.1002/jmri.10362. [DOI] [PubMed] [Google Scholar]
- 15.Novak V, Chowdhary A, Farrar B, Nagaraja H, Braun J, Kanard R, et al. Altered cerebral vasoregulation in hypertension and stroke. Neurology. 2003;60:1657–63. doi: 10.1212/01.wnl.0000068023.14587.06. [DOI] [PubMed] [Google Scholar]
- 16.Chakeres D, Abduljalil A, Novak P, Novak V. Comparison of 1.5 and 8 Tesla high-resolution magnetic resonance imaging of lacunar infarcts. J Comput Assist Tomogr. 2002;26:628–32. doi: 10.1097/00004728-200207000-00027. [DOI] [PubMed] [Google Scholar]
- 17.Novak V, Kangarlu A, Abduljalil A, Novak P, Slivka A, Chakeres D, et al. Ultra high field MRI of subacute hemorrhagic stroke at 8 Tesla. J Comput Assist Tomogr. 2001;25:431–5. doi: 10.1097/00004728-200105000-00017. [DOI] [PubMed] [Google Scholar]
- 18.Ong WY, Halliwell B. Iron, atherosclerosis, and neurodegeneration: a key role for cholesterol in promoting iron-dependent oxidative damage? Ann N Y Acad Sci. 2004;1012:51–64. doi: 10.1196/annals.1306.005. [DOI] [PubMed] [Google Scholar]
- 19.Uemura A, O’uchi T, Kikuchi Y, Yashiro N, Ihara N, Shoji K. Prominent laterality of the posterior cerebral artery at three-dimensional time-of-flight MR angiography in M1-segment middle cerebral artery occlusion. Am J Neuroradiol. 2004;25:88–91. [PMC free article] [PubMed] [Google Scholar]
- 20.Ogawa S, Lee TM, Kay AR, Tank DW. Brain magnetic resonance imaging with contrast dependent on blood oxygenation. Proc Natl Acad Sci U S A. 1990;87:9868–72. doi: 10.1073/pnas.87.24.9868. [DOI] [PMC free article] [PubMed] [Google Scholar]
- 21.Burgess RE, Yu Y, Christoforidis GA, Kangarlu A, Abduljalil AM, Robitaille PML. Human leptomeningeal and cortical vascular anatomy of the cerebral cortex at 8 T. J Comput Assist Tomogr. 1999;23:850–6. doi: 10.1097/00004728-199911000-00007. [DOI] [PubMed] [Google Scholar]
- 22.Christoforidis GA, Bourekas E, Baujan M, Abduljalil A, Kangarlu A, Spigos D, et al. High resolution MRI of the deep brain vascular anatomy at 8 Tesla: susceptibility-based enhancement of the venous structures. J Comput Assist Tomogr. 1999;23:857–66. doi: 10.1097/00004728-199911000-00008. [DOI] [PubMed] [Google Scholar]
- 23.Reichenbach JR, Barth M, Haacke EM, Klarhofer M, Kaiser WA, Moser E. High-resolution MR venography at 3.0 Tesla. J Comput Assist Tomogr. 2000;24:949–57. doi: 10.1097/00004728-200011000-00023. [DOI] [PubMed] [Google Scholar]
- 24.Reichenbach JR, Haacke EM. High-resolution BOLD venographic imaging: a window into brain function. NMR Biomed. 2001;14:453–67. doi: 10.1002/nbm.722. [DOI] [PubMed] [Google Scholar]
- 25.Reichenbach JR, Essig M, Haacke EM, Lee BC, Przetak C, Kaiser WA, et al. High-resolution venography of the brain using magnetic resonance imaging. MAGMA. 2004;6:62–9. doi: 10.1007/BF02662513. [DOI] [PubMed] [Google Scholar]
- 26.Bernstein MA, Huston J, III, Lin C, Gibbs GF, Felmee JP. High-resolution intracranial and cervical MRA at 3.0T: technical considerations and initial experience. Magn Reson Med. 2001;46:955–62. doi: 10.1002/mrm.1282. [DOI] [PubMed] [Google Scholar]
- 27.Gibbs GF, Huston J, III, Bernstein MA, Riederer SJ, Brown RDJ. Improved image quality of intracranial aneurysms: 3.0-T versus 1.5-T time-of-flight MR angiography. Am J Neuroradiol. 2004;25:84–7. [PMC free article] [PubMed] [Google Scholar]
- 28.Ugurbil K, Adriany G, Andersen P, Chen W, Garwood M, Gruetter R, et al. Ultrahigh field magnetic resonance imaging and spectroscopy. Magn Reson Imaging. 2003;21:1263–81. doi: 10.1016/j.mri.2003.08.027. [DOI] [PubMed] [Google Scholar]
- 29.Yacoub E, Shmuel A, Pfeuffer J, Van de Moortele PF, Adriany G, Andersen P, et al. Imaging brain function in humans at 7 Tesla. Magn Reson Med. 2001;45:588–94. doi: 10.1002/mrm.1080. [DOI] [PubMed] [Google Scholar]
- 30.Abduljalil AM, Robitaille PML. Macroscopic susceptibility in ultra high field MRI. J Comput Assist Tomogr. 1999;23:832–41. doi: 10.1097/00004728-199911000-00004. [DOI] [PubMed] [Google Scholar]
- 31.Cremilieux Y, Ding S, Dunn JF. High-resolution in vivo measurements of transverse relaxation times in rats at 7 Tesla. Magn Reson Med. 1998;39:285–90. doi: 10.1002/mrm.1910390216. [DOI] [PubMed] [Google Scholar]