

Summary
Fatty acid binding protein 4 (FABP4) delivers ligands from the cytosol to the nuclear receptor PPARγ in the nucleus, thereby enhancing the transcriptional activity of the receptor. Notably, FABP4 binds multiple ligands with a similar affinity but its nuclear translocation is activated only by specific compounds. To gain insight into the structural features that underlie the ligand-specificity in activation of the nuclear import of FABP4, we solved the crystal structures of the protein complexed with two compounds that induce its nuclear translocation, and compared these to the apo-protein and to FABP4 structures bound to non-activating ligands. Examination of these structures indicates that activation coincides with closure of a portal loop phenylalanine sidechain, contraction of the binding pocket, a subtle shift in a helical domain containing the nuclear localization signal of the protein, and a resultant change in oligomeric state that exposes the nuclear localization signal to the solution. Comparisons of backbone displacements induced by activating ligands with a measure of mobility derived from TLS (translation/libration/screw) refinement, and with a composite of slowest normal modes of the apo state suggest that the helical motion associated with the activation of the protein is part of the repertoire of the equilibrium motions of the apo-protein, i.e. that ligand-binding does not induce the activated configuration but serves to stabilize it. Nuclear import of FABP4 can thus be understood in terms of the pre-existing equilibrium hypothesis of ligand binding.
Keywords: Allostery, FABP4, A-FABP, aP2, nuclear import, troglitazone, linoleic acid, adipocyte, PPAR
Introduction
Small lipophilic compounds, such as retinoic acid (RA) and long chain fatty acids and some of their active metabolites, regulate cellular behavior by modulating transcriptional rates. These molecules activate members of the super-family of nuclear hormone receptors. RA activates RA receptors (RAR), while the transcriptional activities of long chain fatty acids and their active derivatives are mediated by several classes of nuclear receptors, the best characterized of which are the peroxisome proliferator-activated receptors (PPARα, PPARβ/δ, and PPARγ1). PPARγ can associate with multiple unsaturated long chain fatty acids as well as some eicosanoids 2, and the activated receptor is involved in regulation of adipocyte differentiation 3, insulin sensitivity 4, and macrophage function.5 The synthetic PPARγ-selective ligands thiazolidinediones are currently used in treatment of diabetes 6, and may be efficacious in therapy of various cancers.7,8
The transcriptional activities of RAR and PPARs are also supported by intracellular lipid-binding proteins (iLBP) which deliver ligands from the cytosol to the receptors in the nucleus. Thus, cellular retinoic acid-binding protein II (CRABP-II), fatty acid binding protein 4 (FABP4, adipocyte FABP, aP2), and FABP5 (keratinocyte FABP, mal1) specifically deliver ligands to RAR, PPARγ, and PPARβ/δ, respectively. Recent studies established that, upon association with particular ligands, these binding proteins translocate from the cytosol to the nucleus where they directly ‘channel’ the ligand to their cognate receptor, thereby enhancing its transcriptional activity.9-13
The iLBPs do not harbor a recognizable nuclear localization signal (NLS) in their primary sequences, but recent studies of CRABP-II and FABP4 demonstrated that such a signal exists in the proteins’ 3-dimensional fold.14,15 The signal was mapped to three basic residues located in the helix-loop-helix region of the protein, K21, R29, and K30 in CRABP-II, and K21, R30, and R31 in FABP4, whose sidechains shift their orientation upon ligand-binding to form a functional NLS. Notably, although both FABP4 and FABP5 display a similar affinity towards a large array of compounds, only particular ligands induce their nuclear import.9
To obtain insight into the mechanisms that underlie the ligand selectivity in activation of FABP4, we solved the x-ray crystal structure of the protein in complex with two ligands that induce its nuclear translocation: troglitazone, a synthetic PPARγ-selective ligand, and linoleic acid, an essential fatty acid which acts as a pan-PPAR ligand. In addition, we considered the previously solved complex of FABP4 with the fluorescent dye 2-anilino-8-naphalene sulfonate (ANS)16, which also activates the nuclear import of the protein. We then compared these activated structures with previously reported structures of apo-FABP4 and of complexes of the protein with non-activating ligands.
The data revealed that activation of FABP4 involves closure of the portal loop, resulting in contraction of the binding pocket. The shift, which involves a swinging doorway comprised of F57, perturbs a critical helix containing the protein’s NLS. Crystal packing suggests further that activated and non-activated conformations of the protein have different homodimeric configurations. Non-activating ligands protrude from the portal, preventing its closure and preserving the integrity of a homodimeric interface which masks the NLS, while activating ligands favor an alternative homodimer in which the NLS is exposed.
Results
FABP4 binds a variety of ligands with similar affinities
The ligand-selectivity in nuclear mobilization of FABP4 may reflect differential binding affinities towards different ligands. To measure the equilibrium dissociation constants (Kd) of FABP4 for several compounds, the protein was bacterially expressed, purified, and its ligand-binding characteristics examined by fluorescence competition assays utilizing the fluorescent probes parinaric acid or anilinonaphtalene-8-sulphonic acid (ANS). The method entails two steps.17 In the first step, Kd for association of the protein with a fluorescent probe was measured by fluorescence titrations. Titration with parinaric acid or ANS resulted in a satuarble increase in fluorescence (Figure 1(a)-(b) filled circles). Continuing addition of either probe led to an additional linear increase, reflecting the fluorescence of unbound probe.17 Titration curves were corrected for the linear increase (Figure 1(a)-(b), open circles) and analyzed18 to obtain the Kd for the probe. Kds for non-fluorescent ligands were then measured by monitoring their ability to compete with the probes for binding. The protein was pre-complexed with a probe and titrated with the non-fluorescent ligand whose binding was reflected by a decrease in fluorescence which accompanied the displacement of the probe from the binding pocket (Figure 1(c)-(d)). Kds for non-fluorescent ligands were extracted from the EC50 of competition curves and the measured Kd for the probe. Derived Kd values for ANS, parinaric acid, troglitazone, the PPARβ/δ ligand L165041, and stearic acid were 31.5±4.3 nM (n=4), 57.6±20 nM (n=3), 17.0±2.4 nM (n=4), 27.8 nM 9, and 22.5±1.3 nM (n=3), respectively. As neither stearic acid nor L165041 activate the nuclear localization of FABP4 9, the similarity of the Kds towards all of these ligands indicates that the ligand-selectivity in activation of the protein does not simply originate from differential ligand binding affinity.
Figure 1.

Fluorescence titrations of FABP4. Protein (1 μM) was titrated with PA (a) or ANS (b) and probe fluorescence was monitored. Data (closed circles) were corrected for non-specific linear increases following saturation, and corrected data (open circles) were fit to obtain Kd. Kds for association with troglitazone (c) and stearate (d) were obtained by fluorescence competition titrations. FABP4 was pre-complexed with PA and titrated with non-fluorescent ligands.
Structural changes related to ligand binding
To gain insight into the basis for the ligand-selectivity in activation of FABP4, we solved the 3-dimensional x-ray crystal structure of FABP4 complexed with two ligands that activate the protein’s nuclear import: troglitazone and linoleic acid.9 These structures were then compared with previously reported structures of the protein. FABP4 bound with either linoleic acid or troglitazone adopts the well-known clam-shell assembly of 10 antiparallel β-strands (Figure 2(a), βA-βJ) capped with a helix-loop-helix motif (αI and αII). Like all known ligands, both linoleic acid and troglitazone bind in the internal pocket of FABP4 within a plane that is parallel to and just below the helix-turn-helix motif.16,19 Superposition of the holo structures with the apo structure (PDB entry 1LIB) shows surprisingly little change within the backbone (Figure 1(b)).
Figure 2.

Structures of apo-FABP4 and FABP4 bound to linoleate and troglitazone. (a) Linoleate-bound FABP4. The clam-shell assembly of 10 βstrands capped with a helix-loop-helix forms a ligand-binding pocket. (b) Superposition of the protein backbones for the linoleate-bound (green), troglitazone-bound (yellow) and apo- (white) FABP4.
In addition to apo-FABP4, the structure of the protein was previously solved in complex with stearic acid (1LIF), palmitic acid (1LIE), oleic acid (1LID) and arachidonic acid (1ADL) 20, as well as with the fluorescent dye ANS (2ANS). It was noted that the volume of the FABP4 binding pocket is expanded in complexes with these long-chain fatty acids as compared to the apo protein.16 Our calculations (CASTp sofware 21) yielded volume changes of +167 Å3, +157 Å3, +136 Å3, and +175 Å3 for oleate, palmitate, stearate, and arachidonate, respectively. In contrast, binding of linoleate, troglitazone, and ANS induce pocket volume contractions of -111 Å3 and -74.4 Å3 (chain B), and -34 Å3 respectively.
To gauge the change induced by various ligands, we computed the degree of displacement in the Cα atoms. The differences were computed relative to the FABP4 conformation bound to oleic acid (1LID) so that conformational changes related to generic ligand binding will be distinguished from those that activate nuclear transport. The lines in Figure 3(a) depict deviations from the oleate structure caused by linoleate, troglitazone and ANS. Atoms are plotted by residue number with labeled blocks representing secondary structural units. The dashed line at 0.5 Å represents a conservative limit below which it is difficult to determine if structural variations are statistically significant. With the exception of helix αII, all major peaks above 0.5 Å appear to be associated with loop regions between stretches of secondary structure. Loop regions are less well ordered, subject to neighbor contact, and exposed to solvent. Indeed, the second largest peak common to all structures is G88, which comes within 3.5 Å of E69 on a neighboring molecule. The prominent peak at F57, however, is functionally very significant. Protruding from the loop between βC and βD, F57 acts as a doorway to the so-called portal region, a proposed entrance to the binding pocket.16,20,22
Figure 3.
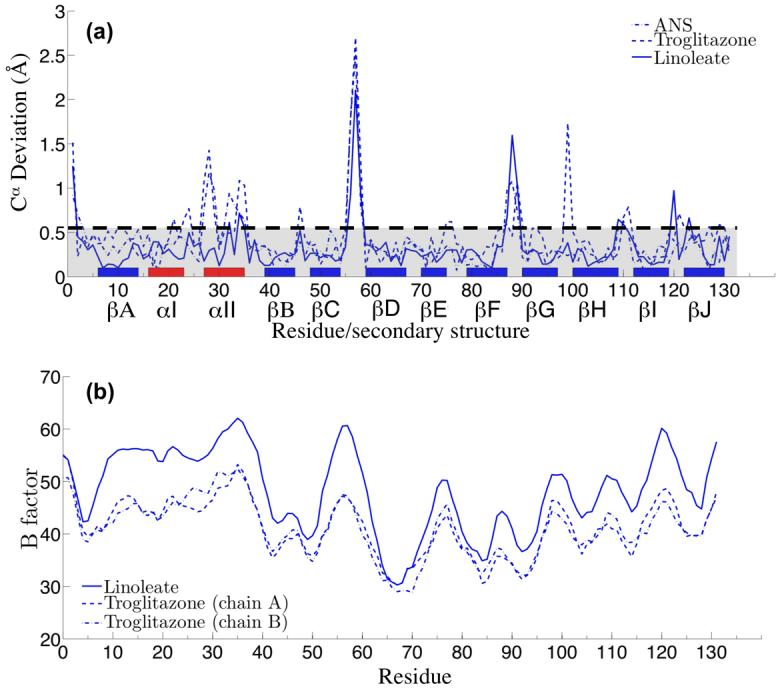
Linoleate-, Troglitazone-, and ANS-bound FABP4 are distinct from apo-FABP4 and from complexes with other long chain fatty acids. (a) Deviations of Cα atoms in ligand-bound FABP4 from the non-translocating oleate-bound form are shown. The dashed line at 0.5 Å marks a region below which deviations may not be statistically significant. The peak at F57 is the portal loop closing the pocket. Helix αII, which contains two of the NLS residues, also shows systematic deviation. Remaining peaks tend to be exposed loop residues, some of which are crystallographic neighbor contacts. (b) Isotropic B-factors from structure refinement, prior to the introduction of TLS groups (see text), show that Cα atoms in both helix αI and αII are more disordered than other parts of the structure. The loop containing F57 is also very prominent.
The data in Figure 3 also indicate that the ANS, troglitazone, and linoleate structures deviate from the oleate complex across the length of helix αII (G26-K37), and a part of the previous turn connecting to helix αI. This trend is most apparent in the isotropic B-factors which represent the degree to which individual atomic electron densities are broadened as a result of spatial and dynamical disorder in the crystal (Figure 3(b)). In addition to disorder in the helix-helix region, the loop containing F57 is prominent. As in Figure 3(a), other peaks correspond to solvent-exposed loops.
These concerted motions may also be visualized by plotting atomic displacements of Cα positions as arrows superimposed on ribbon diagrams (Figure 4(a)-(c)). Once again, these displacements are computed relative to the Cα positions found in oleate-bound FABP4. Inspection of the models reveals that the loop associated with F57 folds inward in response to the three ligands. Overall helical movement may be facilitated by the presence of a lone proline, P38, at the transition between sheet βB and helix αII.
Figure 4.
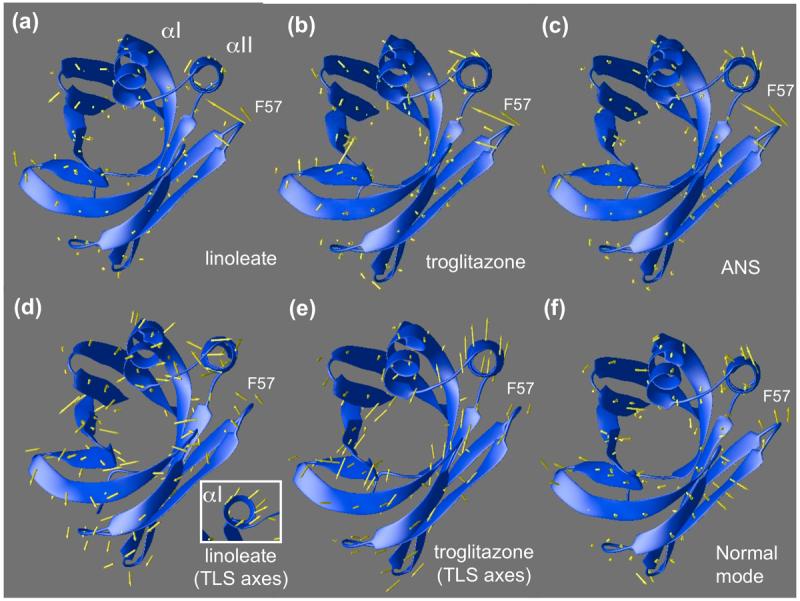
(a-c) Displacements of backbone atoms of ANS, linoleate, and troglitazone complexes relative to the non-activating oleic acid complex are shown as arrows superimposed on oleic-FABP4 ribbons. The loop containing F57 folds inward to close the binding pocket, pushing the helix αII in the same direction. (d-e) Individual atomic b-factors are isotropic in this model, but Translation, Libration, Scew (TLS) refinement allows the helix-loop-helix motif to be treated as a separate rigid unit from which aggregate anisotropic b-factors can be derived. Arrows indicate the direction of maximum anisotropy, corrected for overall movement of the protein within the lattice. (d) Linoleate complex shows movement in the F57 loop as well as helices. Helix αI shows concerted movement when viewed end-on (see inset). Linoleate appears to be more isotropic than troglitazone. (e) Troglitazone (chain A) shows systematic anisotropic movement of helix αII. The same trend is evident in chain B (not shown). (f) A linear combination of slowest vibrational modes of the (apo) backbone anticipates the helical shift induced by the ligands as well as the F57 loop movement.
Atomic B-factors (also known as Debye Waller factors) measure the degree to which thermal motion and spatial (static) disorder in the crystal attenuate x-ray scattering. They are related to the root mean squared displacements of the atomic centers and can be thought of as a measure of the effective diameter of each atom’s electron density. Simple isotropic B-factors are routinely computed for each atom during structural refinement of most diffraction data. TLS (translation/libration/screw-rotation) refinement extends the notion of B-factors from individual atoms to entire subunits of proteins. Rather than simply modeling isotropic mean squared displacements, TLS refinement includes the anisotropic translational and rotational displacements of the specified bodies. Analysis of the TLS parameters gives an indication of possible collective motions within the protein. For easy comparison with atomic displacements (Figure 4(a)-(b)), we have projected the TLS parameters back onto each Cα using the TLSANL program.23 Complete details are given in the method section of this paper. Arrows in Figure 4(d)-(e) show the largest expected direction of motion for each backbone atom as extracted from the TLS analysis. When looking at these TLS-derived figures, it is important to remember that the arrows do not indicate a permanent shift in position as do the arrows in Figure 4(a)-(c), but rather they represent directions of greatest disorder in the electron density. Linoleate (Figure 4(d)), which is generally more isotropic than troglitazone, shows some preferred disorder in the direction of loop closure as might be expected. Concerted inward/outward motion of helix αI is also prevalent, while motion of helix αII is significant but inhomogeneous. Troglitazone (Figure 4(e)) shows little freedom of motion in F57 or in helix αI, but strong concerted movement of helix αII.
A linear combination of 10 low-frequency normal modes of the apo state (calculated using the Anisotropic Network Model program 24), shows significant movement in both helices, though most notably helix αII (Figure 4(f)). Arrows in this figure actually represent the direction of motion the atoms experience during harmonic motion. These observations suggest that the movement of helix αII, the loop containing F57, and possibly helix αI, is part of the spectrum of easily accessible native conformations occupied by the apo protein, and that linoleic acid, ANS, and troglitazone all selectively distort the protein along that direction. While concerted motion of the helices can clearly be seen in the single lowest frequency normal mode (not shown), motion of the F57 loop appears only as more low frequency modes are added in linear combination (see Materials and Methods).
Inspection of other non-activating structures reveals that, in complexes with oleate, palmitate, stearate, and arachidonate, the ligands protrude from the binding site through the portal region, pushing residue F57 into an open position. The previously reported ANS-bound structure is unusual in that the sulfonate group of the ligand does not occupy the binding site for the acidic group observed in other fatty acids, but instead, makes contact with F57, evidently stabilizing it in the closed position (Figure 5(a)). Interestingly, our newly solved structures indicate that FABP4 bound with either linoleic acid or troglitazone display similar closed portal conformations. The apo state displays an intermediate configuration where F57 is placed in a somewhat more open conformation than that observed for ANS, linoleic acid, and troglitazone (not shown). F57 appears to play an important role in the movement of helix αII. In its closed conformation, induced by linoleate, troglitazone, and ANS, this residue is in direct contact with V32 of helix αII, pushing outward. In the open conformation, observed with other long chain fatty acids, F57 pushes on V32 from the opposite side (Figure 5(b)). Notably, V32 is directly adjacent to K31 and R30, residues that define the nuclear localization signal of FABP4.
Figure 5.

The portal region of FABP4. (a) In complexes with non-activating ligands, e.g. oleate (magenta), the F57 sidechain occupies an open conformation exposing the binding pocket to the external solvent. For the three activating ligands, ANS (orange), linoleate (blue), and troglitazone (red), F57 occupies a closed conformation. (b) Superposition of oleic acid (blue) and linoleic acid (pink) FABP4 backbones along with respective F57 sidechains. The white chain at center of the binding pocket is linoleic acid. F57 pushes directly on V32 of the helix containing the NLS residues (red). Dashed lines show the closest atomic contacts in each conformation. The transitional proline P38 (yellow patch), which separates helix αII from the adjacent sheet, appears to function as a pivot point for the subtle helical shift.
ANS activates the nuclear import of FABP4
Backbone atom displacements, binding pocket volume contraction, and closure of the portal F57 set the troglitazone-, linoleate-, and ANS-bound structures apart from other FABP4 complexes. The common structural features that arise in response to binding of these three ligands suggest that, like troglitazone and linoleic acid, ANS may also enable the nuclear translocation of FABP4. The effect of ANS on the subcellular localization of FABP4 was thus studied. To this end, a mammalian expression vector encoding FABP4 fused with green fluorescent protein (GFP) was used. The construct was transfected into COS-7 cells, and the localization of the protein visualized by confocal fluorescence microscopy. As a control, cells were transfected with a plasmid expressing GFP alone. GFP alone was distributed across the cells, most likely reflecting that its high expression level resulted in leakage into the nucleus even in the absence of a specific NLS (data not shown and 14). GFP-apo-FABP4 displayed a similar behavior and partitioned between the cytosol and the nucleus (Fig. 6(a), left panel). To examine the effect of ANS on the subcellular location of GFP-FABP4, cells were maintained in delipidated medium, treated with vehicle or ANS for 1 hr., and imaged (Figure 6(a), right panel). To obtain statistically meaningful data, the ratio of fluorescence intensity in the nuclei and cytosol of 20-30 cells under each condition was quantitated (Figure 6(b)). The data show that addition of ANS markedly increased the fraction of the protein in the nucleus, demonstrating that, like troglitazone and linoleic acid, ANS induces FABP4 to undergo nuclear import. Hence, the specific structural reorganization triggered by these three ligands underlies their ability to stabilize the protein’s nuclear localization signal.
Figure 6.

Subcellular localization of FABP4 and its NESm and F57A mutants. (a)-(b) ANS induces nuclear import of FABP4. (a) GFP-tagged FABP4 was transfected into COS-7 cells. Protein was visualized by confocal fluorescence microscopy in the absence of ligand (-) and following a 1 hr. treatment with ANS (1 μM). (b) Ratios of fluorescence intensity between the nuclei and cytosol of 20-30 cells under each condition are presented (mean±S.E.M.). (c) Mutation of F57 abolishes ligand-induced nuclear import. COS-7 cells were transfected with a construct harboring GFP-FABP4-F57A. Protein was visualized by confocal fluorescence microscopy in the absence or following a 1 hr. treatment with troglitazone (1 μM). Ratios of fluorescence intensity between the nuclei and cytosol of 25 cells under each condition are presented (mean±S.E.M.). (d)-(f) Mutation of F57 abolishes the ligand-independent nuclear import of FABP4 lacking its NES. COS-7 cells were transfected with a construct harboring GFP-FABP4-NESm (d) or GFP-FABP4-NESm-F57A. Protein was visualized by confocal fluorescence microscopy. Ratios of fluorescence intensity between the nuclei and cytosol of 48 cells under each condition are presented (mean±S.E.M.).
F57 is critical for the nuclear import of FABP4
The data (Fig. 5) suggest that F57 plays a pivotal role in allowing specific ligands to trigger the nuclear translocation of FABP4. To further examine this conclusion, we monitored the ability of an FABP4 mutant in which this residue was exchanged with an alanine to undergo nuclear import. In a preliminary experiment, FABP4-F57A was bacterially expressed and purified, and its ligand binding affinity studied. The Kds for the association of the mutant with ANS and troglitazone were found to be 35.2±16.2 and 60.6±8.9 nM, respectively (n=3). The close similarity of these values to the Kds of WT-FABP4-ligand complexes verify that the mutation did not disrupt the overall folding of the protein or impair its ligand-binding characteristics. The subcellular localization of the mutant was then studied. An expression vector encoding GFP-FABP4-F57A was transfected into COS-7 cells, and confocal fluorescence microscopy was used to visualize the localization of the protein in the absence or presence of the activating ligand troglitazone. The data (Fig. 6(c)) show that the mutation completely abolished the ability of the protein to undergo nuclear import in response to troglitazone.
We previously showed that, in addition to its ligand-controlled nuclear import, FABP4 contains a nuclear export signal (NES) which mediates constitutive active nuclear export by the CRM1 export machinery.15 Surprisingly, we found that, upon inhibition of the export either by a chemical inhibitor of CRM1 or by mutating the NES, FABP4 localizes to the nucleus even in the absence of ligand (15 and Fig. 6(d)). The data presented here provides insight into this behavior. As discussed above, the spectrum of conformations adopted by apo-FABP4 appears to contain the activated conformation (Fig. 4). Hence, in a fraction of the protein, the NLS is placed in an activated state even in the absence of ligand, and this fraction can undergo nuclear import. In the absence of active export, the protein is ‘trapped’ in the nucleus, thereby shifting the equilibrium towards this compartment. This behavior of the NLS mutant (NLSm) provided an opportunity to further examine the importance of residue F57 in enabling nuclear import. An expression vector harboring GFP-tagged FABP4 lacking both its NLS and F57 (FABP4-L66A/L86A/L91A/F57A, NLSm-F57A) was generated. The construct was transfected into COS-7 cells, and the localization of the mutant imaged using confocal fluorescence microscopy (Fig. 6(e)). The data demonstrate that, similarly to its effect on the ligand-induced nuclear import of WT-FABP4, mutation of F57 impairs the nuclear translocation of apo-FABP4 lacking its NES.
Crystal packing and oligomeric state in solution
The apo-FABP4 structure reveals the presence of a crystallographic dimer mediated through interactions between the helix-loop-helix region of two monomers (Figure 7(a)). This dimer remains intact in FABP4 complexes with all ligands except the activating ligands troglitazone, linoleic acid, and ANS. In the crystal lattices for these three complexes, a plausible homodimer can be located, but it is structurally distinct from that of the apo-protein and other non-activated complexes (Figure 7(b)). Notably, dimer formation in the non-activated state is mediated through the helix-loop-helix region of the protein and the interactions sequester the protein’s NLS. The apparent shift of the oligomeric conformation following binding of an activating ligand unmasks the signal and renders it accessible to the solution.
Figure 7.

Crystallographic homodimers of FABP4. (a) Non-activating ligands of FABP4, such as oleate and stearate, are found to crystallize in the C2 space group. Crystallographic symmetry yields a homodimer in which opposing helix-turn-helix subdomains form the principal protein-protein contact surface. (b) Activating ligands (ANS, linoleate, and troglitazone) are found to crystallize in C2221 or P212121. In the case of P212121 (troglitazone and ANS), a homodimer in the asymmetric unit yields an alternative configuration with a broader contact surface and exposed helix-turn-helix domains. For C2221 (linoleate and troglitazone), an identical homodimer appears as a result of crystallographic symmetry.
The oligomeric state of FABP4 in solution was examined using small-angle x-ray scattering (SAXS), a technique that yields structural information from protein solutions at near-physiological conditions.25 Comparison of the x-ray scattering intensity profile for apo-FABP4 with simulated profiles for the apo monomer and dimer (from 1LIB) shows a good agreement with a dimer, but not a monomer model (Figure 8(a)). Nearly identical scattering profiles were observed in the presence of troglitazone, supporting the conclusion that the protein forms dimers both in the apo- and the troglitazone-bound states. Because the different homodimers are similar in shape, it is not feasible to distinguish between them at the resolution of this method.
Figure 8.
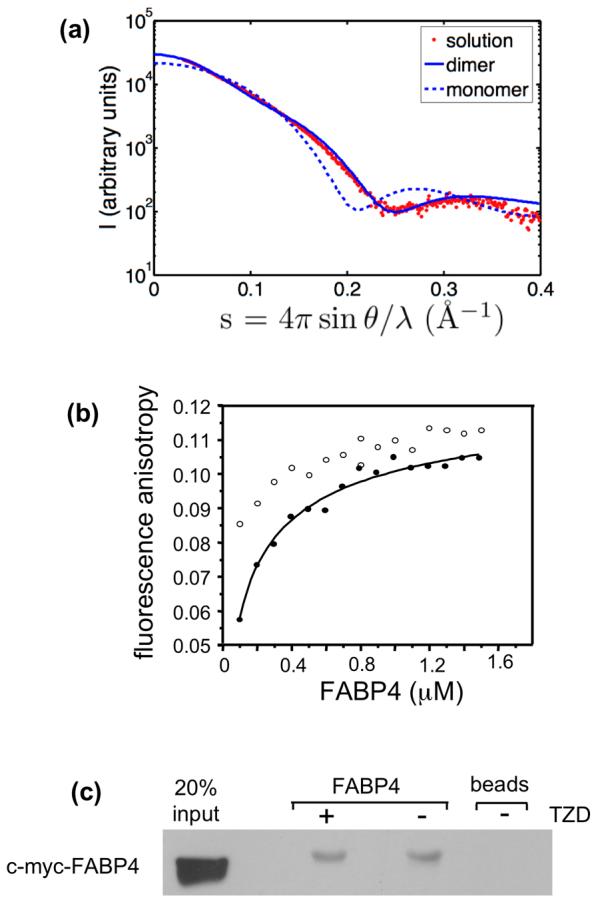
FABP4 forms dimers in solution. (a) Small-Angle X-ray Scattering (SAXS) profile of apo-FABP4 in solution. Computed scattering profiles for the apo monomer (dashed line) and apo dimer (solid line), based on crystallographic coordinates, are shown superimposed on the actual solution scattering data (red dots). The data conform to a dimeric model. (b) Fluorescence anisotropy titrations. Anisotropy of the intrinsic fluorescence of the protein was measured at varying protein concentrations. Data obtained for the apo-protein (solid circles) were fit using a monomer-dimer binding equation to obtain a Kd. Self-association of the protein was also observed in the presence of troglitazone (empty circles). (c) co-precipitation assays. C-Myc-tagged FABP4 expressed in mammalian cells was coprecipitated with immobilized recombinant FABP4 in the presence and absence of troglitazone. Coprecipitated protein was visualized by Western blots using antibodies against c-Myc.
Self-association of FABP4 in solution was also investigated by fluorescence anisotropy titrations, a method that reports on the rotational volume of proteins and is extensively used to study protein-protein interactions.26 Anisotropy of the intrinsic fluorescence of FABP4 increased as the protein concentration was raised to reach a plateau (Figure 8(b), solid circles). The observed saturation of titration curves rules out non-specific aggregation and indicates a discrete self-association process with a Kd of 120±11 nM (mean±SD, n=4). In the presence of troglitazone, titration curves were shifted to somewhat higher values (Figure 8(b), empty circles). This shift may emanate from ligand-induced changes in the environment of tryptophans but, regardless of the origin of the shift, the data provide additional evidence that both apo- and troglitazone-bound FABP4 self-associate into dimers.
Data described above were obtained using bacterially-expressed recombinant FABP4. To examine whether self-association is also a characteristic of the protein when expressed in mammalian cells, co-precipitation assays were carried out. COS-7 cells were transfected with a construct encoding FABP4 tagged with c-Myc, grown for 24 hr. and lyzed. Hexahistidine-tagged FABP4 was immobilized on nickel-chelating beads, and incubated with cell lysates containing c-Myc-FABP4 in the presence or absence of troglitazone. Beads were centrifuged and washed, and pelleted proteins resolved by SDS-PAGE. c-Myc-FABP4 that co-precipitated with immobilized FABP4 was visualized by Western blots using antibodies against the c-Myc tag. The data (Figure 8(c)) demonstrated that FABP4 expressed in mammalian cells interacts with immobilized FABP4 both in the presence and in the absence of troglitazone. Taken together, the observations indicate that both apo- and troglitazone-bound-FABP4 self-associate into dimers, and suggest that apo-homodimers are structurally distinct from dimers of the troglitazone-bound protein.
Discussion
The broad ligand-binding characteristics of FABPs have long hampered detailed understanding of their function. It is often stated that these proteins play passive, nonspecific roles in cells, and it has been reported that they are involved in intracellular transport, storage, and metabolism of ligands.27,28 The mechanisms that underlie the activities of these proteins as well as the exact nature of their physiological ligands have long remained poorly understood. A specific role for FABP4 and FABP5 was suggested by the observations that these proteins selectively deliver ligands from the cytosol to specific PPAR isotypes in the nucleus, and that, despite their association with numerous ligands, nuclear translocation is activated only by specific compounds.9,13 It was recently demonstrated that nuclear import of FABP4 is mediated by residues K21, R30, and R31, which constitute an NLS which becomes functional upon binding of activating ligands. 15 To better understand the structural basis for the ligand-specific activation of FABP4, we solved the crystal structures of the protein bound to two import-inducing ligands: linoleic acid and the PPARγ-ligand troglitazone.
Comparison of the activated structures with previously-solved structures of the apo-protein and of complexes of FABP4 with non-activating ligands showed that, although there is surprisingly little overall conformational change, distinctive structural signatures do exist that set activating ligands apart from non-activating ones: overall contraction of the binding pocket, closure of the portal region of the protein via a swinging motion of F57, motion of a helical domain, and a change in crystal space group habit suggestive of a shift in homodimer configuration. On the basis of these structural signatures, we identified among previously-solved structures an additional import-inducing ligand: ANS. Notably, the crystallographic homodimers divide neatly along activated vs. non-activated structures, even in the case of troglitazone, which has been solved in two different space groups under different crystallization conditions. Homodimeric arrangements were further demonstrated by studies of the oligomeric state of FABP4 in solution which revealed that the protein self-associates both in the presence and in the absence of ligands (Figure 8). Taken together, the data indicate that activating ligands force breakup of a dimer in which the NLS is sequestered and lead to an alternative homodimer in which the signal is accessible.
Considering the previous suggestion that the pocket of FABP4 is structurally stabilized by the presence of ordered water 20, the collapse of the pocket volume upon binding of an activating ligand may indicate an effective completion of the hydrophobic core. A significant part of this collapse is the contact of F57 with helix αII adjacent to the NLS region, which suggests that portal closure influences the presentation of NLS residues (mainly K31), thereby triggering a shift in homodimeric state which exposes the NLS residues and enables nuclear import. The presence of a key transitional proline residue (P38) between helix αII and the following beta sheet may serve as a hinge which allows helix αII to move more easily in response to perturbation. Indeed, P38 itself exhibits a high degree of variation among the various FABP4 structures (data not shown). Hence, the configuration of the F57 sidechain which is stabilized by activating ligands is key in conveying ligand-binding information to the NLS region and enabling import. The data indeed demonstrate that while a mutation of F57 does not impair the overall folding or the ligand-binding affinity of FABP4, it abolishes the ability of the protein to undergo nuclear import (Fig. 6).
Protein-ligand interactions have long been understood in terms of the “induced-fit” model which states that ligand-binding induces a protein to undergo conformational changes, and that such changes precede the formation of the activated holo-form.29 This model implies that the presence of ligand is absolutely necessary for the protein to adopt its activated conformation. In contrast, the theory of “pre-existing equilibrium/conformational selection” postulates that apo-proteins occupy an ensemble of conformations where apo-like states are most probable, but others, which are conformationally compatible with ligand-binding, are also present. When a ligand is introduced, ligand-compatible conformations are thought to be stabilized and thus become the predominant species.30 The small magnitude of the conformational difference between apo- and holo-FABP4 renders a scenario in which the active conformation may exist within the normal equilibrium ensemble of the apo-protein feasible, and suggests that this protein may be a good model for testing the validity of the pre-existing equilibrium theory. The observations that apo-FABP4 lacking its NES can reach the nucleus even in the absence of ligand (15 and Fig. 6(d-f)) indeed demonstrate the presence of the activated state within the spectrum of conformations occupied by the apo-protein. The scenario is further supported by our preliminary normal mode calculations, which show that the requisite motions are contained within the lowest frequency modes of the apo protein. It is hoped that this finding will stimulate further analysis, especially as more activating ligands are uncovered.
The ligand-induced enhancement of the translocation of WT-FABP4 thus reflects the ability of the ligand to stabilize the active conformation thereby enabling import in the face of active nuclear export. These data provide strong support for the validity of the pre-existing equilibrium theory in the context of live cells.
Materials and Methods
Ligands
ANS, cis-parinaric acid, and stearic acid were purchased from Sigma Chemical Co. (St. Louis, MO). Troglitazone was purchased from Biomol (Plymouth Meeting, PA).
Plasmids
The cDNA of mFABP4 (in pBluescript), was subcloned into the mammalian expression vector pSG5. The GFP-FABP4 vector was constructed by subcloning the coding sequence into pEGFP-C2. The bacterial expression vector for histidine-tagged FABP4 was constructed by subcloning the coding sequence into pET28a. FABP4-mutants were generated using the Quickchange mutagenesis kit (Stratagene, Cedar Creek, TX).
Proteins
Histidine-tagged proteins were expressed in the E. coli strain BL21 as described previously.14
Cells
COS-7 cells (American Type Culture Collection, Manassas, Va.) were cultured in Dulbecco’s modified Eagle’s medium (DMEM) supplemented with 10% fetal bovine serum (FBS). Cells were transfected using Fugene (Roche, Indianapolis, IN).
Fluorescence Titrations were conducted using a Fluorolog 2 DMIB spectrofluorometer (SPEX Instruments, Edison, N.J.). Protein (1 μM in 20 mM TRIS, pH 8.0, 0.5 mM NaCl) was titrated with ANS or parinaric acid (in ethanol). Probe fluorescence (ANS - λex-375 nm, λem-475 nm; PA- λex-330 nm, λem-432 nm) was measured following each increment. Data were analyzed using Origin 6.0 (MicroCal Software Inc., Northampton, Mass.). For competition titrations, protein was pre-complexed with ANS or PA at a mole ratio of 1:0.8. Non-fluorescent ligand was added and mixtures equilibrated (1 hr., room temperature) prior to measurements.
Fluorescence Anisotropy Titrations
FABP4 (in 10 mM HEPES, pH 8.0, 0.1 mM EDTA, 100 mM KCl, 1 mM dithiothreitol) was incubated (25°C, 30 min.) at different concentrations in the absence or presence of troglitazone (10 μM). Fluorescence anisotropy of the protein (λex-280 nm, λem-340 nm) was measured.
Fluorescence Microscopy
COS-7 cells were grown on 35 mm plates in DMEM with 10% charcoal-treated FBS and transfected (4 hr.) with constructs harboring either GFP-FABP4 or corresponding mutants. Cells were maintained in DMEM devoid of serum overnight, treated with denoted ligands (1 μM) or vehicle for 1 hr. and imaged using a Leica confocal fluorescence microscope (Leica, Bannockburn, IL), using a 40X dipping lens and argon 488nm laser.
Crystallography
Linoleic acid in 100% ethanol was added to FABP4 (10 mg/ml in 20 mM TRIS pH 7.8) to achieve 4-fold molar excess with 5% final ethanol concentration. Hanging drops were prepared using a range of well solutions containing 0.1 M Sodium Cacodylate at pH 6.5, 0.1 M Ammonium Sulfate, and 30-40% PEG 8000. Drops were composed of 1 μl protein solution added to 2 μl well solution. Malformed crystals first appeared after 16 days with much better quality crystals forming after 1-2 months. Best results were obtained by boosting the ligand content of the drop with neat linoleic acid 24hr prior to harvesting. Crystals (50 × 150 μm columns) were mounted in mineral oil and flash cooled before data collection. Data were collected on MacCHESS beamline F1. The space group for these conditions was found to be C2221.
Troglitazone (in ethanol) was added to the FABP4 (8 mg/ml in 20mM TRIS, pH 7.8, 50 mM NaCl) at 2× molar excess, and the mixture rocked overnight at 4°C. A well solution containing 1.6 M ammonium sulfate, 100 mM sodium acetate buffer (pH 4.5) and 50 mM K/Na phosphate mix (99% K2HPO4 + 1% NaH2PO4) produced clusters of needles in approximately 2 weeks when mixed (1 μl + 1 μl) with protein solution in a hanging-drop arrangement. Crystals (approximately 25 × 100 μm) were harvested by manually breaking needle clusters, mounted in mineral oil, and flash-cooled for data collection.
Preliminary crystal screening was performed on A1 station at MacCHESS, with complete data collection conducted at ALS beamline 8.2.1. Monochromatic x-rays at 12.398 keV (1.0 Å) were collimated to 30 μm. To minimize radiation damage, 5 data sets of 30-50° each were collected on fresh sections of a single crystal and merged during data processing. The space group for this set of conditions was found to be C2221. Crystals of troglitazone-bound FABP4 (2× molar excess) have also been obtained from 1.2 M ammonium sulfate and 0.1 M Lithium Sulfate. Drops composed of 1 μl protein solution + 1 μl well solution yielded 20 × 300 μm needles after approximately 1 month. Data on this crystal form was collected at NSLS beamline X26. These latter conditions produced slightly more complete troglitazone density as well as a different space group (P212121)
Molecular replacement in all cases was accomplished using the known FABP4 apo structure (1LIB) and Phasor.31 After inspection of the unrefined preliminary density, the models were subjected to repeated rounds of building with Coot 32 and refinement with Refmac5.33 Omit maps were generated by removing the appropriate portion of the model, subjecting the remaining coordinates to 0.5 Å random perturbations, followed by 10 iterations of refinement using refmac5. Maps were generated using sigmaA-weighted coefficients.34
TLS (translation/libration/screw-rotation) refinement was applied to the final models using refmac5 with rigid body assignments recommended by the TLSMD server of the University of Washington Biomolecular Structure Center.36 In each refinement cycle, 10 iterations of TLS parameter refinement were followed by 10 iterations of residual B-factor refinement. In the case of Linoleate-FABP4, The most precipitous drop in the least squares residual reported by TLSMD occurred with a decomposition of only two bodies: residues 1-40 and 41-131. Surprisingly, this division naturally separates the helix-loop-helix motif from the body of the protein. Refinement with these parameters resulted in Rfree improving by more than 3 percentage points. The TLSANL program23 was used to project the anisotropic rigid body parameters onto individual atoms as PDB ANISO records. Principal axes of libration for the helix-loop-helix group (residues 1-40) had reported mean-square displacements of -0.268, 4.952, and 10.899 respectively. The negative value indicates near-zero motion in the corresponding direction combined with slight deviations from the rigid body assumption.37 ANISO records generated by TLSANL were converted to principal axes by the Rastep program.38 Visual inspection of the vectors revealed some systematic movements consistent with whole-protein motion within the lattice. To separate this effect from atomic motion, we subtracted the net maximum principal axis in the follow manner: let emax(i) be the principal axis of maximum mean square displacement for atom i. For each vector we then plot where N is the total number of atoms. The plotted vectors thus represent preferred directions of oscillation minus systematic movements of the whole protein.
In the case of troglitazone-FABP4, with two proteins per asymmetric unit, TLSMD suggests a 5 body decomposition. Four of the bodies correspond exactly to the linoleate assignment, with the helix-loop-helix motif up to residue 40 being one body and the rest of the protein being the other. Interestingly, the 5th body consists of only the first 3 N-terminal residues of chain A plus a few poorly-resolved HIS tag residues.
Application of these TLS parameters to Refmac refinement yielded improvement in Rfree of about 2 percentage points. Principal axes of libration for the helix-loop-helix motif (residues 1-40) show mean square displacements of 0.314, 2.582, 10.444 and 4.095, 5.550, 11.091 for chain A and B respectively and in line with linoleate-FABP4 results.
Linoleate diffraction data were processed at 2.30 Å with the HKL2000.39 Molecular replacement produced a unique solution, placing one protein within the asymmetric unit of space group C2221 with 64.4% solvent. Ligand density was immediately visible in the binding site. The placement and conformation of linoleic acid is similar to that of arachidonic acid (PDB ID 1ADL), the former having a slightly shorter chain. An unbiased 2Fo-Fc omit map, in which both linoleic acid and the portal sidechain F57 have been removed, shows broken, but distinct, density for F57 in the closed conformation (Figure 9(a)).
Figure 9.

Ligand placement and omit maps. Ligand and F57 sidechain have been removed from both models, followed by randomization of coordinates and 10 iterations of refinement. (a) FABP4 binds to linoleate in a folded U-shaped conformation similar to arachidonic acid (PDB ID 1ADL), only shorter by two carbon atoms. The F57 sidechain appears in a closed configuration making close contact with the ligand tail region. (b) Troglitazone apparently binds to FABP4 in a manner similar to ANS (PDB ID 1ANS) with the hydroxy-tetramethyl-chroman ring system replacing the napthalene ring system of ANS. Stereoisomeric inhomogeneity at two centers complicates density interpretation and the present conformation (the 2R-5R isomer) should be considered tentative. The methoxy-linked benzyl group extends from the chroman ring system into the pocket normally occupied by carboxyl groups in fatty acids. There is no significant density supporting placement of the thiazolodine moiety. In spite of ligand ambiguity, density of F57 is well defined and unambiguously in the expected closed conformation. (c) When superimposed with troglitazone (gray), the linoleic acid chain (pink) follows the contour of the chroman ring system on one side. (d) Both ligands are constrained by the binding pocket to nearly planar conformations (helix αII removed in this view).
Diffraction data for troglitazone-bound FABP4 (C2221 crystal form) were indexed to 2.3 Å using the DPS package.40 Systematic absences visible in the pattern were consistent with a space group of C2221. Placement of one molecule per asymmetric unit yielded a solvent content of 62.8%. These data can also be processed as two molecules (the putative physiological homodimer) per asymmetric unit in the P21 space group, but no improvement in R factors could be seen, so the homodimer symmetry axis appears to be fully crystallographic. A second set of crystallization conditions yielded a lattice having a space group of P212121 and having slightly better troglitazone density but diffracting to 2.31 Å. This time, two molecules were found per asymmetric unit and no other space group yielded a reasonable solution. This P212121 lattice is nearly identical to the previous C2221/ P21 lattice with the exception of a slight rotation of the homodimer about the 21 axis parallel to the unit cell a-axis. The resulting lattice is identical to that found in the ANS-bound FABP4.
Troglitazone contains two stereocenters, one at the 2-position of the chroman ring and one at the 5-position of the thiazolodine ring. Commercial preparations are found to contain equal ratios of all four possible stereoisomers (2R-5R, 2R-5S, 2S-5R, 2S-5S) with spontaneous racemization being observed at the 5-position.41,42 Since FABP4 binds many compounds non-specifically, all four isomers are probable binding partners. While the presence of stereoisomeric inhomogeneity contributes to ambiguous ligand density, the clearly-defined protein conformation (especially F57) and space-group habit warrant inclusion of the structure in this work.
A large flat region of density was visible within the binding pocket of the FABP4 structure early in the refinement process for both crystal forms. The size, shape and location of the region corresponded well to the napthalene ring system of ANS as bound to FABP4 in the PDB structure 2ANS.43 The hydroxy-tetramethyl-chroman ring system of troglitazone is similar in shape to napthalene, only somewhat larger and possessing a puckered 6-membered ring. When placed within the observed density, the methoxy-linked benzyl group can be made to extend toward the same pocket occupied by the aniline portion of ANS. The two regions are connected by a channel of density that follows the typical path of fatty acid chains along the backside of the pocket. The thiazolodine moiety is not resolved in either of the AFABP structures, consequently only the 2-position stereocenter of the chroman ring is of concern. We have found that the 2R-5R isomer is most easily fit into the observable density, though the 2S isomer could be similarly placed with a flip of the hydroxy-tetramethyl-chroman ring system.
Given the present density, it is not possible to distinguish further details in this structure and the ligand placement should be regarded as tentative, nonetheless, it is clear that troglitazone has indeed bound. An unbiased 2Fo-Fc omit map generated without ligand and F57, shows clear contiguous F57 density in the expected closed conformation (Figure 9(b)). Coordinates and structure factors have been deposited at the RCSB Protein Data Bank with the following accession codes: 2Q9S, 2QM9.
Small-angle x-ray scattering (SAXS) was performed at the Cornell High-Energy Synchrotron Source on the G1 beamline. Mutlilayer optics provided a 9.983 keV (1.242 Å) beam with 1% bandwidth. Slits were used to collimate the beam to 500 × 500 μm diameter. Sample-to-detector distance was calibrated using a silver behenate power sample and the known wavelength. Data were taken at ambient temperature and checked periodically for radiation-induced aggregation by comparison of successive scattering profiles. Signal was recorded on a Quantum 1 detector (Area Detector Systems Corporation) and averaged to obtain radial intensity profiles using DataSqueeze (www.datasqueezesoftware.com). Profile of protein solution (5 mg/ml in 20 mM TRIS, pH 7.5) was corrected for a matched buffer sample to yield a final scattering curve. Data in range of 160-16 Å (0.04 < s < 0.4, with s ≡ 4π sin(θ)/λ, 2θ = scattering angle, λ = wavelength) was used in the analysis. Model scattering curves for the crystallographic apo monomer and dimer (PDB entry 1LIB) were generated and fit to the experimental data using the CRYSOL program.44
Normal Mode Calculations were performed using the Anisotropic Network Model (ANM) program.24 Network models differ from conventional normal mode calculations based on full-atom empirical forcefields in that the protein is approximated as an essentially uniform elastic solid that is already at its equilibrium geometry by construction. Network methods should also be distinguished from essential mode techniques that attempt to extract low-frequency mode information from long-time, full atomistic molecular dynamics simulations.45 It has been shown that the lowest frequency normal modes are essentially independent of the internal structural detail of the protein and that they are determined primarily by low-resolution shape considerations.46 As such, the ANM method is insensitive to the particular starting conformation of the protein. Our calculations are based on the apo FABP4 structure (1LIB), but equivalent results have been obtained with other holo structures. Normal mode components of the actual atomic displacements due to ligand binding give a measure of the relative importance of the various modes in the observed motion. While the lowest-frequency mode reproduces the helical shifts, F57 loop motion appears only with the inclusion of the 10 most significant modes from within the group of 35 of lowest frequency.
TABLE 1.
Data Collection and Refinement Statistics
| Ligand: | linoleate | TDZ† | TDZ |
|---|---|---|---|
| Space group | C2221 | C2221 | P212121 |
| Resolution range | 12.0-2.30 | 20-2.3 | 12.0-2.31 |
| Highest shell | 2.38-2.30 | 2.43-2.31 | |
| Rsym (highest shell) | 6.6% (17%) | 10.4% | 12.4% (64%) |
| Multiplicity | 9.4 | 6.9 | 4.2 |
| I/σ overall (χ2)* | 17.0 (1.2) | - | 5.2 (1.2) |
| I/σ highest shell | 12.0 ‡ | - | 1.8 |
| Mean B value (Å2) | 20.3 | 34.1 | 22.9 |
| Reflections | 8032 | 11443 | 16232 |
| R-factor | 23.2% | 20.6% | 23.0% |
| R-free (% in test set) | 26.8% (5%) | 27.0% | 27.7% (5%) |
| Completeness | 98.7% | 99.7% | 98.4% |
| RMS Bond lengths | 0.011 | 0.05 | 0.011 |
| RMS Bond angles | 1.3° | 3.6 | 1.4° |
| RMS Dihedrals | 8.0° | 9.8 | 7.3° |
| a (Å) | 77.56 | 71.58 | 49.89 |
| b (Å) | 96.27 | 99.92 | 81.41 |
| c (Å) | 49.89 | 49.57 | 94.13 |
TDZ = troglitazone
The C2221 crystal form presented poorly-formed ligand density and was superceded by the P212121 form for detailed structural analysis. We present the data statistics here since it represents an additional lattice variation that preserves the same oligomeric state seen in the better resolved case.
〈I / σ〉 from Truncate (CCP4) using Scalepack. Error model adjusted to give χ2≈1
independent DPS/Scala results yield I/σ = 2.0 in the highest shell, 9.8 overall.
Acknowledgments
We thank Katherine Nedrow for help in Kd measurements, Rubina Yasmin for generating the GFP-FABP4-F57A mutant, Robert Jernigan and Taner Sen for the use of the of ANM program (ribosome.bb.iastate.edu/software.html), and David Bernlohr for the FABP4 vector. This work was supported by NIH grant RO1 DK60684 to NN. SDA was supported by NIH grant T32-DK715827. Data were collected at the Advanced Light Source (DOE contract DE-AC02-05CH11231), the Cornell High-Energy Synchrotron Source (NSF award DMR 0225180), NSLS (beamline X26C, with support from DOE & NIH), and MacCHESS (NIH grant RR-01646). Special thanks to Annie Héroux, for help in data collection and processing.
Footnotes
Publisher's Disclaimer: This is a PDF file of an unedited manuscript that has been accepted for publication. As a service to our customers we are providing this early version of the manuscript. The manuscript will undergo copyediting, typesetting, and review of the resulting proof before it is published in its final citable form. Please note that during the production process errors may be discovered which could affect the content, and all legal disclaimers that apply to the journal pertain.
References
- 1.Desvergne B, Wahli W. Peroxisome proliferator-activated receptors: nuclear control of metabolism. Endocr Rev. 1999;20:649–688. doi: 10.1210/edrv.20.5.0380. [DOI] [PubMed] [Google Scholar]
- 2.Forman BM, Tontonoz P, Chen J, Brun RP, Spiegelman BM, Evans RM. 15-Deoxy-delta 12, 14-prostaglandin J2 is a ligand for the adipocyte determination factor PPAR gamma. Cell. 1995;83:803–812. doi: 10.1016/0092-8674(95)90193-0. [DOI] [PubMed] [Google Scholar]
- 3.Spiegelman BM. PPAR-gamma: adipogenic regulator and thiazolidinedione receptor. Diabetes. 1998;47:507–514. doi: 10.2337/diabetes.47.4.507. [DOI] [PubMed] [Google Scholar]
- 4.Lazar MA. PPAR gamma, 10 years later. Biochimie. 2005;87:9–13. doi: 10.1016/j.biochi.2004.10.021. [DOI] [PubMed] [Google Scholar]
- 5.Zhang L, Chawla A. Role of PPARgamma in macrophage biology and atherosclerosis. Trends Endocrinol Metab. 2004;15:500–505. doi: 10.1016/j.tem.2004.10.006. [DOI] [PubMed] [Google Scholar]
- 6.Berger JP, Akiyama TE, Meinke PT. PPARs: therapeutic targets for metabolic disease. Trends Pharmacol Sci. 2005;26:244–251. doi: 10.1016/j.tips.2005.03.003. [DOI] [PubMed] [Google Scholar]
- 7.Fenner MH, Elstner E. Peroxisome proliferator-activated receptor-gamma ligands for the treatment of breast cancer. Expert Opin Investig Drugs. 2005;14:557–568. doi: 10.1517/13543784.14.6.557. [DOI] [PubMed] [Google Scholar]
- 8.Zang C, Liu H, Posch MG, Waechter M, Facklam M, Fenner MH, Ruthardt M, Possinger K, Phillip Koeffler H, Elstner E. Peroxisome proliferator-activated receptor gamma ligands induce growth inhibition and apoptosis of human B lymphocytic leukemia. Leuk Res. 2004;28:387–397. doi: 10.1016/j.leukres.2003.07.005. [DOI] [PubMed] [Google Scholar]
- 9.Tan NS, Shaw NS, Vinckenbosch N, Liu P, Yasmin R, Desvergne B, Wahli W, Noy N. Selective cooperation between fatty acid binding proteins and peroxisome proliferator-activated receptors in regulating transcription. Mol Cell Biol. 2002;22:5114–5127. doi: 10.1128/MCB.22.14.5114-5127.2002. [DOI] [PMC free article] [PubMed] [Google Scholar]
- 10.Dong D, Ruuska SE, Levinthal DJ, Noy N. Distinct roles for cellular retinoic acid-binding proteins I and II in regulating signaling by retinoic acid. J Biol Chem. 1999;274:23695–23698. doi: 10.1074/jbc.274.34.23695. [DOI] [PubMed] [Google Scholar]
- 11.Budhu AS, Noy N. Direct channeling of retinoic acid between cellular retinoic acid-binding protein II and retinoic acid receptor sensitizes mammary carcinoma cells to retinoic acid-induced growth arrest. Mol Cell Biol. 2002;22:2632–2641. doi: 10.1128/MCB.22.8.2632-2641.2002. [DOI] [PMC free article] [PubMed] [Google Scholar]
- 12.Manor D, Shmidt EN, Budhu A, Flesken-Nikitin A, Zgola M, Page R, Nikitin AY, Noy N. Mammary carcinoma suppression by cellular retinoic acid binding protein-II. Cancer Res. 2003;63:4426–4433. [PubMed] [Google Scholar]
- 13.Schug TT, Berry DC, Shaw NS, Travis SN, Noy N.Opposing effects of retinoic acid on cell growth result from alternate activation of two different nuclear receptors Cell 2007in press [DOI] [PMC free article] [PubMed] [Google Scholar]
- 14.Sessler RJ, Noy N. A ligand-activated nuclear localization signal in cellular retinoic acid binding protein-II. Molecular Cell. 2005;18:343–353. doi: 10.1016/j.molcel.2005.03.026. [DOI] [PubMed] [Google Scholar]
- 15.Ayers SD, Nedrow KL, Gillilan RE, Noy N.Continuous nucleocytoplasmic shuttling underlies transcriptional activation of PPARgamma by FABP4 Biochemistry 2007in press [DOI] [PubMed] [Google Scholar]
- 16.Ory JJ, Banaszak LJ. Studies of the Ligand Binding Reaction of Adipocyte Lipid Binding Protein Using the Fluorrescent Probe 1,8-Anilinonapthalene-8-Sulfonate. Biophysical Journal. 1999;77:1107–1116. doi: 10.1016/S0006-3495(99)76961-4. [DOI] [PMC free article] [PubMed] [Google Scholar]
- 17.Lin Q, Ruuska SE, Shaw NS, Dong D, Noy N. Ligand selectivity of the peroxisome proliferator-activated receptor alpha. Biochemistry. 1999;38:185–190. doi: 10.1021/bi9816094. [DOI] [PubMed] [Google Scholar]
- 18.Norris AW, Li E. Fluorometric titration of the CRABPs. Methods Mol Biol. 1998;89:123–139. doi: 10.1385/0-89603-438-0:123. [DOI] [PubMed] [Google Scholar]
- 19.Reese AJ, Banaszak LJ. Specificity determinants for lipids bound to beta-barrel proteins. Journal of Lipid Research. 2004;45:232–243. doi: 10.1194/jlr.M300113-JLR200. [DOI] [PubMed] [Google Scholar]
- 20.Xu ZH, Bernlohr DA, Banaszak LJ. The Adipocyte Lipid-Binding Protein at 1.6-a Resolution - Crystal-Structures of the Apoprotein and with Bound Saturated and Unsaturated Fatty-Acids. Journal of Biological Chemistry. 1993;268:7874–7884. [PubMed] [Google Scholar]
- 21.Liang J, Edelsbrunner H, Woodward C. Anatomy of protein pockets and cavities: Measurement of binding site geometry and implications for ligand design. Protein Science. 1998;7:1884–1897. doi: 10.1002/pro.5560070905. [DOI] [PMC free article] [PubMed] [Google Scholar]
- 22.Ory J, Kane CD, Simpson MA, Banaszak LJ, Bernlohr DA. Biochemical and crystallographic analyses of a portal mutant of the adipocyte lipid-binding protein. Journal of Biological Chemistry. 1997;272:9793–9801. doi: 10.1074/jbc.272.15.9793. [DOI] [PubMed] [Google Scholar]
- 23.Howlin B, Butler SA, Moss DS, Harris GW, Driessen HPC. Tlsanl - Tls Parameter-Analysis Program for Segmented Anisotropic Refinement of Macromolecular Structures. Journal of Applied Crystallography. 1993;26:622–624. [Google Scholar]
- 24.Atilgan AR, Durell SR, Jernigan RL, Demirel MC, Keskin O, Bahar I. Anisotropy of fluctuation dynamics of proteins with an elastic network model. Biophysical Journal. 2001;80:505–515. doi: 10.1016/S0006-3495(01)76033-X. [DOI] [PMC free article] [PubMed] [Google Scholar]
- 25.Nagar B, Kuriyan J. SAXS and the working protein. Structure. 2005;13:169–170. doi: 10.1016/j.str.2005.01.001. [DOI] [PubMed] [Google Scholar]
- 26.Lakowicz JR. Principles of fluorescence spectroscopy. Plenum Press; New York & London: 1983. [Google Scholar]
- 27.Prows DR, Murphy EJ, Moncecchi D, Schroeder F. Intestinal fatty acid-binding protein expression stimulates fibroblast fatty acid esterification. Chem Phys Lipids. 1996;84:47–56. doi: 10.1016/s0009-3084(96)02619-9. [DOI] [PubMed] [Google Scholar]
- 28.Coe NR, Bernlohr DA. Physiological properties and functions of intracellular fatty acid-binding proteins. Biochim Biophys Acta. 1998;1391:287–306. doi: 10.1016/s0005-2760(97)00205-1. [DOI] [PubMed] [Google Scholar]
- 29.Koshland DE, Jr., Ray WJ, Jr., Erwin MJ. Protein structure and enzyme action. Fed Proc. 1958;17:1145–1150. [PubMed] [Google Scholar]
- 30.Gunasekaran K, Ma B, Nussinov R. Is allostery an intrinsic property of all dynamic proteins? Proteins. 2004;57:433–443. doi: 10.1002/prot.20232. [DOI] [PubMed] [Google Scholar]
- 31.McCoy AJ, Grosse-Kunstleve RW, Storoni LC, Read RJ. Likelihood-enhanced fast translation functions. Acta Crystallographica Section D-Biological Crystallography. 2005;61:458–464. doi: 10.1107/S0907444905001617. [DOI] [PubMed] [Google Scholar]
- 32.Emsley P, Cowtan K. Coot: model-building tools for molecular graphics. Acta Crystallographica Section D-Biological Crystallography. 2004;60:2126–2132. doi: 10.1107/S0907444904019158. [DOI] [PubMed] [Google Scholar]
- 33.Murshudov GN, Vagin AA, Dodson EJ. Refinement of macromolecular structures by the maximum-likelihood method. Acta Crystallographica Section D-Biological Crystallography. 1997;53:240–255. doi: 10.1107/S0907444996012255. [DOI] [PubMed] [Google Scholar]
- 34.Read RJ. Improved Fourier Coefficients for Maps Using Phases from Partial Structures with Errors. Acta Crystallographica Section A. 1986;42:140–149. [Google Scholar]
- 35.Winn MD, Murshudov GN, Papiz MZ. Macromolecular TLS refinement in REFMAC at moderate resolutions. Macromolecular Crystallography, Pt D. 2003;374:300–321. doi: 10.1016/S0076-6879(03)74014-2. [DOI] [PubMed] [Google Scholar]
- 36.Painter J, Merritt EA. TLSMD web server for the generation of multi-group TLS models. Journal of Applied Crystallography. 2006;39:109–111. [Google Scholar]
- 37.Painter J, Merritt EA. A molecular viewer for the analysis of TLS rigid-body motion in macromolecules. Acta Crystallographica Section D-Biological Crystallography. 2005;61:465–471. doi: 10.1107/S0907444905001897. [DOI] [PubMed] [Google Scholar]
- 38.Merritt EA. Expanding the model: anisotropic displacement parameters in protein structure refinement. Acta Crystallographica Section D-Biological Crystallography. 1999;55:1109–1117. doi: 10.1107/s0907444999003789. [DOI] [PubMed] [Google Scholar]
- 39.Otwinowski Z, Minor W. Processing of X-ray diffraction data collected in oscillation mode. Macromolecular Crystallography, Pt A. 1997;276:307–326. doi: 10.1016/S0076-6879(97)76066-X. [DOI] [PubMed] [Google Scholar]
- 40.Steller I, Bolotovsky R, Rossmann MG. An algorithm for automatic indexing of oscillation images using Fourier analysis. Journal of Applied Crystallography. 1997;30:1036–1040. [Google Scholar]
- 41.Suzuki N, Takemura A, Miyamoto A, Yoshioka T, Tsutsumi S, Kawasaki T. Direct chiral separation of troglitazone stereoisomers using reversed-phase high-performance liquid chromatography. Journal of Pharmaceutical and Biomedical Analysis. 2002;30:823–836. doi: 10.1016/s0731-7085(02)00391-6. [DOI] [PubMed] [Google Scholar]
- 42.Kobayashi K, Fukuhara H, Hata T, Sekine A, Uekusa H, Ohashi Y. Physicochemical and crystal structure analyses of the antidiabetic agent troglitazone. Chemical & Pharmaceutical Bulletin. 2003;51:807–814. doi: 10.1248/cpb.51.807. [DOI] [PubMed] [Google Scholar]
- 43.Vyas K, Sivalakshmidevi A, Prabhakar C, Reddy GO. Troglitazone, an euglycemic antidiabetic drug. Acta Crystallographica Section C-Crystal Structure Communications. 1999;55:411–413. doi: 10.1107/s010827019801467x. [DOI] [PubMed] [Google Scholar]
- 44.Svergun D, Barberato C, Koch MHJ. CRYSOL - A program to evaluate x-ray solution scattering of biological macromolecules from atomic coordinates. Journal of Applied Crystallography. 1995;28:768–773. [Google Scholar]
- 45.Balsera MA, Wriggers W, Oono Y, Schulten K. Principal component analysis and long time protein dynamics. Journal of Physical Chemistry. 1996;100:2567–2572. [Google Scholar]
- 46.Keskin O, Jernigan RL, Bahar I. Proteins with Similar Architecture Exhibit Similar Large-Scale Dynamic Behavior. Biophysical Journal. 2000;78:2093–2106. doi: 10.1016/S0006-3495(00)76756-7. [DOI] [PMC free article] [PubMed] [Google Scholar]