

Abstract
Background
Several instruments can be used to identify patients with an unfavourable course of low back pain in general practice. However, it is unclear which instrument is the predictor of outcome.
Aim
To compare the predictive performance (that is, calibration and discrimination) of risk estimation by GPs with assessments using the Örebro Musculoskeletal Pain Screening Questionnaire, the Low Back Pain Perception Scale (LBPPS), and a prediction rule developed for this purpose.
Design of study
A prospective cohort study with 1-year follow-up.
Setting
General practice in The Netherlands.
Method
The outcome ‘unfavourable course of low back pain’ was defined as having no clinically important improvement at minimally 50% of the measurements at 6, 13, 26, and 52 weeks. Logistic regression analyses were used to study associations between potential predictors and outcome.
Results
In total, 60 GPs recruited 314 patients to the study (16 patients were excluded from analysis due to missing data on the course of low back pain). Over a third of patients (112/298) showed an unfavourable course of low back pain on follow-up. Risk estimation by GPs, the Örebro questionnaire, the LBPPS, and the prediction rule had discriminative ability (area under the curve) of 0.59 (95% CI [confidence intervals] = 0.52 to 0.66); 0.61 (95% CI = 0.54 to 0.67); 0.59 (95% CI = 0.52 to 0.66); and 0.75 (95% CI = 0.69 to 0.81) respectively. The prediction rule included history of low back pain, self-perceived risk to develop chronic low back pain, no solicitous responses of the patient's partner (as reported by the patient), frequent walking at work, and ‘pain catastrophising’.
Conclusion
Although the prediction rule performed best with regard to calibration and discrimination, it needs to be externally validated. Risk estimation by GPs performs as well as other instruments and, at present, seems to be the best available option.
Keywords: back pain, general practice, prediction rule, prognosis, screening questionnaire
INTRODUCTION
About a third of episodes of low back pain result in persistent disabling pain in that area.1,2 As this can cause great discomfort and economic loss,3 early identification of patients at risk for persistent low back pain has been advocated.4 Physicians can use several methods to identify these patients:
Risk estimation by GPs, based on clinical knowledge and expertise. GPs' assessment of patients' susceptibility to develop chronic low back pain appears to be strongly associated with long-term low back pain outcome.5
Screening questionnaires. The Örebro Musculoskeletal Pain Screening Questionnaire,6 part of the New Zealand guideline for low back pain,7 was developed to assist healthcare providers in identifying psychosocial factors that may impede recovery (‘yellow flags’). Although several studies have shown the questionnaire to be reliable and valid, these studies used return-to-work (after sick leave) as the outcome measure. Many clinicians are also concerned about recovery of function and pain.8 A second screening questionnaire is the Low Back Pain Perception Scale (LBPPS),9 which includes patients' perceptions of several aspects of low back pain.
Clinical prediction rule. This is usually derived from multivariable analysis and provides a probability of outcome for individual patients.10
How this fits in
Several instruments can be used to identify patients with an unfavourable course of low back pain in general practice. This study compared risk estimation by GPs with the performance of two existing screening questionnaires and a prediction rule (specially developed for this purpose). Although the prediction rule performed best, it still needs to be externally validated. Risk estimation by GPs seems to be the best available option at present.
Low back pain ranks among the top five most common reasons for presenting to Dutch general practice.11 As patients with acute low back pain predominantly seek healthcare advice from their GP, the general practice setting is most appropriate for early identification of an unfavourable course of low back pain. The aim of the present study was to explore which instrument is the best predictor of an unfavourable course of low back pain in a general practice population. The predictive performances of risk estimations by GPs were compared with that of the Örebro questionnaire, the LBPPS, and a prediction rule that was specially developed for this purpose.
METHOD
Study design
A prospective cohort study was conducted using participants of a cluster-randomised controlled trial.12 Patients received usual care from their GP or minimal intervention aimed at psychosocial prognostic factors (for example, fear-avoidance beliefs, distress, and ‘pain catastrophising’, that is, defining pain as awful, horrible, and unbearable). Results of the trial showed no relevant or significant difference between both groups on any outcome measure during 1 year of follow-up. The treatments have been described in detail elsewhere.12
Baseline data were collected during a home visit, and data after 6, 13, 26, and 52 weeks were collected using postal questionnaires.
Recruitment of study population
GPs were asked to select 10 consecutive patients who consulted for a new episode of low back pain (of duration less than 12 weeks) or an exacerbation of mild symptoms.
Additional inclusion criteria were:
age 18–65 years;
non-specific low back pain as main complaint; and
sufficient knowledge of the Dutch language.
Exclusion criteria were:
low back pain caused by specific pathological conditions;
low back pain currently treated by another healthcare professional; and
pregnancy.
Definition of outcome
Patients rated their recovery on a 7-point Likert scale: very much improved/much improved/slightly improved, no change/slightly worse/much worse/very much worse.13 A score of at least ‘much improved’ has been denoted a minimal-clinically important change.14 An unfavourable course of low back pain was defined as a score of ‘slightly improved’ or worse, at two or more follow-up measurements.
Four instruments
Risk estimation by GPs
During the recruitment consultation, GPs estimated individual patients' risk of developing an unfavourable course of low back pain. They were asked to score the item: ‘How do you estimate the risk that this patient will still be restricted in his/her functioning in 3 months?’ on an 11-point numerical rating scale (0–100%).
Örebro questionnaire
This questionnaire (4–210 points) is a 25-item self-administered instrument, containing items on characteristics of low back pain, psychosocial factors, and work-related factors.6 To estimate risk, 21 of the items are calculated. High scores indicate greater risk. This screening instrument has been found to have satisfactory test–retest reliability and validity6,15
With regard to the four work-related items the procedure used by Hurley et al was followed:15 patients were asked to relate these items to their paid or unpaid job. In case patients could not complete an item, the mean score on all other items of the questionnaire was imputed, provided that at least 75% of the questionnaire was completed.
Low Back Pain Perception Scale
This scale9 (0–5 points) contains a total of 5 items that could be answered ‘yes’ or ‘no’. To estimate risk of developing persistent symptoms, the number of times ‘yes’ is scored is counted. The higher the score, the greater the risk. The five items are as follows:
worrying
coping
limitations due to low back pain
expectation regarding pain relief
pain interference
Clinical prediction rule
The baseline questionnaire included several potential predictors of outcome. Characteristics of low back pain, 16–18 physical workload,19 and psychosocial factors20–25 were included. Patients also estimated their perceived risk of developing chronic low back pain (scored 0–10: 0 = no risk and 10 = very high risk)6.
Continuous variables were examined to investigate whether there was a linear relationship between the potential predictor and outcome. Potential predictors showing a non-linear relationship with outcome were categorised. When cut-off scores were available from the literature, these scores were used (for example, for somatisation). Otherwise, scores were divided into three categories (for example, age 18–30, 30–50, 50–65 years), choosing cut-off scores based on usefulness and distribution or, when this was not possible, scores were dichotomised (median split)
Univariable logistic regression analyses were then performed. Univariable odds ratios (ORs) and 95% confidence intervals (CI) were presented. Variables that were associated with outcome (P<0.20) were selected for multivariable logistic regression analysis. Before multivariable analysis was applied, the correlation between predictors was checked. In cases where there was a high correlation between two variables (Spearman or Pearson r>0.5), the predictor with the strongest univariable association with outcome was retained.
All predictors were entered simultaneously in the multivariable model. The best predictive model was constructed using a manual backward selection method. Variables with the lowest predictive value were deleted from the model until further elimination of a variable resulted in a statistically significant lower model fit, as estimated by the log likelihood ratio test (P<0.10).
A clinical prediction rule was derived in which the probability of an unfavourable course of low back pain was predicted by:
Such an absolute risk is more convenient for GPs and patients than an OR. Furthermore, in case of high event rates, ORs would provide an overestimation compared with underlying relative risks.
Analysis of predictive performance
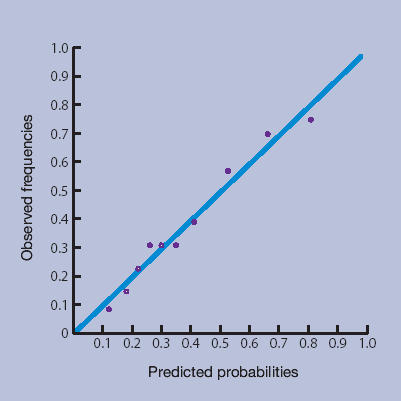
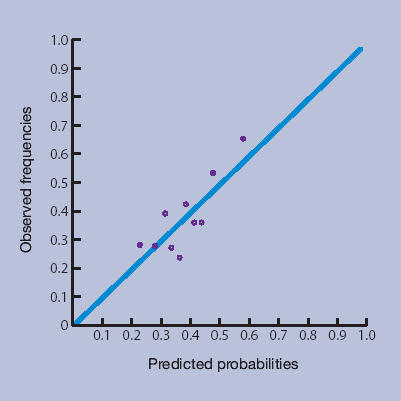
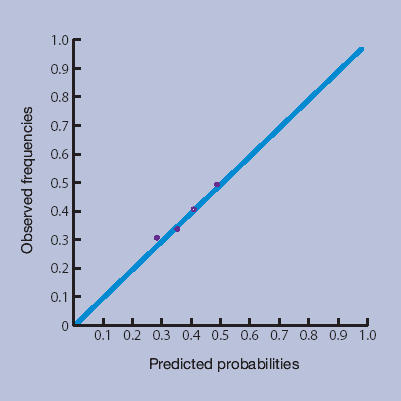
The instruments' calibration and discriminative ability were compared. Calibration refers to the agreement between observed and predicted frequencies of an outcome. Calibration of the models was assessed by plotting the predicted probabilities of an unfavourable course of low back pain against observed frequencies. For this, patients were grouped into deciles according to their predicted probability. The prevalence of the outcome measure within each decile equalled the observed frequency.
A more formal indication of calibration was obtained by fitting a linear regression model with predicted probability as the independent variable, and observed frequency as the dependent variable. If predicted risks and observed frequencies are in agreement, the intercept is equal to 0 and the slope equal to 1.26
Firstly, AUC-I was calculated from the original scores. Secondly, AUC-II was calculated after the application of two cut-off scores which resulted in 3 categories per model: low risk, medium risk, and high risk. The cut-off score for ‘high risk’ was set to the point where specificity was higher than approximately 80%; the cut-off score for ‘low risk’ was set to the point where sensitivity was higher than approximately 80%. Published cut-off scores for the Örebro questionnaire (that is, 90 and 105) were also used.27 Positive predictive values were calculated, demonstrating the probability of an unfavourable course of low back pain for each risk category.
RESULTS
Study population and baseline characteristics
Between September 2001 and April 2003, 314 patients, recruited by their GPs (n = 60), were enrolled in the study. Table 1 shows their baseline characteristics.
Table 1.
Baseline characteristics of patients (n = 314).
| Characteristic | Patients |
|---|---|
| Demographic characteristics | |
| Mean age (SD)a | 42.7 (11.6) |
| Female sex, % | 47.5 |
| Dutch nationality, % | 97.5 |
| Public health insurance, % | 69.1 |
| Educational level and work status | |
| Educational level (%)a | |
| ≤Primary | 34.0 |
| Secondary | 49.7 |
| College, university | 16.3 |
| Employed (%) | 81.5 |
| Sick leave because of low back paina(among the working population, %) | 38.2 |
| Characteristics of low back pain | |
| Duration of current episode (days, median [IQR]) | 12 (6–21) |
| Frequency of back pain episodes in last year (%) | |
| 1 or 2 episodes | 59.6 |
| 3 or more episodes | 19.1 |
| Exacerbation | 21.3 |
| Pain intensity during the day (0–10)b (mean [SD]) | 4.9 (2.0) |
| Pain radiating below knee (%)a | 13.8 |
Data of two patients are missing.
Data of one patient are missing. IQR = range (25th–75th percentile). SD = standard deviation.
Outcome
Insufficient data were available for 16 (5.1%) persons which limited the ability to determine their course of low back pain. During a follow-up of 1 year, 37.6% (112/298) of patients showed an unfavourable course of low back pain.
Variables included in the prediction rule
Table 2 presents the univariable association of potential predictors with outcome. Despite an univariable association with outcome of P<0.20, distress was not entered in the multivariable model due to strong correlations with somatisation (Pearson r = 0.51) and pain catastrophising28 [Pearson r = 0.54]). Likewise, standing was excluded because of strong correlation with walking (Pearson r = 0.67).
Table 2.
Associations of potential predictors with an unfavourable course of low back pain.
| Univariable OR (95% CI) | P-value | Multivariable OR (95% CI) | P-value | |
|---|---|---|---|---|
| Intervention group12 | ||||
| New intervention versus usual care | 1.13 (0.71 to 1.81) | 0.61 | ||
| Sociodemographic variables | ||||
| Age, years | 0.44 | |||
| 30–50 versus 18–30 | 0.77 (0.40 to 1.49) | |||
| 50–65 versus 18–30 | 0.61 (0.29 to 1.30) | |||
| Sex | 0.93 | |||
| Male versus female | 1.02 (0.64 to 1.64) | |||
| Educational level | 0.53 | |||
| Secondary versus primary | 0.77 (0.46 to 1.31) | |||
| College/university versus primary | 1.04 (0.52 to 2.08) | |||
| Employed | 0.76 | |||
| Yes versus no | 1.12 (0.54 to 2.30) | |||
| Health insurance | 0.43 | |||
| Private versus public | 0.82 (0.49 to 1.35) | |||
| Characteristics of low back pain | ||||
| Pain intensity during day (0–10)16 | 0.34 | |||
| 4–6 versus 0–3 | 0.75 (0.43 to 1.31) | |||
| 7–10 versus 0–3 | 1.12 (0.58 to 2.17) | |||
| Radiation of pain | 0.09a | |||
| Yes versus no | 1.50 (0.93 to 2.42) | |||
| Radiation of pain below knee | 0.03a | |||
| Yes versus no | 2.17 (1.10 to 4.27) | |||
| Duration of current back pain episode (days) | 0.13a | |||
| 8–30 versus 0–7 | 1.47 (0.87 to 2.49) | |||
| 31–90 versus 0–7 | 2.04 (0.98 to 4.24) | |||
| Frequency of back pain episodes in previous year | <0.001a | <0.001 | ||
| ≥3 versus 1 or 2 | 3.92 (2.39 to 6.44) | 2.89 (1.61 to 5.16) | ||
| Pain sites other than back | 0.50 | |||
| Yes versus no | 1.18 (0.72 to 1.93) | |||
| Functional disability (RDQ; 0–24)17 | 0.85 | |||
| >13 versus ≤13 (median split) | 0.96 (0.60 to 1.53) | |||
| Severity of main complaint (0–10)18 | 0.45 | |||
| >7 versus ≤7 (median split) | 1.20 (0.75 to 1.93) | |||
| Physical workload | ||||
| Sitting19 | 0.24 | |||
| Sometimes versus never/seldom | 1.55 (0.79 to 3.03) | |||
| Often/always versus never/seldom | 0.94 (0.52 to 1.70) | |||
| Standing19 | 0.13a | |||
| Per point (1–5)b | 1.19 (0.95 to 1.49) | |||
| Walking19 | 0.02a | 0.04 | ||
| Per point (1–5)b | 1.38 (1.05 to 1.82) | 1.38 (1.01 to 1.89) | ||
| Lifting19 | 0.70 | |||
| Sometimes versus never/seldom | 1.23 (0.69 to 2.19) | |||
| Often/always versus never/seldom | 0.95 (0.52 to 1.73) | |||
| Tiredness19 | 0.001a | |||
| Per point (1–5)b | 1.55 (1.21 to 2.00) | |||
| Sweating19 | 0.70 | |||
| Sometimes versus never/seldom | 1.24 (0.71 to 2.17) | |||
| Often/always versus never/seldom | 0.98 (0.51 to 1.87) | |||
| Psychosocial factors | ||||
| Fear avoidance (FABQ; 0–24)20 | 0.63 | |||
| >15 versus ≤15 (median split) | 1.12 (0.70 to 1.79) | |||
| Pain catastrophising (CSQ; 0–36)21 | <0.001a | 0.09 | ||
| Per point | 1.08 (1.04 to 1.12) | 1.04 (0.99 to 1.09) | ||
| Distress (4DSQ; 0–32)22 | 0.02a | |||
| Per point | 1.04 (1.01 to 1.08) | |||
| Somatisation (4DSQ; 0–32)22 | <0.001a | |||
| Per point | 1.10 (1.04 to 1.16) | |||
| Influence on health (1–4)23 | 0.01a | |||
| Much influence/reasonable versus | ||||
| no influence/hardly any | 0.51 (0.30 to 0.86) | |||
| Perceived general health (SF-36; 1–5)24 | 0.001a | |||
| Per point | 0.56 (0.40 to 0.78) | |||
| Responses of a significant other as perceived by patient (MPI; 0–6)25 | ||||
| Punishing responses | 0.36 | |||
| >0 versus 0 (median split) | 1.25 (0.77 to 2.03) | 0.02 | ||
| Solicitous responses | 0.06a | |||
| Per point | 0.84 (0.70 to 1.01) | 0.76(0.61 to 0.95) | ||
| Distracting responses | 0.81 | |||
| >2.3 versus ≤2.3 (median split) | 1.06 (0.66 to 1.72) | |||
| Patient estimation of the risk (0–10) to develop chronic low back pain6 | ≤0.001a | 0.01 | ||
| 4–6 versus 0–3 | 1.59 (0.89 to 2.83) | 1.19 (0.61 to 2.32) | ||
| 7–10 versus 0–3 | 5.34 (2.80 to 10.18) | 3.10 (1.44 to 6.69) | ||
P<0.20. These variables were selected as potential predictors for multivariable analysis. RDQ = Roland-Morris Disability Questionnaire.
P<0.20. These variables were selected as potential predictors for multivariable analysis.
Higher score indicates that the activity is more frequently performed. 4DSQ = 16-item subscales of the 4-Dimensional Symptom Questionnaire; CSQ = 6-item subscale of the Coping Strategies Questionnaire; FABQ = 4-item physical activity subscale of the Fear Avoidance and Beliefs Questionnaire; MPI = part two of the Multidimensional Pain Inventor; OR = odds ratio. SF-36= first question of the subscale ‘general health perceptions’ of the Short Form Health Survey. The higher the score, the higher functional disability, fear avoidance beliefs, pain catastrophising, distress, somatisation, and the perception of positive health, the more punishing, solicitous, and distracting were the responses.
Table 2 also shows the five variables (incorporating a total of 15 items) included in the multivariable prediction model after backward stepwise selection. A higher probability of an unfavourable course of low back pain was associated with a combination of three or more low back pain episodes in the previous year (including the present episode), a higher self-perceived risk of developing chronic low back pain, no solicitous responses of the patient's partner, frequent walking at work, and more pain catastrophising.
Predictive performance
Calibration
Figures 1a–1d show the calibration plots of the four prediction methods. As GPs did not use all scores on the 0–10 numerical rating scale, and scores from the LBPPS ranged from 0 to 5, classification into deciles was not possible for these instruments.
Figure 1a.
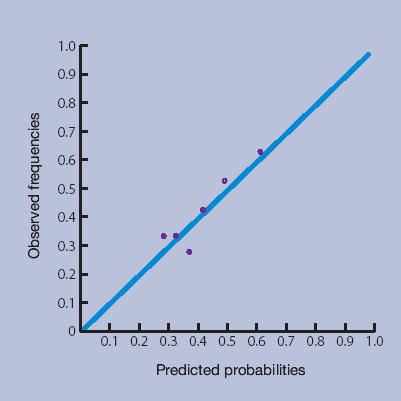
Risk estimation by the GP.
Figure 1d.
Prediction rule.
Figure 1b.
Örebro questionnaire.
Figure 1c.
Low Back Pain Perception Scale.
The plots showed good calibration for all instruments, although risk predictions by the Örebro questionnaire deviated more from observed risks of an unfavourable course of low back pain.
The more formal linear regression analysis yielded an intercept and slope for risk estimation by GPs of −0.01 (95% CI = −0.03 to 0.02) and 1.01 (95% CI = 0.95 to 1.07) respectively; for the Örebro questionnaire −0.03 (95% CI = −0.06 to −0.00) and 1.09 (95% CI = 1.01 to 1.17) respectively; for the LBPPS 0.02 (95% CI = 0.02 to 0.03) and 0.95 (95% CI = 0.93 to 0.97) respectively; and for the prediction rule −0.001 (95% CI = −0.01 to 0.01) and 1.00 (95% CI = 0.98 to 1.02) respectively.
Discriminative ability
Table 3 presents AUCs of the four instruments. The prediction rule performed best, with an AUC of 0.75 (95% CI = 0.69 to 0.81) which can be considered reasonable. Discriminative ability changed little when three risk classes were defined (Table 3).
Table 3.
Predictive performance of the four instruments.
| Positive predictive values, % (n) | |||||||
|---|---|---|---|---|---|---|---|
| AUC-I ‘original’ | AUC-II ‘3 categories’ | Cut-offs (n), sensitivity (%), and specificity (%) | Low risk | Medium risk | High risk | ||
| Risk estimation by GP (n = 283a) | 0.59 (0.52 to 0.66) | 0.58 (0.51 to 0.65) | Cut-off ≥1 Sensitivity = 86 Specificity = 17 | Cut-off ≥4 Sensitivity = 28 Specificity = 87 | 33.3 (45) | 33.0 (185) | 56.6 (53) |
| Örebro questionnaire (n = 296a) | 0.61 (0.54 to 0.67) | 0.58 (0.51 to 0.65) | Cut-off >68 Sensitivity = 79 Specificity = 26 | Cut-off >99 Sensitivity = 35 Specificity = 81 | 32.4 (71) | 32.7 (150) | 52.0 (75) |
| Linton (2002)b | 0.61 (0.54 to 0.68) | Cut-off ≥90b Sensitivity = 52 Specificity = 66 | Cut-off >105b Sensitivity = 28 Specificity = 89 | 30.3 (175) | 39.1 (69) | 59.6 (52) | |
| Low Back Pain Perception Scale (n = 298a) | 0.59 (0.52 to 0.66) | 0.57 (0.50 to 0.64) | Cut-off ≥2 Sensitivity = 80 Specificity = 27 | Cut-off ≥4 Sensitivity = 30 Specificity = 81 | 30.1 (73) | 36.1 (155) | 48.6 (70) |
| Prediction rule (n = 267a) | 0.75 (0.69 to 0.81) | 0.72 (0.66 to 0.79) | Cut-off ≥0.28 Sensitivity = 79 Specificity = 55 | Cut-off ≥0.41 Sensitivity = 57 Specificity = 81 | 18.6 (113) | 33.3 (66) | 63.6 (88) |
Incidental missing values 9.9% (GP estimation), 5.7% (Örebro questionnaire), 5.1% (Low Back Pain Perception Scale), and 15% (prediction rule).
Cut-off scores recommended by Linton.27 AUC = area under the curve.
Predictive values
Table 3 also presents information on the positive predictive values of the instruments after cut-off scores were applied. The predictive values in the low-risk categories of risk estimation by GPs, the Örebro questionnaire, and the LBPPS barely differed from the ‘middle’ categories, or from the prior probability of an unfavourable course of low back pain.
The prediction rule seemed to be more informative. Application of the classification proposed by Linton27 led to lower sensitivity, higher specificity, and somewhat higher predictive values for the Örebro questionnaire (Table 3).
DISCUSSION
Summary of main findings
The comparison of four instruments to predict an unfavourable course of low back pain in general practice showed that the newly developed prediction rule performed better than two screening questionnaires and risk estimation by GPs.
The course of low back pain was chosen for prediction instead of the presence of low back pain at a certain point in time (for example, at 26 weeks), as low back pain typically shows a recurrent course rather than single episodes of acute and chronic low back pain.29 The definition used accommodates not only the traditional classification of chronic low back pain with a duration of more than 3 months, but also the more recent call for a classification in which the recurrent nature of low back pain is emphasised.30,31
Linear regression modelling showed that, with regard to calibration, risk estimation by GPs and the prediction rule performed best (their 95% CIs for the intercept and slope included 0 and 1, respectively). Inspection of the calibration plots showed that in the range of lower probabilities, risk estimation by GPs performed less well than the prediction rule, which is also illustrated by the predictive values for the low-risk category. GPs were more capable of correctly identifying someone with a high risk of developing an unfavourable course. This is an important finding as, in general, identifying those who need to be referred to a therapist or to specialist care is an important task for GPs.
The prediction rule also performed best with regard to discriminative ability: the 95% CI for its AUC did not overlap with those of the other instruments. Methodological reasons may partly be responsible for the favourable results of the prediction rule.
GPs make risk estimations, consciously or subconsciously, when a patient consults him/her because of low back pain. Therefore, this study explored the added value of the prediction rule (as the most optimal instrument) to risk estimation by GPs only. The combination resulted in a significant improvement in discriminative ability, with an AUC of 0.74 (95% CI = 0.68 to 0.81). This is, however, just as good as the AUC of the prediction rule itself.
Comparison with existing literature
All factors but one included in the prediction rule have been previously established as predictors of chronic health problems: history of low back pain,32 high self-perceived risk,6,33 pain catastrophising,34 and physical demands at work.35 The authors are not aware of evidence for the predictor ‘(no) perceived solicitous responses of an important other’. One of the perspectives of solicitousness is ‘enhanced wellbeing’,35 meaning that increased attention by significant others may make a patient feel better.
A few other studies on the predictive validity of the Örebro questionnaire reported more favourable combinations of sensitivity and specificity.6,8,15 One of the explanations may be that those studies used absenteeism due to back pain or items included in the Örebro questionnaire as outcome measures, while the current study used outcomes that were conceptually independent from the instrument itself (recurrences,36 healthcare utilisation,36 course of low back pain). The predictive performance of the Örebro questionnaire seems to depend on the outcome variable used, which gives an indication of the clinical and research utility of the questionnaire, just as Hurley et al36 suggested.
Strengths and limitations of the study
This study tested the performance of the prediction rule in its development sample (‘apparent performance’),37 while it tested the external validity of the Örebro questionnaire and the LBPPS. Estimates of apparent performance will always be overly optimistic, as estimation (for example, of regression coefficients) and testing are performed in the same data set. Therefore, the prediction rule should not be recommended for use in general practice until it has consistently demonstrated adequate calibration and discrimination in other primary care populations (that is, external validity) and until it has been simplified from the present mathematical formula to an easy-to-use score chart format.
Information about the validity and reliability of the LBPPS has not been published, and the Dutch translation not yet been validated. Caution is recommended when considering the use of this scale for healthcare purposes.
The Örebro questionnaire includes 25 items. It appears that the scoring of the items was not always simple. However, clinicians can use the Örebro questionnaire as a tool to explore different aspects of low back pain with the patient, as this may promote the discussion of psychological factors influencing the problem.7 An exploratory study used the Örebro questionnaire to establish risk profiles, which may serve as targets for intervention.38
Three risk categories were defined in this study: low, high, and medium. The cut-off for ‘low risk’ was set to the point where sensitivity was 80% or higher as this category should not include too many patients incorrectly classified as having a good outcome, and thus incorrectly reassured regarding their prognosis. The cut-off for ‘high risk’ was set to the point where specificity was 80% or higher, as this category should not include too many patients incorrectly classified as having a poor prognosis. This might lead to unnecessary referrals for therapy or specialist care.
This method of selecting cut-off scores corresponds with everyday primary care, but may differ from cut-off scores based on optimal combinations of sensitivity and specificity. Application of different cut-offs can result in other positive predictive values for risk categories and other performances regarding discriminative ability. This was illustrated by applying the cut-off scores recommended by Linton.27
Implications for clinical practice and future research
The prediction rule performed adequately with regard to calibration and discrimination. Although the proportion of patients with an unfavourable course of low back pain (37.5%) was comparable to previous studies in general practice,1,2 the external validity of the prediction rule used in this study needs to be assessed before it can be widely used with confidence.
Currently, risk estimation by GPs appears to be the best available option to predict an unfavourable course of low back pain. This is not because this ‘instrument’ gives such excellent results, but because it is simple, the assessment can be completed quickly, and its calibration and discrimination do not differ substantially from the other two instruments.
Future research should seek to simplify and validate the prediction rule. In terms of clinical practice, once patients at risk can be identified reliably, the next challenge is to provide them with an effective intervention that will prevent the development of chronic pain.27,39,40
Acknowledgments
We thank all participating patients and GPs for their time and effort.
Funding body
This study was supported by a grant (No. 2200.0095) from The Netherlands Organisation for Health Research and Development (ZonMw), The Hague, the Netherlands
Ethics committee
The study was approved by the Medical Ethics Committee of the VU University Medical Center, Amsterdam, The Netherlands.
Competing interests
The authors have stated that there are none
REFERENCES
- 1.Thomas E, Silman AJ, Croft PR, et al. Predicting who develops chronic low back pain in primary care: a prospective study. BMJ. 1999;318:1662–1667. doi: 10.1136/bmj.318.7199.1662. [DOI] [PMC free article] [PubMed] [Google Scholar]
- 2.Jones GT, Johnson RE, Wiles NJ, et al. Predicting persistent disabling low back pain in general practice: a prospective cohort study. Br J Gen Pract. 2006;56:334–341. [PMC free article] [PubMed] [Google Scholar]
- 3.Maniadakis N, Gray A. The economic burden of back pain in the UK. Pain. 2000;84(1):95–103. doi: 10.1016/S0304-3959(99)00187-6. [DOI] [PubMed] [Google Scholar]
- 4.Valat JP. Factors involved in progression to chronicity of mechanical low back pain. Joint Bone Spine. 2005;72(3):193–195. doi: 10.1016/j.jbspin.2004.07.010. [DOI] [PubMed] [Google Scholar]
- 5.Schiotzz-Christensen B, Nielsen GL, Hansen VK, et al. Long-term prognosis of acute low back pain in patients seen in general practice: a 1-year prospective follow-up study. Fam Pract. 1999;16(3):223–232. doi: 10.1093/fampra/16.3.223. [DOI] [PubMed] [Google Scholar]
- 6.Linton SJ, Halldén K. Can we screen for problematic back pain? A screening questionnaire for predicting outcome in acute and subacute back pain. Clin J Pain. 1998;14(3):209–215. doi: 10.1097/00002508-199809000-00007. [DOI] [PubMed] [Google Scholar]
- 7.Kendall NAS, Linton SJ, Main CJ. Guide to assessing psychosocial yellow flags in acute low back pain: risk factors for long-term disability and work loss. Wellington, New Zealand: Accident Compensation Corporation and National Health Committee; 1997. [Google Scholar]
- 8.Linton SJ, Boersma K. Early identification of patients at risk of developing a persistent back problem: the predictive validity of the Örebro Musculoskeletal Pain Questionnaire. Clin J Pain. 2003;19(2):80–86. doi: 10.1097/00002508-200303000-00002. [DOI] [PubMed] [Google Scholar]
- 9.Reis S, Hermoni D, Borkan J, et al. the RMBAM Israeli Sentinel Practice Network . The LBP Patient Perception Scale: a new predictor of chronicity and other episode outcomes among primary care patients. Eilat, Israel: Abstract book, The Fourth International Forum for Primary Care Research on Low Back Pain; 2000. [Google Scholar]
- 10.Laupacis A, Sekar N, Stiell IG. Clinical prediction rules. A review and suggested modifications of methodological standards. JAMA. 1997;277(6):488–494. [PubMed] [Google Scholar]
- 11.Van der Linden MW, Westert GP, De Bakker DH, Schellevis FG. The second Dutch National Survey of General Practice: complaints and disorders in the population and general practice. Utrecht/Bilthoven: NIVEL/RIVM; 2004. [Google Scholar]
- 12.Jellema P, van der Windt DAWM, van der Horst HE, et al. Should treatment of (sub)acute low back pain be aimed at psychosocial prognostic factors? Results of a cluster-randomised clinical trial in general practice. BMJ. 2005;331:84–90. doi: 10.1136/bmj.38495.686736.E0. [DOI] [PMC free article] [PubMed] [Google Scholar]
- 13.Van Der Heijden GJ, Leffers P, Wolters PJ, et al. No effect of bipolar interferential electrotherapy and pulsed ultrasound for soft tissue shoulder disorders: a randomised controlled trial. Ann Rheum Dis. 1999;58(9):530–540. doi: 10.1136/ard.58.9.530. [DOI] [PMC free article] [PubMed] [Google Scholar]
- 14.Ostelo RW, de Vet HC. Clinically important outcomes in low back pain. Best Pract Res Clin Rheumatol. 2005;19(4):593–607. doi: 10.1016/j.berh.2005.03.003. [DOI] [PubMed] [Google Scholar]
- 15.Hurley DA, Dusoir TE, McDonough SM, et al. Biopsychosocial screening questionnaire for patients with low back pain: preliminary report of utility in physiotherapy practice in Northern Ireland. Clin J Pain. 2000;16(3):214–228. doi: 10.1097/00002508-200009000-00007. [DOI] [PubMed] [Google Scholar]
- 16.Lundeberg T, Lund I, Dahlin L, et al. Reliability and responsiveness of three different pain assessments. J Rehabil Med. 2001;33(6):279–283. doi: 10.1080/165019701753236473. [DOI] [PubMed] [Google Scholar]
- 17.Roland M, Morris R. A study of the natural history of back pain. Part I: development of a reliable and sensitive measure of disability in low back pain. Spine. 1983;8(2):141–144. doi: 10.1097/00007632-198303000-00004. [DOI] [PubMed] [Google Scholar]
- 18.Beurskens AJ, de Vet HC, Köke AJ, et al. A patient-specific approach for measuring functional status in low back pain. J Manipulative Physiol Ther. 1999;22(3):144–148. doi: 10.1016/s0161-4754(99)70127-2. [DOI] [PubMed] [Google Scholar]
- 19.Baecke JA, Burema J, Frijters J. A short questionnaire for the measurement of habitual physical activity in epidemiological studies. Am J Clin Nutr. 1982;36(5):936–942. doi: 10.1093/ajcn/36.5.936. [DOI] [PubMed] [Google Scholar]
- 20.Waddell G, Newton M, Henderson I, et al. A Fear-Avoidance Beliefs Questionnaire (FABQ) and the role of fear-avoidance beliefs in chronic low back pain and disability. Pain. 1993;52(2):157–168. doi: 10.1016/0304-3959(93)90127-B. [DOI] [PubMed] [Google Scholar]
- 21.Rosenstiel AK, Keefe FJ. The use of coping strategies in chronic low back pain patients: relationship to patient characteristics and current adjustment. Pain. 1983;17(1):33–44. doi: 10.1016/0304-3959(83)90125-2. [DOI] [PubMed] [Google Scholar]
- 22.Terluin B, van Rhenen W, Schaufeli WB, de Haan M. The four-dimensional symptom questionnaire (4DSQ): measuring distress and other mental health problems in a working population. Work Stress. 2004;18(3):187–207. [Google Scholar]
- 23.Van Poppel MN, Koes BW, Devillé W, et al. Risk factors for back pain incidence in industry: a prospective study. Pain. 1998;77(1):81–86. doi: 10.1016/S0304-3959(98)00085-2. [DOI] [PubMed] [Google Scholar]
- 24.Ware JE, Sherbourne CD. The MOS-36-item short-form health status survey (SF-36): 1. Conceptual framework and item selection. Med Care. 1992;30(6):473–483. [PubMed] [Google Scholar]
- 25.Kerns RD, Turk DC, Rudy TE. The West Haven Yale Multidimensional Pain Inventory (WHYMPI) Pain. 1986;23(4):345–356. doi: 10.1016/0304-3959(85)90004-1. [DOI] [PubMed] [Google Scholar]
- 26.Apfel CC, Kranke P, Eberhart LHJ, et al. Comparison of predictive models for postoperative nausea and vomiting. Br J Anaesth. 2002;88(2):234–240. doi: 10.1093/bja/88.2.234. [DOI] [PubMed] [Google Scholar]
- 27.Linton SJ. Early identification and intervention in the prevention of musculoskeletal pain. Am J Ind Med. 2002;41(5):433–442. doi: 10.1002/ajim.10052. [DOI] [PubMed] [Google Scholar]
- 28.Gracely RH, Geisser ME, Giesecke T, et al. Pain catastrophising and neural responses to pain among persons with fibromyalgia. Brain. 2004;127(Pt 4):835–843. doi: 10.1093/brain/awh098. [DOI] [PubMed] [Google Scholar]
- 29.Von Korff M, Saunders K. The course of back pain in primary care. Spine. 1996;21(24):2833–2837. doi: 10.1097/00007632-199612150-00004. [DOI] [PubMed] [Google Scholar]
- 30.De Vet HC, Heymans MW, Dunn KM, et al. Episodes of low back pain: a proposal for uniform definitions to be used in research. Spine. 2002;27(21):2409–2416. doi: 10.1097/01.BRS.0000030307.34002.BE. [DOI] [PubMed] [Google Scholar]
- 31.Sieben JM, Vlaeyen JW, Portegijs PJ, et al. A longitudinal study on the predictive validity of the fear-avoidance model in low back pain. Pain. 2005;117(1–2):162–170. doi: 10.1016/j.pain.2005.06.002. [DOI] [PubMed] [Google Scholar]
- 32.Truchon M, Fillion L. Biopsychosocial determinants of chronic disability and low-back pain: a review. J Occ Rehab. 2000;10(2):117–142. [Google Scholar]
- 33.Hazard RG, Haugh LD, Reid S, et al. Early prediction of chronic disability after occupational low back injury. Spine. 1996;21(8):945–951. doi: 10.1097/00007632-199604150-00008. [DOI] [PubMed] [Google Scholar]
- 34.Linton SJ. A review of psychological risk factors in back and neck pain. Spine. 2000;25(9):1148–1156. doi: 10.1097/00007632-200005010-00017. [DOI] [PubMed] [Google Scholar]
- 35.Main CJ, Parker H. Social and cultural influences on pain and disability. In: Main CJ, Spanswick CC, editors. Pain management: an interdisciplinary approach. Edinburgh: Churchill Livingstone; 2000. pp. 43–61. [Google Scholar]
- 36.Hurley DA, Dusoir TE, McDonough SM, et al. How effective is the acute low back pain screening questionnaire for predicting 1-year follow-up in patients with low back pain? Clin J Pain. 2001;17(3):256–263. doi: 10.1097/00002508-200109000-00012. [DOI] [PubMed] [Google Scholar]
- 37.Steyerberg EW, Harrell FE, Jr, Borsboom GJ, et al. Internal validation of predictive models: efficiency of some procedures for logistic regression analysis. J Clin Epidemiol. 2001;54(8):774–781. doi: 10.1016/s0895-4356(01)00341-9. [DOI] [PubMed] [Google Scholar]
- 38.Boersma K, Linton SJ. Screening to identify patients at risk: profiles of psychological risk factors for early intervention. Clin J Pain. 2005;21(1):38–43. doi: 10.1097/00002508-200501000-00005. [DOI] [PubMed] [Google Scholar]
- 39.Waddell G, Burton AK, Main CJ. Screening to identify people at risk of long-term incapacity for work: a conceptual and scientific review. London: Royal Society of Medicine Press Ltd; 2003. [Google Scholar]
- 40.Hepple P, Robertson AR. Back pain: reducing long-term problems. Br J Gen Pract. 2006;56:324–326. [PMC free article] [PubMed] [Google Scholar]