Abstract
We describe a rapid method for creating Dictyo stelium gene disruption constructs, whereby the target gene is interrupted by a drug resistance cassette using in vitro transposition. A fragment of genomic DNA containing the gene to be disrupted is amplified by PCR, cloned into a plasmid vector using topoisomerase and then employed as the substrate in an in vitro Tn5 transposition reaction. The transposing species is a fragment of DNA containing a Dictyostelium blasticidin S resistance (bsr) cassette linked to a bacterial tetracycline resistance (tetr) cassette. After transposition the plasmid DNA is transformed into Escherichia coli and clones in which the bsr-tetr cassette is inserted into the Dictyostelium target DNA are identified. To demonstrate its utility we have employed the method to disrupt the gene encoding QkgA, a novel protein kinase identified from the Dictyostelium genome sequencing project. QkgA is structurally homologous to two previously identified Dictyostelium kinases, GbpC and pats1. Like them it contains a leucine-rich repeat domain, a small GTP-binding (ras) domain and a MEKK domain. Disruption of the qkgA gene causes a marked increase in growth rate and, during development, aggregation occurs relatively slowly to form abnormally large multicellular structures.
INTRODUCTION
With the completion of a large number of genome projects there is a need for high throughput methods of generating mutants in specific genes. In vitro transposition of a selectable marker into an individual gene, or into the members of a group of clustered genes (reviewed in 1), offers just such a method and we describe its application to the social amoeba Dictyostelium. Dictyostelium is a favoured organism for studying cell biological processes such as chemotaxis, pinocytosis, phagocytosis and cellular differentiation (2). The Dictyostelium genome sequencing and EST sequencing projects are both well advanced, so there are large numbers of genes awaiting functional analysis (3,4). The organism is haploid and, provided that a gene is not essential for cell viability, its function can be studied by creating a null mutant via homologous recombination.
Many hundreds of Dictyostelium genes have been inactivated using disruption constructs, in which a drug resistance cassette is inserted into a DNA fragment containing the gene to be inactivated. Creation of the disruption cassette is normally achieved by some combination of PCR amplification, restriction enzyme digestion and ligation. In some strategies the resistance cassette simply interrupts the target gene, while in others a fragment of the target gene is deleted and replaced by the resistance cassette. There is also a PCR-based method that significantly reduces the time required to generate a disruption construct (5). While this is an elegant and useful technique, it does entail a specialised PCR procedure and there remains a need for a high throughput, ‘generic’ method of creating disruption constructs. We describe such a method and illustrate the utility of the technique using a putative protein kinase identified in the genome sequencing project.
MATERIALS AND METHODS
Construction of a transposable bsr cassette
We first generated a transposable bsr cassette containing the Dictyostelium blasticidin S (bsr) resistance cassette from Actin15ΔBamBsr (6) and the bacterial tetracycline resistance (tetr) cassette from pBR322 (Stratagene), linked in tandem. pBR322 was digested with AvaI and, after blunt-ending the AvaI site, it was digested with EcoRI to produce an AvaI (blunt)–EcoRI fragment containing tetr. Actin15ΔBamBsr was digested with BamHI and HindIII to produce a fragment containing bsr. The transposon construction vector, EZ:: TNpMOD-2MCS (catalogue no. MOD0602; Epicentre, Madison, WI), was digested with HindIII and BamHI and ligated with the bsr-containing fragment prepared in the previous step. The resulting construct was digested with SmaI and EcoRI and, finally, the vector was ligated to the tetr fragment to yield EZTN:tetr-bsr
PCR cloning of target genes from Dictyostelium genomic DNA
Dictyostelium Ax-2 cells were cultured axenically in HL-5 medium (7). Then 5 × 10⁷ cells, at a density of 5 × 10⁶ cells/ml, were harvested and genomic DNA was isolated from the cells by phenol/chloroform extraction. The target gene was PCR amplified using the genomic DNA as template and, after gel purification, the amplicons were cloned into the vector pCR2.1-TOPO by topoisomerase cloning (TOPO-TA cloning kit; Invitrogen, USA).
Insertion of the transposable bsr cassette into the target gene
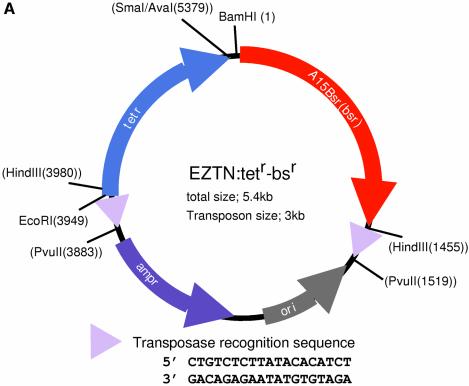
The transposable bsr cassette was excised from the EZTN:tetr-bsr vector (Fig. 1) by PvuII digestion and gel purified. The final concentration of the isolated transposon DNA was adjusted to 100 µg/ml in TE buffer. The transposon DNA was mixed with the genomic target, cloned in pCR2.1-TOPO as described in the previous section and in vitro transposition of the cassette was achieved by incubating with EZ::TN Transposase (Epicentre), following the manufacturer’s instructions. After the transposition reaction, Escherichia coli DH5α cells were transformed by electroporation and the cells were cultured on L-agar plates containing 15 µg/ml tetracycline, 50 µg/ml ampicillin and 50 µg/ml kanamycin. After 24 h of incubation at 37°C, 20–40 colonies were picked for mini-preps and the insertion point of the bsr cassette was determined by restriction enzyme digestion.
Figure 1.
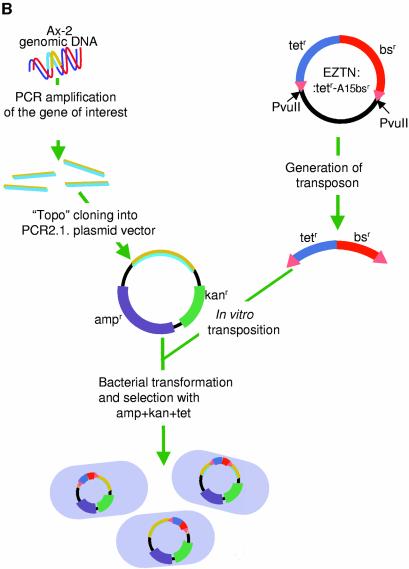
The gene disruption method. (A) Map of the plasmid EZTN:tetr-bsr. The EZTN:tetr-bsr plasmid generates a transposable blasticidin resistance (bsr) cassette that can be used to create Dictyostelium gene disruptants. In order to create EZTN:tetr-bsr, the bacterial tetr cassette, isolated from pBR322, and the Dictyostelium Actin15Bsr cassette, isolated from Actin15ΔBamBsr, were cloned into the EZ::TNpMOD2 vector (Epicentre, USA) as indicated. The 19 bp Tn5 transposon recognition sequences are represented as triangles and their sequence is shown below the map. The plasmid has PvuII sites flanking the transposable element and the transposable blasticidin resistance cassette is usually generated by PvuII digestion of the construct. (B) Diagrammatic representation of the scheme for gene disruption. A fragment of genomic DNA is isolated by PCR and inserted, by topoisomerase cloning, into pCR2.1-TOPO, a vector that confers resistance to ampicillin and kanamycin. In vitro transposition is then performed using transposon DNA prepared as in (A). The resultant DNA molecules are recovered by transformation into E.coli using a triple drug selection, with ampicillin, kanamycin and tetracycline.
Transformation of Dictyostelium cells and selection of mutants
Plasmid DNA, containing an insertion of the transposable bsr cassette, in the target DNA, was linearised by restriction digestion, usually with NotI, and used to transform Dictyo stelium Ax-2 cells by electroporation (8). The transformed clones were grown in HL-5 medium containing 10 µg/ml blasticidin S (Cayla, France). Subsequently, the cell suspension was diluted and co-cultured with Klebsiella aerogenes on agar plates in order to obtain separate clones. The colonies were collected from the plates and individually transferred to 24-well culture plates containing HL-5 medium with blasticidin S.
Insertion of the bsr cassette into the genomic DNA was confirmed by PCR analysis. The sequence of one of the two primers was derived from one end of the blasticidin resistance cassette while the second primer sequence was chosen from a region of the target gene outside the area that was used to produce the disruption construct. Depending upon the orientation in which the transposon had inserted into the target for disruption, one or other of the sequences 5′-ataaagcattgtaatcttctctgtcgc-3′ (appropriate for the case shown here) or 5′-aaactacgattgaagaactcattccactc-3′ (appropriate for the opposite orientation) was used. A gradient-PCR machine (Master Cycler Gradient; Eppendorf, Germany) was used to ensure optimal amplification. The typical program used for the PCR reaction was 94°C for 10 min, 30 cycles of 94°C for 1 min, 52–66°C (gradient) for 1 min and 68°C for 3 min, followed by 68°C for 10 min.
Phenotypic analysis of the mutants
Selected qkgA gene disruptants were tested for several phenotypic characteristics. The rate of cell growth was monitored by growing the cells in shaking culture in HL-5 medium at 22°C. For morphological analysis of development, washed cells were spotted on a 1.5% water–agar plate at a density of 5 × 10⁵ per cm2 and the progress of development was monitored by time-lapse recording with a CCD camera (Cool Pics CCD; Roper Science, USA). After filming, quantitative analyses, such as measurement of the average slug length, were performed using NIH Image software (version 1.61; NIH, USA).
RESULTS
Construction of a transposable Dictyostelium gene disruption cassette
In order to use transposition for the production of Dictyostelium gene disruption constructs, a transposable blasticidin resistance cassette was created (Fig. 1A). The cassette contains a bacterial tetracycline resistance cassette linked to a Dictyostelium blasticidin resistance (bsr) cassette. The method utilises a commercially available, hyper-activated form of the Tn5 transposase that directs the in vitro insertion of transposons into a target DNA at a high frequency (Fig. 1B). The target, normally 2–3 kb in length, is cloned using topoisomerase into a vector that contains both an amplicillin and a kanamycin selection cassette. In order to maximise the number of clones with the transposable bsr cassette in the target gene, rather than elsewhere in the plasmid, transformants are triply selected on plates containing ampicillin, kanamycin and tetracycline. Clones which have the transposable tetr-bsr cassette inserted in either of the two resistance cassettes, or in the origin of replication, will be eliminated by this selection.
Characteristics of the qkgA gene
The putative kinase that was disrupted, QkgA (Fig. 2A), was selected as part of a bio-informatic based search for receptor tyrosine kinases (T.Abe and J.G.Williams, unpublished data). The sequence encoding QkgA (accession no. AAL92986) is listed in the NCBI database as a RTK, a homologue of the mammalian focal adhesion kinases (FAKs). However, we believe this to be the result of erroneous automatic annotation during the chromosome II sequence analysis (3). This conclusion stems from detailed bio-informatic analysis of the protein.
Figure 2.
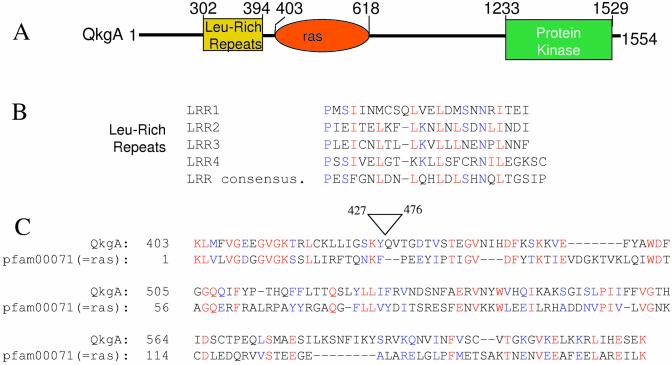
Domain analysis of the qkgA gene. (A) Schematic of the domain structure of QkgA. The qkgA gene contains a domain comprised of four copies of the leucine-rich repeat (LRR) sequence, a ras domain and a kinase domain. The approximate boundaries of each domain are indicated. (B) Alignment of the leucine-rich repeat (LRR) sequences of QkgA. The four leucine-rich repeats of QkgA are shown aligned with a consensus LRR sequence (9). (C) Alignment of QkgA sequences with pfam0007, a ras domain from the Pfam database. The search (query) sequence was a manually deleted version of region 427–476 of qkgA. This deletion removes a very serine-rich, ‘simple sequence’ region. The ‘subject’ sequence is pfam00071. The E value with this pfam member is 6e–07.
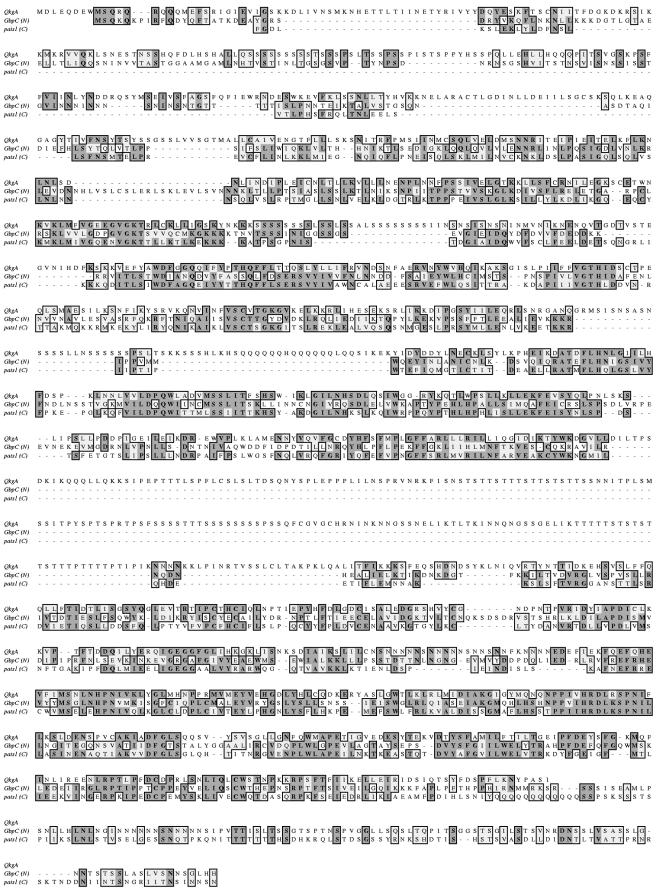
In a BLAST search, the two proteins showing highest homology to QkgA are the Dictyostelium GbpC (9) and pats1 proteins (10). Homology extends across most of GskgA, with a region of non-homology near the N-terminus of QkgA and with two short insertions near the centre of QkgA (Fig. 3). GbpC contains a leucine-rich repeat (LRR) domain, a ras domain, two rasGEF domains, a kinase domain and two cGMP-binding domains. pats1 contains LRRs, WD40 repeats, a tyrosine phosphatase domain, a rho domain and a kinase domain. The regions of homology between GbpC, pats1 and QkgA include the LRRs, the ras domain (identified as a rho domain in pats1) and the kinase domain (Fig. 3).
Figure 3.
In a BLAST search at NCBI using the QkgA sequence (databases updated 9 April, 2003; all non-redundant GenBank CDS translations + PDB + SwissProt + PIR + PRF; 1 442 039 sequences; 463 592 631 total letters), GbpC and pats1 were the most closely related proteins. There were also many other proteins with homology to the predicted kinase domain of QkgA but the top hits were all dual specificity kinases, not (as the original annotation would have predicted) receptor tyrosine kinases. This is a Clustal W analysis showing regions of homology between QkgA, GbpC and pats1. Both the pats1 and the GbpC proteins are significantly larger than QkgA. In order to simplify the alignment by Clustal W (which is length sensitive) only the homologous subregions of pats1 [1400–2500 = pats1(C)] and GbpC [1–1300 = GbpC(N)] were used.
Alignment with the consensus sequence for LRRs confirms the presence of four copies of the LRR in QkgA (Fig. 2B). The region of QkgA showing homology to the ‘ras domain’ of GbpC and ‘rho domain’ of pats1 shows a slightly better fit to a ras domain (Fig. 2C). However, both the ras and rho domains are highly related, small GTP-binding domains. After GbpC and pats1, the next most closely related hits in a BLAST search with QkgA are the kinase domains of CTR1-like, ethylene-responsive kinases of various plant species (32–34% identity; data not shown). These are mitogen-activated, extracellular signal-regulated protein kinase kinase kinase (MEKK) family members that, although hybrid in sequence between serine-threonine and tyrosine kinases, phosphorylate only serine and threonine. GbpC and pats1 were also putatively designated as MEKKs, based on the same criteria (9,10).
Disruption of the qkgA gene
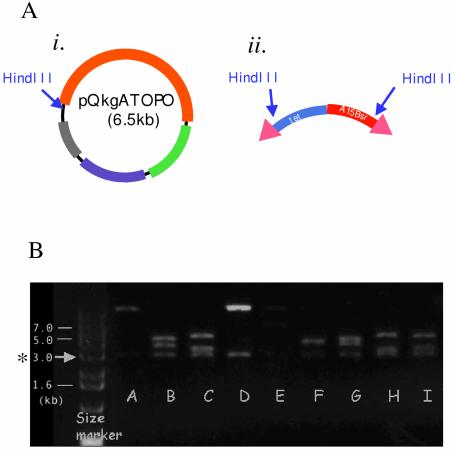
A 2.6 kb sequence from the predicted open reading frame of qkgA was cloned, by topoisomerase cloning of a PCR fragment of genomic Dictyostelium DNA, into the pCR2.1-TOPO vector. The resultant plasmid, pQkgATOPO (Fig. 4A), was then used in an in vitro transposition reaction (Fig. 1B). In order to determine whether the transposable cassette was inserted in the target, DNA from colonies growing on the selection plates was analysed by restriction enzyme digestion. Figure 4B shows an example of such an analysis, performed using HindIII.
Figure 4.
Transposition of the bsr cassette into qkgA. (A) A 2.6 kb fragment of qkgA (encoding amino acids M1–I980) was PCR amplified and cloned into pCR2.1-TOPO, to create the target for disruption. The orange line represents the cloned qkgA fragment and its single HindIII site is marked by an arrow (i). Two HindIII sites located near each end of the bsr cassette are also marked with arrows (ii) (described in Fig. 1A). (B) Examples of HindIII digests of minipreps prepared from the bacteria transformed with the product of an in vitro transposition of the cassette (ii) into qkgATOPO (i). Nine examples are shown in lanes A–I. Since there is a HindIII site located very near each end of the transposable bsr cassette (ii), one of the bands has a constant size of 3 kb (marked with an asterisk).
Analysis of the restriction enzyme mapping data showed that 22 out of 30 clones, i.e. about 70% of clones, contain the transposable cassette inserted into the qkgA target sequence. This is close to expectation. The vector’s non-essential sequence content (i.e. that sequence which is neither origin of replication nor drug resistance cassette) is ∼0.5 kb. Hence, assuming an equal probability of insertion in all parts of the DNA and with a ‘target’ fragment of X kb, the expected rate of insertion in the target gene is X/(X + 0.5) × 100 (%). Therefore, in the case of a 2 kb target, 80% of the total number of clones would be expected to carry the transposable cassette in the target. This construct, pQkgATOPO, seems to be typical in this respect, because in a series of disruption experiments using a number of different targets, we have found very similar frequencies (Table 1). The expected values range from 71 to 84%, while the measured values range from 63 to 77% (Table 1). There is a weak, imperfect correlation between target size and frequency of insertion into target, but the range of expected values (i.e. 71–84%) is too small to be reliably tested with this sample size (30 clones analysed).
Table 1. Summary of disruption constructs generated using transposition.
| Putative protein kinase | Length of DNA sequence used for the disruption construct (kb) | Successful insertion events (%) (expected value in parentheses) (n = 30) |
|---|---|---|
| QkgA | 2.6 | 73 (84) |
| K1 | 2.0 | 77 (80) |
| K4 | 1.2 | 63 (71) |
| K7 | 1.5 | 70 (75) |
Although we have not analysed this issue statistically, the position of insertion of the transposon does appear to be random with respect to position within the coding region. Also, in a large number of experiments using genomic DNA fragments of 1–3 kb that give a final plasmid size of 8–10 kb, we have not observed any clones with a rearrangement (data not shown).
Disruption of the genomic copy of the qkgA gene
In the particular case described here a mixture of five qkgA disruptant constructs with the cassette inserted at different points was linearised and used to transform Dictyostelium cells. A mixture was used to increase the chance that one of them might have an optimal configuration for gene disruption. In other studies we have instead successfully used a single disruptant plasmid, with the cassette inserted at a selected position in the target gene (normally near the beginning of the gene, to minimise the probability of producing a biologically inactive truncated protein).
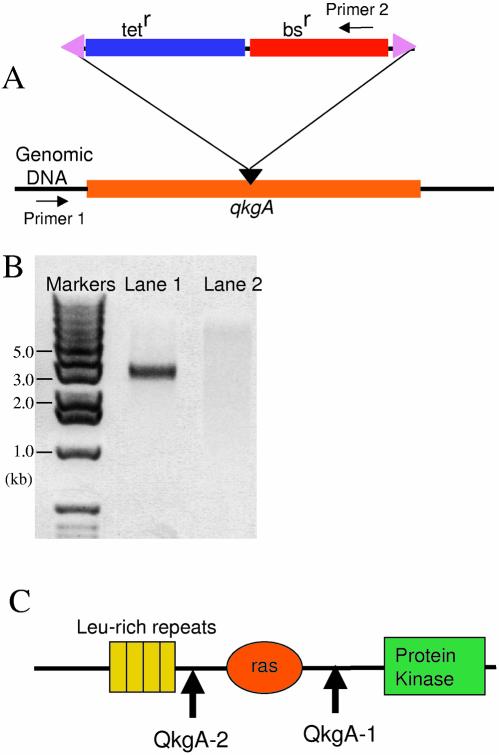
After electroporation, the transformed Dictyostelium cells were selected by growth on blasticidin. Purified genomic DNA of the individual transformed clones was tested for homologous insertion of the blasticidin resistance cassette into the genomic target by PCR. A pair of primers was used; one located outside the target sequence, the second complementary to a sequence within the blasticidin resistance cassette (Fig. 5A). The presence of a band in PCR (Fig. 5B, lane 1) confirms successful insertion of the transposon cassette into the qkgA gene and the fact that the band is 3 kb in size shows that this particular disruption construct (qkgA–1) has the approximate structure shown in Figure 5C.
Figure 5.
PCR confirmation of insertion of the transposable bsr cassette in the qkgA locus and determination of the transposon insertion point. (A) A schematic diagram of the qkgA locus and the inserted bsr cassette. The orange line indicates that part of the qkgA open reading frame which was used as the target for disruption. The position of insertion of the bsr cassette is marked with a black triangle. The two primers used for PCR confirmation are indicated with arrows and marked primers 1 and 2. (B) Two examples of clones. Genomic DNA was isolated from the clones grown in selective medium containing blasticidin. Lanes 1 and 2 show the results of PCR with the primers described in (A). The sample analysed in lane 1 shows successful insertion of the selection cassette into qkgA, while the absence of a band in lane 2 suggests a non-homologous insertion of the cassette elsewhere in the chromosome. (C) Following PCR confirmation of transposon insertion in the genomic target, the insertion point was estimated from the size of the amplicons. The arrows indicate the approximate insertion points of two separate clones, QkgA-1 and QkgA-2.
qkgA– mutants grow more quickly than parental cells
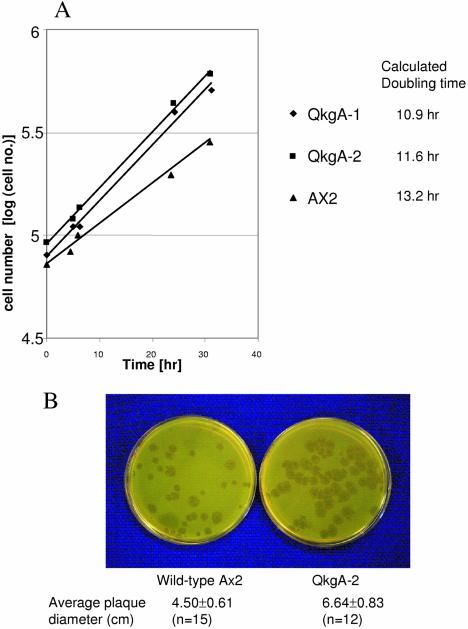
Two separate qkgA null clones with different vector insertion points, qkgA–1 and qkgA–2 (Fig. 5C), were characterised in parallel. The growth rates of both mutant strains were first tested in semi-defined medium. Both mutants grow substantially faster than parental Ax-2 cells (Fig. 6). The doubling time of parental Ax-2 cells under these conditions is 14 h and the qkgA disruption strains have a doubling time that is approximately 3 h faster than this. In order to determine whether qkgA null cells also grow quicker on bacteria, we examined the colony size of qkgA null clones on bacterial culture plates. The sizes of the plaques of cleared cells were significantly larger than for parental, control cells (Fig. 6B).
Figure 6.
Growth rate comparison of qkgA– and parental Ax-2 cells. (A) Cells growing in HL-5 medium. The vertical axis represents the common logarithm of cell number and the horizontal axis represents the time of culture in hours starting from the first sampling point. Triangles, Ax-2 wild-type cells; diamonds, qkgA– strain1 C3; square, qkgA– strain 2. The doubling time was calculated after curve fitting. (B) Cells feeding on bacterial lawns. Pre-cultured cells of the qkgA– mutant clone QkgA-2 and wild-type control strain Ax-2 in HL-5 medium were harvested, washed in KK2 (16.5 mM KH2PO4, 3.8 mM K2HPO4, pH 6.2) and co-cultured with K.aerogenes on SM plates. After 5 days of incubation, the size of the plaques was measured.
qkgA– strains display delayed development and aberrant size regulation
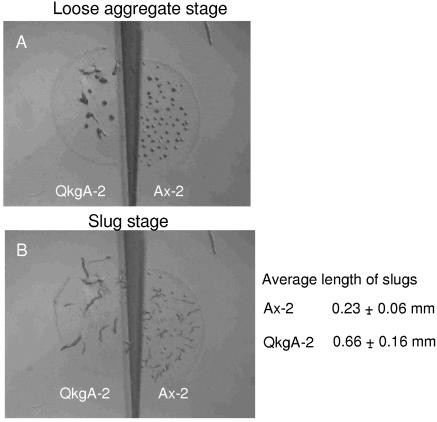
Time-lapse filming of developing cells showed that the aggregation stage of qkgA– strains is extended by ∼2–3 h relative to parental cells (data not shown). Thereafter, the rate of development is relatively normal. Also, qkgA– cells produce fewer aggregation centres, that are considerably larger than wild-type aggregates (Fig. 7A). These larger aggregates retain their size, rather than splitting into smaller masses. This results in the formation of very large slugs and culminants (Fig. 7B). We also analysed pattern formation in the mutants, using the pre-stalk-specific lacZ markers ecmAO:lacZ and ecmB:lacZ, but expression of these markers displays the normal, parental patterns (data not shown).
Figure 7.
Parallel development of qkgA– mutant and parental Ax-2 cells. qkgA– mutant strain QkgA-2 and the wild-type control Ax-2 were monitored side-by-side with time-lapse recording. The figure shows two frames of the recorded film. The left-hand side of the frame shows the QkgA-2 mutant cells and the right-hand side shows the Ax-2 cells. (A) Frame for 9 h; (B) frame for 17 h. The average lengths of the slugs were measured using the data in (B).
DISCUSSION
Dictyostelium is a widely used ‘model’ organism and one of its principal attractions is the ease with which genes can be inactivated by homologous gene disruption. The transposon-based method of generating a disruption construct we describe significantly accelerates the process and renders it routine; all that changes from construction to construction are the two PCR primers used to clone the target DNA from the genome. As such, it lends itself to high throughput analysis and we have successfully used it to inactivate a number of other Dictyostelium genes. The fact that a set of disruption constructs is generated, which contain the blasticidin cassette inserted at different positions, is a potential further bonus, because it is possible to choose a clone with the insert at a particular position within the target gene or with particular lengths of genomic DNA sequence flanking the cassette.
As an illustration of the method, we describe the disruption of a novel kinase identified in the genome sequencing project, qkgA. This has as its closest homologues the Dictyostelium GbpC and pats1 proteins. A double null strain, mutant in both gbpC and in a related gene gbpD, is defective in myosin phosphorylation and chemotaxis (11), while the null mutant for pats1 is defective in cytokinesis (10). Disruption of qkgA affects the speed of both growth and development.
As might be expected, several Dictyostelium mutants show reduced growth rates compared to their parental cells (12,13). Interestingly, however, qkgA– cells grow significantly faster than wild-type Ax-2 cells. A previously described mutant that grows more quickly than parental cells is the null mutant for DGAP1. This seems unlikely, however, to be of significance here because DGAP1 is a homologue of the rasGTPases that inactivate ras proteins (if DGAP1 were a GAP for QkgA a DGAP1 null mutant would be expected to show the opposite behaviour to a qkgA null, i.e. slower growth).
Upon development, the qkgA– mutant shows a marked increase in the territory size of the aggregates. A number of other Dictyostelium mutants also make larger aggregates (reviewed in 14). However, in most of these mutants, the aggregates produce multiple tips that split the mass into smaller slugs. This does not occur in the aggregates formed by qkgA– cells. In this respect they resemble null mutants in the countin gene. Countin is a secreted, hydrophilic protein that seems to form part of a size determination mechanism for the multicellular organism; in the countin null mutant giant slugs and fruiting bodies are formed (10). It will be of interest to determine whether there is any mechanistic link between qkgA and the countin system.
Acknowledgments
ACKNOWLEDGEMENTS
We would like to thank C. Schilde for helping in the preparation of the manuscript and M. K. Nelson for critical reading of the manuscript. This work was supported by Wellcome Trust Program Grant 039899/Z to J.G.W.
REFERENCES
- 1.Hamer L., DeZwaan,T.M., Montenegro-Chamorro,M.V., Frank,S.A. and Hamer,J.E. (2001) Recent advances in large-scale transposon mutagenesis. Curr. Opin. Chem. Biol., 5, 67–73. [DOI] [PubMed] [Google Scholar]
- 2.Kessin R.H. (2001) Dictyostelium—Evolution, Cell Biology and the Development of Multicellularity. Cambridge University Press, Cambridge, UK. [Google Scholar]
- 3.Glockner G., Eichinger,L., Szafranski,K., Pachebat,J.A., Bankier,A.T., Dear,P.H., Lehmann,D., Baumgart,C., Parra,G., Abril,J.F. et al. (2002) Sequence and analysis of chromosome 2 of Dictyostelium discoideum. Nature, 418, 79–85. [DOI] [PubMed] [Google Scholar]
- 4.Morio T., Urushihara,H., Saito,T., Ugawa,Y., Mizuno,H., Yoshida,M., Yoshino,R., Mitra,B.N., Pi,M., Sato,T. et al. (1998) The Dictyostelium developmental cDNA project: generation and analysis of expressed sequence tags from the first-finger stage of development. DNA Res., 5, 335–340. [DOI] [PubMed] [Google Scholar]
- 5.Kuwayama H., Obara,S., Morio,T., Katoh,M., Urushihara,H. and Tanaka,Y. (2002) PCR-mediated generation of a gene disruption construct without the use of DNA ligase and plasmid vectors. Nucleic Acids Res., 30, U14–U18. [DOI] [PMC free article] [PubMed] [Google Scholar]
- 6.Adachi H., Hasebe,T., Yoshinaga,K., Ohta,T. and Sutoh,K. (1994) Isolation of Dictyostelium discoideum cytokinesis mutants by restriction enzyme-mediated integration of the blasticidin S resistance marker. Biochem. Biophys. Res. Commun., 205, 1808–1814. [DOI] [PubMed] [Google Scholar]
- 7.Watts D.J. and Ashworth,J.M. (1970) Growth of myxameobae of the cellular slime mould Dictyostelium discoideum in axenic culture. Biochem. J., 119, 171–174. [DOI] [PMC free article] [PubMed] [Google Scholar]
- 8.Knecht D. and Pang,K.M. (1995) Electroporation of Dictyostelium discoideum. Methods Mol. Biol., 47, 321–330. [DOI] [PubMed] [Google Scholar]
- 9.Goldberg J.M., Bosgraaf,L., van Haastert,P.J.M. and Smith,J.L. (2002) Identification of four candidate cGMP targets in Dictyostelium. Proc. Natl Acad. Sci. USA, 99, 6749–6754. [DOI] [PMC free article] [PubMed] [Google Scholar]
- 10.Abysalh J.C., Kuchnicki,A.L. and Larochelle,D.A. (2003) The identification of Pats1, a novel gene locus required for cytokinesis in Dictyostelium discoideum. Mol. Biol. Cell, 14, 14–25. [DOI] [PMC free article] [PubMed] [Google Scholar]
- 11.Bosgraaf L., Russcher,H., Smith,J.L., Wessels,D., Soll,D.R. and van Haastert,P.J.M. (2002) A novel cGMP signalling pathway mediating myosin phosphorylation and chemotaxis in Dictyostelium. EMBO J., 21, 4560–4570. [DOI] [PMC free article] [PubMed] [Google Scholar]
- 12.Sharma S.K., Brock,D.A., Ammann,R.R., DeShazo,T., Khosla,M., Gomer,R.H. and Weeks,G. (2002) The cdk5 homologue, crp, regulates endocytosis and secretion in Dictyostelium and is necessary for optimum growth and differentiation. Dev. Biol., 247, 1–10. [DOI] [PubMed] [Google Scholar]
- 13.Rivero F., Furukawa,R., Fechheimer,M. and Noegel,A.A. (1999) Three actin cross-linking proteins, the 34 kDa actin-bundling protein, alpha-actinin and gelation factor (ABP-120), have both unique and redundant roles in the growth and development of Dictyostelium. J. Cell Sci., 112, 2737–2751. [DOI] [PubMed] [Google Scholar]
- 14.Brock D.A. and Gomer,R.H. (1999) A cell-counting factor regulating structure size in Dictyostelium. Genes Dev., 13, 1960–1969. [DOI] [PMC free article] [PubMed] [Google Scholar]


