

Abstract
Background
Good blood pressure (BP) control reduces the risk of complications in people with type 2 diabetes, yet many do not achieve this. Guidelines for managing hypertension recommend increasing antihypertensive medications until control is achieved, but the effect of such recommendations in routine primary care is unknown.
Aim
To evaluate the effectiveness of a BP treatment algorithm in primary care patients with type 2 diabetes.
Design of study
A cluster randomised controlled trial of 1534 patients with type 2 diabetes.
Setting
Forty-two practices in Nottingham, UK.
Method
Practices were randomised to continue usual care or to use a treatment algorithm designed so that practice nurses and GPs would increase antihypertensive treatment in steps until the target of 140/80mmHg was reached. Participants were assessed by a clinical interview and case note review at recruitment and at 1 year. The primary outcome measure was the proportion of participants achieving target BP at 1 year.
Results
At 1 year there was no difference between the proportions of participants with well controlled BP in the intervention and control arms (36.6% versus 34.3%; P = 0.27). Mean systolic and diastolic blood pressures were identical in the two arms (143/78 mmHg). There was some evidence that participants in the intervention arm were more likely to be receiving higher doses of their antihypertensive drugs, although there was no significant difference in the number of different antihypertensive drugs prescribed.
Participants in the intervention arm had a higher rate of primary care BP-related consultations over 12 months than those receiving usual care (rate ratio = 1.55, 95% confidence interval [CI] = 1.26 to 1.88, P<0.001).
Conclusion
Despite increased monitoring and possibly higher doses of medication there was no improvement in blood pressure control. Improvements achieved by specialist nurse-led clinics in secondary care may not translate to people with type 2 diabetes in primary care settings.
Keywords: hypertension, primary care, type 2 diabetes mellitus
INTRODUCTION
Evidence of the benefits of good blood pressure (BP) control in people with diabetes is extensive.1,2 Whether it can be achieved in routine primary care is less clear despite the production of several sets of national guidelines.3–5 The effect of financial incentives for improving BP management, which forms part of the new GMS contract, remains to be seen.
It has been estimated that only three additional consultations per year would be required to achieve the BP outcomes obtained in the UK Prospective Diabetes Study.6 With the increasing involvement of practice nurses in diabetes care,7 and the introduction of nurse prescribing,8 practice nurses are likely to have a greater role in the management of hypertension in people with diabetes. In addition, a recent review suggested that nurse-led management of hypertension could lead to better control due to more rigorous application of guidelines and an increased, or more appropriate, use of medication.9 Several small studies based in secondary care have demonstrated the benefits of nurse-led hypertension clinics.10,11
However, recent studies suggest that many people with diabetes do not reach recommended BP targets. Approximately 40% of people with diabetes registered at general practices in the UK, including those already receiving antihypertensive treatment, have a BP>140/85 mmHg12,13 and 27% of those with type 2 diabetes and BP>140/85 mmHg do not receive any antihypertensive medication.13
A trial of the use of an algorithm to advise GPs and practice nurses on antihypertensive drug titration was undertaken to assess the feasibility of achieving better BP control in a primary care population of patients with type 2 diabetes. A cluster randomised design was used to prevent practices restricting the use of the algorithm to intervention arm participants in an individually randomised study.
METHOD
Study design
A randomised controlled trial with cluster randomisation at the general practice level.
Study practices and eligibility
All 123 general practices in Nottingham were invited to participate by letter, of which 42 were recruited. Practices completed a questionnaire detailing list size and number of GPs and practice nurses. Questionnaires were sent to the nurse most involved in diabetes care in each practice to collect data on organisation of diabetes services, use of guidelines, whether the practices had agreed BP targets, and whether they negotiated individual targets with patients. The same questionnaire was also sent to non-participating practices in Nottingham to enable comparison of participating and non-participating practices. Data on list size, practice Townsend score, and proportion of patients from an ethnic minority group were obtained from the former Nottingham Health Authority for all practices in Nottingham.
Participants and eligibility criteria
Patients were eligible to participate if they were aged 18 to 80 years and had type 2 diabetes defined according to WHO criteria14 and had not required insulin within 12 months of diagnosis. Exclusion criteria were life expectancy of less than 1 year and inability to give informed consent or to attend the practice for appointments. Patients were invited to participate by letter from their GP. Those agreeing were invited to a consultation with a researcher at their practice, at which written consent was obtained and baseline measurements were made.
Intervention
The trial had two arms: intervention arm practices were provided with an algorithm for treatment and monitoring of hypertension based on British Hypertension Society (BHS) guidelines (1999)4 (Figure 1), and control arm practices continued to provide usual care. The algorithm was designed for use by practice nurses and GPs as it included measuring, monitoring, and treating hypertension. It was based on monthly blood pressure checks and increasing specified antihypertensive treatment until the target of <140/80 mmHg was obtained, the threshold for starting treatment being ≥140/90 mmHg. Training in using the algorithm was provided for practice nurses and guidelines were given for its use. The intervention lasted for 1 year after participant recruitment. Practices were provided with clinical data recorded at recruitment and informed of any conditions requiring immediate attention.
Figure 1.
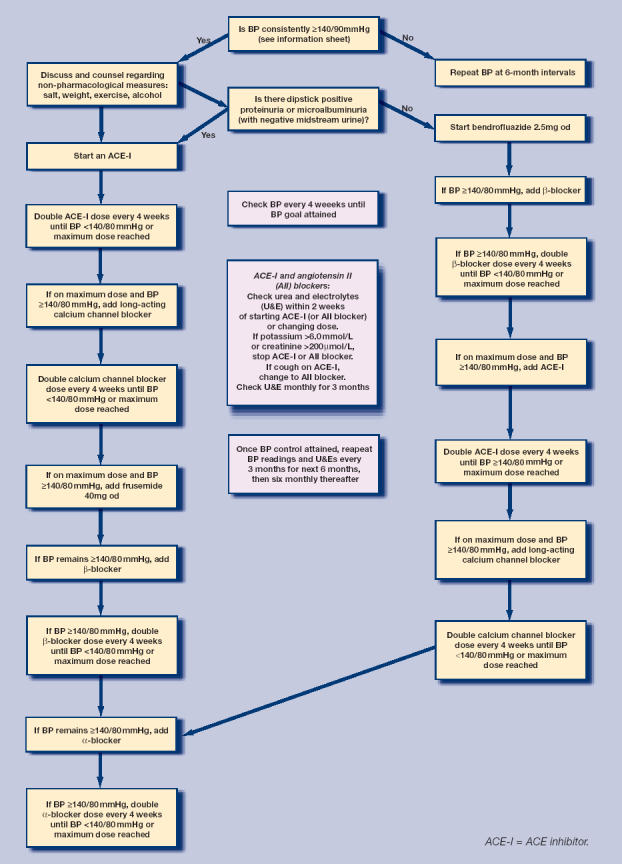
Algorithm for the management of hypertension
How this fits in
Good blood pressure control reduces the risk of complications in people with type 2 diabetes. Forty per cent of people with diabetes in primary care in the UK have a blood pressure above recommended target levels and one-quarter are not receiving antihypertensive treatment. A treatment algorithm for use by practice nurses and GPs increased blood pressure monitoring but did not improve blood pressure control. Strategies aimed at getting practices to prescribe more and patients to take, more antihypertensive drugs may have a limited effect.
Objectives
The aim of the trial was to assess the effectiveness of the algorithm in achieving target BP in people with type 2 diabetes in primary care.
Outcomes
All outcomes were measured at the level of the participant. The primary outcome measure was the proportion of participants who achieved target BP at the 1-year follow up, defined as <140/80 mmHg or <140/90 mmHg in those receiving and not receiving antihypertensive medication respectively.4 Secondary outcome measures included the proportion of participants with BP<140/80 mmHg, mean systolic and diastolic BP, number of BP related consultations, proportion of participants taking antihypertensive medication, number of drug classes and dose, and overall satisfaction with care.
Baseline and outcome measurements were made by standardised clinical assessment and case note review at recruitment and at 11 to 13 months post recruitment. Details recorded included postcode, duration of diabetes, smoking status, alcohol consumption, past or current evidence of macrovascular complications, current medication, height and weight, foot examination and fundoscopy (from district retinal screening programme). Two BP readings were taken using a calibrated semi-automated oscillometric device (Omron HEM-705CP) following a 5-minute rest. A third reading was taken if there was more than a 10% difference and the mean of the last two readings was recorded. Laboratory investigations included serum glycosylated haemoglobin, cholesterol and creatinine, and random urine albumin creatinine ratio. Participants were defined as having microvascular complications if they had evidence of retinopathy, abnormal foot sensation using a 10G monofilament, or urine albumin creatinine ratio above 2.5 mg/mmol or 3.5 mg/mmol in males and females, respectively.
Twelve months post recruitment participants were asked to complete a questionnaire about satisfaction with care. Data were collected from practice records on the number of GP or practice nurse visits during which BP was measured, BP medication was adjusted, or BP was discussed between the baseline and follow up assessment visits.
Blinding
It was not possible to blind the researcher carrying out the baseline and follow-up assessments to the treatment arm. However, observer bias in the primary outcome measure was minimised by using a semi-automated BP machine. The print-out of the readings was signed by each participant to verify the origin.
Sample size calculation
The outcome measure used for the sample size calculation was the proportion of participants achieving target BP 1 year after recruitment to the trial. It was estimated that 40% of people with type 2 diabetes in the control arm would achieve target BP using data from a contemporary community-based study.15 To detect an increase to 50% in the intervention arm, with 80% power and a 5% significance level (two-sided), and assuming an average cluster size of 45, and an intracluster correlation coefficient (ICC) of 0.02,16the number of participants required per arm would be 765, equating to 17 practices per arm. This calculation allowed for 10% loss to follow up.
Allocation of practices to intervention or control arm
Minimisation was used to allocate practices to the treatment arm using the MINIM program.17 The variables used for minimisation were list size (dichotomised at the median for Nottingham practices), ethnicity (dichotomised at the median proportion for Nottingham practices) and practice Townsend score (≤0 and >0 based on 1991 census). The allocation to study arm was performed by an investigator blind to each practice's identity. Participants were not aware of which group the practice had been allocated to at the time of recruitment.
Statistical methods
Data were entered into an Access database, verified by checking a 10% random sample, and analysed using Stata (version 7). Analyses were undertaken on an intention-to-treat basis according to a pre-specified plan and blind to identity of treatment arm. Outcome measures were compared between the treatment arms using random effects models containing a random intercept term with participants at level 1 and practice at level 2. Logistic models were used for binary data, linear models for continuous data, and negative binomial models for count data. All models were adjusted for the minimisation stratum (added as a fixed effect). A further analysis was undertaken adjusting for the baseline value of the outcome variable and variables imbalanced at baseline. Sensitivity analyses were carried out to investigate the influence of missing values for blood pressure at follow up by replacing them with baseline values. Intracluster correlation coefficients were calculated for outcome variables. Tests for interaction were carried out for the primary outcome measure to identify differences by age, deprivation, satisfaction with care, treatment with antihypertensives at baseline and whether BP was controlled at baseline.
RESULTS
The recruitment of general practices and participants with diabetes is shown in Figure 2. Forty-two practices were recruited, 20 allocated to the intervention arm, and 22 to the control arm. Thirty-nine per cent (1534/3940) of the eligible patients agreed to take part. The mean number of patients recruited per practice was 37 (median = 31, range = 2–84). The follow-up assessment was completed in 93% of participants (1420/1534). Participants were recruited between 1 October 2001 and 30 September 2002 and follow-up assessments were carried out between 1 October 2002 and 30September 2003.
Figure 2.
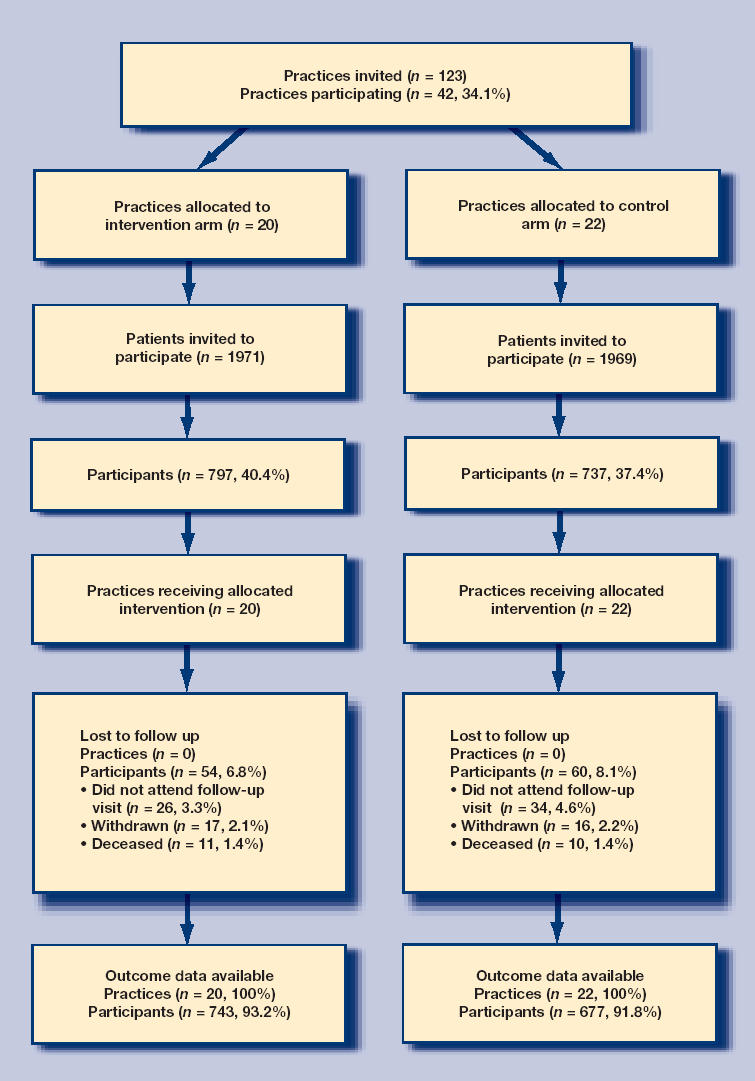
Flow of participants through the study
The baseline characteristics of participants are shown in Table 1. The intervention and control arms were similar for most measures, but there were small differences for sex, ethnic group, years since diagnosis of diabetes, and the proportion with macrovascular complications. The characteristics of study practices are shown in Table 2. There were some differences between practices in the two arms: practices in the intervention arm were smaller, less likely to have agreed a BP target, and more likely to negotiate BP targets with almost all or many patients.
Table 1.
Baseline characteristics of participants: n (%) unless otherwise stated.
| Participant characteristics | Intervention arm n = 797 | Control arm n = 737 |
|---|---|---|
| Mean age (SD) | 64.3 (9.9) | 64.3 (10.0) |
| Males | 464 (58.2) | 443 (60.1) |
| Ethnic group: non-white | 61 (7.7) | 83 (11.3) |
| Years since diagnosis of diabetes | ||
| 0–5 | 437 (54.8) | 395 (53.6) |
| 6–10 | 184 (23.1) | 190 (25.8) |
| 11–15 | 107 (13.4) | 85 (11.5) |
| >15 | 69 (8.7) | 67 (9.1) |
| Diabetes controlled by | ||
| Diet | 191 (24.0) | 150 (20.4) |
| Oral medication | 504 (63.2) | 497 (67.4) |
| Insulin | 102 (12.8) | 90 (12.2) |
| Mean systolic blood pressure (SD) [3] | 146 (21) | 146 (19) |
| Mean diastolic blood pressure (SD) [3] | 80 (10) | 80 (10) |
| Controlled blood pressure [3] | 264 (33.3) | 228 (30.9) |
| Receiving treatment for hypertension | 540 (67.8) | 505 (68.5) |
| Number of antihypertensive medications: | ||
| 0 | 257 (32.3) | 232 (31.5) |
| 1 | 199 (25.0) | 191 (25.9) |
| 2 | 204 (25.6) | 185 (25.1) |
| 3 | 103 (12.9) | 89 (12.1) |
| 4 | 30 (3.8) | 36 (4.9) |
| 5 | 3 (0.4) | 3 (0.4) |
| 6 | 1 (0.1) | 1 (0.1) |
| Median (IQR) | 1 (0,2) | 1(0,2) |
| Prescribed >50% of maximum dose of antihypertensivesa | 269 (50.6) | 260 (52.6) |
| Mean body mass index (SD)[2] | 30.0 (5.3) | 30.2 (3.4) |
| Current smoker [1] | 119 (14.9) | 104 (14.1) |
| Macrovascular complicationsb | 263 (33.0) | 228 (30.9) |
| Microvascular complicationsc[173] | 314 (44.6) | 292 (44.4) |
| Mean glycosylated haemoglobin (SD) [10] | 7.7 (1.4) | 7.7 (1.5) |
Calculated by summing percentage of maximum recommended dose prescribed for each antihypertensive drug and dividing by number of prescribed antihypertensive drugs. Loop diuretics have been excluded from this analysis.
Defined as a history of ischaemic heart disease, cerebrovascular disease, or peripheral vascular disease.
Defined as the presence of retinopathy, abnormal albumin creatinine ratio or peripheral neuropathy. IQR = interquartile range. [] = missing values. SD = standard deviation.
Table 2.
Baseline characteristics of practices.
| Practice characteristics | Intervention arm n = 20 | Control arm n = 22 |
|---|---|---|
| Median (IQR) | Median (IQR) | |
| List size | 4615 (2969–7056) | 5593 (2475–6834) |
| Number of WTE GPs | 3.0 (1.4–3.7) | 2.8 (1.0–3.3) |
| Number of WTE nurses | 1.5 (1.1–2.0) | 1.5 (1.0–2.0) |
| Number of patients with diabetes | 134 (68–196) | 127 (73–183) |
| Practice Townsend score [1] | 0.06 (−0.73–2.85) | −0.19 (−1.49–2.87) |
| Percentage of practice population from non-white ethnic group [1] | 6.3 (3.1–8.2) | 6.8 (2.7–10.2) |
| n (%) | n (%) | |
| Practice has agreed BP target | 14 (70.0) | 21 (95.5) |
| BP target agreed by practice, mmHg | ||
| <140/80 | 13 (92.9) | 17 (81.0) |
| 140/80–160/95 | 1 (7.1) | 4 (19.1) |
| Practice negotiates targets with | ||
| Almost all or many patients | 12 (60.0) | 11 (50.0) |
| A few or hardly any patients | 8 (40.0) | 11 (50.0) |
[] = missing values. BP = blood pressure. IQR = interquartile range. WTE = whole time equivalent.
Primary outcome measure
Table 3 shows that there was no significant difference between the proportions of participants with controlled BP in the intervention (36.6%) and control (34.3%) arms at 1 year (odds ratio [OR] = 1.23, 95% confidence interval [CI] = 0.85 to 1.78).
Table 3.
Primary and secondary outcome measures comparing intervention arm to control arm: n (%) unless stated otherwise.
| Intervention arm n = 743 | Control arm n = 677 | ICC | OR (95% CI) | P-value | |
|---|---|---|---|---|---|
| Primary outcome measure | |||||
| Controlled blood pressure | 272 (36.6) | 232 (34.3) | 0.035 | 1.23 (0.85 to 1.78) | 0.27 |
| Secondary outcome measures | |||||
| Categorical outcome measures | OR (95% CI) | ||||
| BP <140/80mmHg | 245 (33.0) | 202 (29.8) | 0.041 | 1.27 (0.86 to 1.89) | 0.23 |
| Prescribed antihypertensives | 526 (70.8) | 471 (69.6) | 0.050 | 1.30 (0.85 to 1.97) | 0.23 |
| Prescribed >50% of max dose of antihypertensives | 301 (58.2) | 248 (53.1) | 0.033 | 1.50 (1.03 to 2.17) | 0.03 |
| Satisfied with care (versus neither/dissatisfied) [161] | 560 (83.7) | 504 (85.4) | 0.007 | 0.84 (0.59 to 1.19) | 0.32 |
| Continuous outcome measures | Difference between means (95% CI) | ||||
| Mean systolic BP (SD) | 143.3 (19.5) | 143.1 (17.7) | 0.034 | −1.30 (−4.43 to 1.83) | 0.42 |
| Mean diastolic BP (SD) | 78.2 (10.2) | 77.9 (10.4) | 0.039 | −0.11 (−1.78 to 1.56) | 0.90 |
| Count outcome measures | RR (95% CI) | ||||
| Number of antihypertensive drugs prescribed | 0.054 | 1.07 (0.91 to 1.26) | 0.42 | ||
| 0 | 217 (29.2) | 206 (30.4) | |||
| 1 | 180 (24.2) | 157 (23.2) | |||
| 2 | 181 (24.4) | 165 (24.4) | |||
| 3 | 115 (15.5) | 111 (16.4) | |||
| 4 | 41 (5.5) | 27 (4.0) | |||
| 5 | 6 (0.8) | 9 (1.3) | |||
| 6 | 3 (0.4) | 2 (0.3) | |||
| Median (IQR) | 1(0,2) | 1(0,2) | |||
| Number of BP consultations [17] | 0.174 | 1.50 (1.25 to 1.80) | <0.001 | ||
| 0 | 24 (3.3) | 54 (8.1) | |||
| 1 | 73 (10.0) | 122 (18.2) | |||
| 2 | 108 (14.7) | 114 (17.0) | |||
| 3 | 117 (16.0) | 99 (14.8) | |||
| 4 | 91 (12.4) | 89 (13.3) | |||
| 5 | 82 (11.2) | 63 (9.4) | |||
| ≥6 | 238 (32.5) | 129 (19.3) | |||
| Rate/year | 4.9 | 3.7 | |||
[] = missing values. BP = blood pressure. ICC = intraccluster correlation coefficient. OR = odds ratio. RR = rate ratio.
Secondary outcome measures
Table 3 also shows that there was no significant difference between treatment arms for systolic BP (mean 143mmHg, standard deviation [SD] = 20 both arms) or diastolic BP (mean 78 mmHg, SD = 10 both arms), the proportion prescribed antihypertensive drugs (intervention arm 70.8% versus control arm 69.6%, OR = 1.30, 95% CI = 0.85 to 1.97), or the number of antihypertensive drugs prescribed (intervention arm median 1, interquartile range [IQR] = 0.2 versus control arm median 1, IQR = 0.2; rate ratio = 1.07, 95% CI = 0.91 to 1.26). There was some evidence that intervention arm participants may be more likely to have received more than 50% of the maximum dose of their antihypertensive drugs (intervention arm 58.2% versus control arm 53.1%, OR = 1.50, 95% CI = 1.03 to 2.17).
The consultation rate for BP in the intervention arm was significantly greater than in the control arm (intervention arm 4.9 per person per year, control arm 3.7 per person per year; rate ratio = 1.50, 95% CI = 1.25 to 1.80). There was no significant difference in satisfaction with care between the two arms.
Results for primary and secondary outcome measures were similar when adjusted for baseline values of the outcome variables and variables imbalanced at baseline.
Ancillary analyses
The was no evidence of any difference in the effect of the intervention on the primary outcome according to the age of participants, deprivation, satisfaction with care received, treatment with antihypertensives at baseline, and whether BP was controlled at baseline (all tests for interaction P>0.05).
Results were similar when missing values for controlled BP and systolic and diastolic BP at follow-up were replaced by baseline values.
DISCUSSION
Summary of main findings
This study failed to demonstrate a significant improvement in BP control in people with type 2 diabetes when general practices were provided with a treatment algorithm and training of practice nurses in its use. Participants in the intervention arm were found to have a higher rate of BP-related consultations than those receiving usual care. There was some evidence that they may be more likely to have received more than 50% of the maximum dose of their antihypertensive drugs, although there was no significant difference in the number of such drugs prescribed. At the end of the trial two-thirds of participants still did not achieve recommended BP targets.
Strengths and limitations of the study
This study involved a large number of people with type 2 diabetes at 42 practices. Trial participants have been previously compared with non-participants from the same practices and participating and non-participating practices revealing that the study participants are representative of the type 2 diabetic population in Nottingham.18 Therefore, these results may be generalisable to the population with type 2 diabetes in Nottingham, and to other urban populations in the UK. The trial achieved a high follow-up rate. As data were collected by face-to-face contact between participants and researchers, very few data were missing.
From discussions with practice nurses and GPs who took part in the study it was recognised that the algorithm was not used in the same way in all practices. In some practices the intervention was predominantly used by the nurses with GPs only involved in prescribing. In others, patients were seen by both the nurse and the GP, while in some practices the practice nurse had minimal involvement with the doctor both monitoring BP and adjusting treatment. These differences were due to a number of factors including the level of experience and training of the practice nurses and GPs, practice organisation, and levels of staffing. This situation reflects the reality of service provision in primary care and is likely to reflect the way this algorithm would be applied in practice.
One possible explanation for this trial's failure to demonstrate improvements in BP control is that practice nurses and GPs may not have complied with the treatment algorithm. The study's findings of a higher rate of BP-related consultations and some evidence of a greater proportion of participants receiving more than 50% of the maximum dose of antihypertensive drugs in the intervention arm suggests that practice nurses and GPs did comply with the algorithm, at least to some degree.
However, full compliance would have resulted in the prescription of a greater number of antihypertensive drugs. Participants reaching the end of the treatment algorithm would receive six antihypertensive drugs, but only three intervention arm participants received this number of drugs. It is possible that nurses and GPs increased the dose of antihypertensives that were already prescribed in accordance with the algorithm, but did not prescribe additional classes of antihypertensive drugs, or that participants preferred increases in the dose of existing medications to taking additional drugs. Although the study intervention included training for practice nurses in the use of the algorithm and guidelines about its use, it did not include other elements which may have increased compliance, such as reminders and feedback.19 Similarly, the intervention did not include specific strategies aimed at educating patients or increasing their involvement in treatment decisions, and it is possible that such interventions could have resulted in better patient outcomes.19
There is concern that guidelines for managing hypertension will result in patients requiring up to four, or possibly more, classes of antihypertensive drugs to meet current targets,20,21 with diminishing benefits in terms of cardiovascular risk for additional drugs and increasing risks of side effects or interactions.21 The population in this study was already receiving prescriptions for a high number of antihypertensive drugs. At follow up one-third of those prescribed antihypertensive drugs were prescribed three or more drugs. For some participants the decision not to prescribe additional drugs may reflect a rational and deliberate decision by both patient and practitioner after considering the level of absolute risk of an adverse event against the inconvenience and risk of side effects and interactions. The algorithm was based on titrating drugs up to the maximum tolerated dose before adding an additional antihypertensive whereas the more recent BHS guidelines advocate combining drugs at lower doses.5 The finding that participants in the intervention arm did not receive additional antihypertensive drugs may indicate potential difficulties in compliance with the most recent BHS guidelines.
A post-hoc power calculation using data from the trial and an intracluster correlation coefficient of 0.035 for controlled BP, an average cluster size of 34, and 34% of control group participants having well controlled BP, indicate an 82% power to detect an absolute difference of 11% in the percentage with controlled BP at the 5% significance level. It was therefore considered unlikely that insufficient power can explain the study's findings. However, these findings do not exclude the possibility that the intervention increases the percentage of participants with controlled BP by a smaller percentage, which may be clinically important. While this may be true, the magnitude of effect that was powered to detect was much smaller than demonstrated by secondary care studies demonstrating the benefits of nurse-led hypertension clinics.10
Comparison with existing literature
These findings should be viewed in the context of two recent trials. The first demonstrated that a secondary care nurse-led clinic could result in significant reductions in BP10 compared with usual care. This trial achieved five follow-up visits for each participant over 6 months. The second trial of a nurse-led intervention, which failed to demonstrate significant reductions in blood pressure, but demonstrated improvements in other cardiovascular risk factors, achieved only a median of two follow-up visits over a 1-year period.11 It is therefore possible that the current study's negative findings may relate to either the intensity or the duration of the intervention. Despite a significantly higher rate of consultations among intervention arm participants than those in the control arm, some participants may not have reached the point at which additional antihypertensives were recommended, especially as treatment changes are likely to have been based on repeated BP measurements rather than single measurements. However, onethird of intervention arm participants had six or more consultations over the 1-year period and the feasibility, and acceptability to patients, of increasing the consultation rate further in primary care in the UK is unknown.
A further potential explanation for the contrasting findings between the current trial and those of the secondary care nurse-led clinic may be differences in baseline blood pressure. Baseline BP in both treatment arms in this trial (mean 158/87 mmHg and 161/88 mmHg in the control and intervention arms, respectively)10 was considerably higher than in the current trial. Consequently, there was greater potential for improvement.
Overall these data suggest that improving BP control in practice is not as easy as suggested by data extrapolated from large clinical trials, such as the UKPDS.6 It is likely that improvements in BP control would be more expensive than was suggested in the health economic analysis of UKPDS data.6
Implications for future research and clinical practice
This trial has demonstrated that improvements in BP control achieved by specialist nurse-led clinics in secondary care may not be translatable to people with type 2 diabetes in primary care settings. It is possible that strategies, such as feedback from health professionals and reminders, could enhance practitioner compliance with such an algorithm. A nurse-led intervention to improve patient medication compliance, or patient education and greater involvement in decision-making could also enhance patient compliance, but such strategies require further evaluation.22,23,24 Strategies aimed at getting practices to prescribe, and patients to take more antihypertensive drugs may have a limited effect as many patients are already prescribed three or more drugs. A considerable proportion of people with diabetes are not achieving recommended BP targets and the provision of guidelines and training in their use seem unlikely to substantially increase this in the near future.
Acknowledgments
We thank Maureen Smith and Diane Havard for help with data collection, Viv Savage and Joanne Daws for secretarial support, Neil Pound for help with database design, and particular thanks to the staff at the participating surgeries for all their help and to all the patients who took part in the study and to the Trent Collaborative Research Network for helping to recruit practices.
Funding body
The study was funded by a grant from the NHS Executive, Trent, UK (RBG00XX7)
Ethics committee
Nottingham City Hospital Ethics Committee (EC00/194)
Competing interests
The authors have stated that there are none
REFERENCES
- 1.UK Prospective Diabetes Study Group. Cost effectiveness analysis of improved blood pressure control in hypertensive patients with type 2 diabetes: UKPDS 40. BMJ. 1998;317:720–726. [PMC free article] [PubMed] [Google Scholar]
- 2.UK Prospective Diabetes Study Group. Tight blood pressure control and risk of macrovascular and microvascular complications in type 2 diabetes: UKPDS 38. BMJ. 1998;317:703–713. [PMC free article] [PubMed] [Google Scholar]
- 3.National Institute for Clinical Excellence. Management of type 2 diabetes: management of blood pressure and blood lipids. London: National Institute for Clinical Excellence; 2002. [Google Scholar]
- 4.Ramsay LE, Williams B, Johnston, et al. Guidelines for the management of hypertension: report of the third working party of the British Hypertension Society. J Hum Hypertens. 1999;13(9):569–592. doi: 10.1038/sj.jhh.1000917. [DOI] [PubMed] [Google Scholar]
- 5.Williams B, Poulter NR, Brown MJ, et al. Guidelines for management of hypertension: report of the fourth working party of the British Hypertension Society, 2004-BHS IV. J Hum Hypertens. 2004;18(3):139–185. doi: 10.1038/sj.jhh.1001683. [DOI] [PubMed] [Google Scholar]
- 6.Gray A, Clarke P, Farmer A, Holman R. Implementing intensive control of blood glucose concentration and blood pressure in type 2 diabetes in England: cost analysis (UKPDS 63) BMJ. 2002;325(7369):860–865. doi: 10.1136/bmj.325.7369.860. [DOI] [PMC free article] [PubMed] [Google Scholar]
- 7.Pierce M, Agarwal G, Ridout D. A survey of diabetes care in general practice in England and Wales. Br J Gen Pract. 2000;50(456):542–545. [PMC free article] [PubMed] [Google Scholar]
- 8.Department of Health. Extending independent nurse prescribing within the NHS in England: a guide for implementation. 2nd edn. London: Department of Health; 2004. [Google Scholar]
- 9.Oakeshott P, Kerry SM, Austin A, Cappuccio FP. Is there a role for nurse-led blood pressure management in primary care? Fam Pract. 2003;20(4):469–473. doi: 10.1093/fampra/cmg424. [DOI] [PubMed] [Google Scholar]
- 10.Denver EA, Barnard M, Woolfson RG, Earle KA. Management of uncontrolled hypertension in a nurse-led clinic compared with conventional care for patients with type 2 diabetes. Diabetes Care. 2003;26:2256–2260. doi: 10.2337/diacare.26.8.2256. [DOI] [PubMed] [Google Scholar]
- 11.New JP, Mason JM, Freemantle N, et al. Specialist nurse-led intervention to treat and control hypertension and hyperlipidemia in diabetes (SPLINT): a randomised controlled trial. Diabetes Care. 2003;26(8):2250–2255. doi: 10.2337/diacare.26.8.2250. [DOI] [PubMed] [Google Scholar]
- 12.Hippisley-Cox J, O'Hanlon S, Coupland C. Association of deprivation, ethnicity, and sex with quality indicators for diabetes: population based survey of 53,000 patients in primary care. BMJ. 2004;329(7477):1267–1269. doi: 10.1136/bmj.38279.588125.7C. [DOI] [PMC free article] [PubMed] [Google Scholar]
- 13.Hippisley-Cox J, Pringle M. Prevalence, care, and outcomes for patients with diet-controlled diabetes in general practice: cross sectional survey. Lancet. 2004;364(9432):423–428. doi: 10.1016/S0140-6736(04)16765-2. [DOI] [PubMed] [Google Scholar]
- 14.World Health Organisation. Definition, diagnosis and classification of diabetes mellitus and its complications. Geneva: World Health Organisation; 1999. [Google Scholar]
- 15.Munro N, Lawrenson R, Feher M. 12 months post UKPDS and HOT: impact on BP targets and antihypertensive drug prescribing in the community. Diabet Med. 2000;17(S1):79. [Google Scholar]
- 16.Ukoumunne OC, Gulliford MC, Chinn S, et al. Methods for evaluating area-wide and organisation-based interventions in health and health care: a systematic review. Health Technol Assess. 1999;3(5):iii–92. [PubMed] [Google Scholar]
- 17.Evans S, Royston P, Day S. Minim: allocation by minimisation in clinical trials. http://www-users.york.ac.uk/~mb55/guide/minim.htm (accessed 11 Jan 2007)
- 18.Bebb C, Kendrick D, Stewart J, et al. Inequalities in glycaemic control in patients with type 2 diabetes in primary care. Diabetic Medicine. 2005;22(10):1364–1371. doi: 10.1111/j.1464-5491.2005.01662.x. [DOI] [PubMed] [Google Scholar]
- 19.Weingarten SR, Henning JM, Badamgarav E, et al. Interventions used in disease management programmes for patients with chronic illness — which ones work? Meta-analysis of published reports. BMJ. 2002;325(7370):925–932. doi: 10.1136/bmj.325.7370.925. [DOI] [PMC free article] [PubMed] [Google Scholar]
- 20.Winocour PH. Effective diabetes care: a need for realistic targets. BMJ. 2002;324(7353):1577–1580. doi: 10.1136/bmj.324.7353.1577. [DOI] [PMC free article] [PubMed] [Google Scholar]
- 21.Campbell NC, Murchie P. Treating hypertension with guidelines in general practice. BMJ. 2004;329(7465):523–524. doi: 10.1136/bmj.329.7465.523. [DOI] [PMC free article] [PubMed] [Google Scholar]
- 22.New JP, Mason JM, Freemantle N, et al. Educational outreach in diabetes to encourage practice nurses to use primary care hypertension and hyperlipidaemia guidelines (EDEN): a randomised controlled trial. Diabet Med. 2004;21(6):599–603. doi: 10.1111/j.1464-5491.2004.01213.x. [DOI] [PubMed] [Google Scholar]
- 23.Pill R, Stott NC, Rollnick SR, Rees M. A randomised controlled trial of an intervention designed to improve the care given in general practice to Type II diabetic patients: patient outcomes and professional ability to change behaviour. Fam Pract. 1998;15(3):229–235. doi: 10.1093/fampra/15.3.229. [DOI] [PubMed] [Google Scholar]
- 24.Kinmonth AL, Woodcock A, Griffin S, et al. Randomised controlled trial of patient centred care of diabetes in general practice: impact on current wellbeing and future disease risk. BMJ. 1998;317(7167):1202–1208. doi: 10.1136/bmj.317.7167.1202. [DOI] [PMC free article] [PubMed] [Google Scholar]