Abstract
Interplay between organ (breathing) motion and leaf motion has been shown in the literature to have a small dosimetric impact for clinical conditions (over a 30 fraction treatment). However, previous studies did not consider the case of treatment beams made up of many few-monitor-unit (MU) segments, where the segment delivery time (1–2 s) is of the order of the breathing period (3–5 s). In this study we assess if breathing compromises the radiotherapy treatment with IMRT segments of low number of MUs. We assess (i) how delivered dose varies, from patient to patient, with the number of MU per segment, (ii) if this delivered dose is identical to the average dose calculated without motion over the path of the motion, and (iii) the impact of the daily variation of the delivered dose as a function of MU per segment. The organ motion was studied along two orthogonal directions, representing the left-right and cranial-caudal directions of organ movement for a patient setup in the supine position. Breathing motion was modeled as sin(x), sin4(x), and sin6(x), based on functions used in the literature to represent organ motion. Measurements were performed with an ionization chamber and films. For a systematic study of motion effects, a MATLAB simulation was written to model organ movement and dose delivery. In the case of a single beam made up of one single segment, the dose delivered to point in a moving target over 30 fractions can vary up to 20% and 10% for segments of 10 MU and 20 MU, respectively. This dose error occurs because the tumor spends most of the time near the edges of the radiation beam. In the case of a single beam made of multiple segments with low MU, we observed 2.4%, 3.3%, and 4.3% differences, respectively, for sin(x), sin4(x), and sin6(x) motion, between delivered dose and motion-averaged dose for points in the penumbra region of the beam and over 30 fractions. In approximately 5–10% of the cases, differences between the motion-averaged dose and the delivered 30-fraction dose could reach 6%, 8% and 10–12%, respectively for sin(x), sin4(x), and sin6(x) motion. To analyze a clinical IMRT beam, two patient plans were randomly selected. For one of the patients, the beams showed a likelihood of up to 25.6% that the delivered dose would deviate from the motion-averaged dose by more than 1%. For the second patient, there was a likelihood of up to 62.8% of delivering a dose that differs by more than 1% from the motion-averaged dose and a likelihood of up to ~30% for a 2% dose error. For the entire five-beam IMRT plan, statistical averaging over the beams reduces the overall dose error between the delivered dose and the motion-averaged dose. For both patients there was a likelihood of up to 7.0% and 33.9% that the dose error was greater than 1%, respectively. For one of the patients, there was a 12.6% likelihood of a 2% dose error. Daily intrafraction variation of the delivered dose of more than 10% is non-negligible and can potentially lead to biological effects. We observed [for sin(x), sin4(x), and sin6(x)] that below 10–15 MU leads to large daily variations of the order of 15–35%. Therefore, for small MU segments, non-negligible biological effects can be incurred. We conclude that for most clinical cases the effects may be small because of the use of many beams, it is desirable to avoid low-MU segments when treating moving targets. In addition, dose averaging may not work well for hypo-fractionation, where fewer fractions are used. For hypo-fractionation, PDF modeling of the tumor motion in IMRT optimization may not be adequate.
Keywords: organ motion, IGRT, motion average-dose, small MU segments, hypo-fractionation
I. INTRODUCTION
Intensity-modulated radiotherapy (IMRT) allows one to achieve a better dose conformality to the PTV, compared to 3D conformal photon therapy, especially for irregularly shaped concave target volumes. Several investigators have addressed the concern that there might be dosimetric effects when treating moving targets with IMRT, e.g., for lung or liver cancer. This is because of the time dependence of the fluence distribution due to moving leaves of the MLC.
There are two types of intrafractional organ motion effects. One is due to the nonuniform dose distribution delivered to a moving tumor region and is usually called dose-blurring (or smearing) effect, where the dose delivered to a point in the patient is smeared or reduced by the motion of this point in the radiation beam. The second motion effect is usually termed interplay effect and is unique to the dynamic delivery of IMRT, where the relative motion between the leaves and the treatment region leads to a dosimetric effect.
In previous studies,1-5 the effect of intrafraction motion on IMRT dose delivery was studied for step-and-shoot and sliding window delivery techniques. Yu et al.1 demonstrated that when IMRT beams are delivered with dynamic collimation, the problem of intrafraction motion causes large errors in the locally delivered photon dose per fraction, due to motion in the penumbra region of the beam. The magnitude of the photon dose variations was shown to be strongly dependent on the speed of the beam aperture relative to the speed of the target motion and on the width of the scanning beam relative to the amplitude of target motion. Bortfeld et al.2 pointed out that these large differences in the dose between the moving and static phantom cases are expected since, due to motion, the dose point spends most of the time at the extremities of the movement (inhale and exhale points), which correspond to the penumbra region of the beam. They suggested that the reference dose for the case of intrafraction motion should be the average dose obtained over the path of the motion. Smaller differences would then be expected if the average dose were used instead of the static dose.
Bortfeld et al.2 studied the effect of dose-blurring in IMRT using a statistical analysis method, where the delivery time was considered to be significantly larger than the breathing period. In this case a probability density function (PDF) was generated from the organ motion, which is inversely proportional to the velocity at each point of the motion. They showed that the main effect of organ motion in IMRT is the averaging of the dose distribution without motion over the path of the motion and that interplay effects can thus be neglected when the dose is delivered over multiple fractions.
Jiang et al.3 studied the dose-blurring effect for clinical IMRT fields, which took approximately 30–60 s to deliver, with a moving platform using two dose rates (300 and 500 MU min−1) and with motion period of 4 s. They found that lower dose rates can reduce the motion-induced dose variation and therefore might be preferable for lung IMRT.
Chui et al.4 assessed the effects of intrafraction organ motion on the delivery of IMRT for three breast patients and four lung patients. For breast treatment, the effect of organ motion primarily broadened the penumbra at the field edge, while for the lung treatment the effect broadened the penumbra and degraded the coverage of the planning target volume. However, the coverage of the clinical target volume was not much affected. In this study, motion was assumed as sinusoidal with period of 4–8 s and amplitude of 3.5 to 10 mm.
Schaefer et al.5 studied intrafractional breathing movement effects in the step-and-shoot IMRT delivery. Their results indicated that interplay effects between collimator leaf movement and target movement are of secondary importance and may not influence clinical IMRT plans. These plans delivered over various minutes to a moving phantom, where comparisons were made between doses in the static and the moving case.
In Evans et al.6 it is shown that although averaging over 30 fractions does result in a narrow Gaussian distribution of errors as indicated in (Refs. 2 and 3), the fact that one or a few samples of the breathing patient’s motion distribution are used for treatment planning (in contrast to many treatment fractions that are delivered) may result in a much larger error with a systematic component. This systematic error can be particularly large if the CT scan used for radiotherapy treatment planning is that of breath-hold. The effects of using one or more samples of the movement distribution to plan the treatment were considered, and they showed that the systematic errors were reduced. This was consistent with Stroom et al.7 and van Herk et al.,8 where systematic errors were shown to have more dosimetric impact than random treatment errors. In addition to this, averaging over several planning CT scans led to the significant reduction of the systematic error component.
In the studies discussed here,2-5 the authors concluded that interplay between organ motion and leaf motion is not dosimetrically significant for clinical conditions (over a 30-fraction treatment). However, they did not consider the case of treatment beams made up of many few-monitor-unit (MU) segments, where the segment delivery time (1–2 s) is of the order of the breathing period (3–5 s). Highly conformal dose distributions in IMRT are achieved with the use of many of these low MU segments. Depending on the size, shape, and location of the target, each of these segments delivers only a small number of MU, ranging from 3–5 MU up to 20–30 MU, per treatment fraction.
In this study we assess if breathing compromises the radiotherapy treatment with IMRT segments of low number of MUs, where the delivery time of the segments will be of the order of the breathing period (so a few seconds). Breathing motion was modeled as sin(x), sin4(x), and sin6(x), based on functions used in the literature to represent organ motion.9-11 There are three main questions we wish to answer for deliveries with few MUs:
How does the delivered dose vary with the number of MU per segment, over the course of a treatment (e.g., from patient-to-patient)?
Is this delivered dose identical to the average dose calculated without motion over the path of the motion?
What is the magnitude and biological impact of the daily intrafraction variation of the delivered dose as a function of MU per segment?
II. METHODS AND MATERIALS
A. Experimental assessment of motion effects
The organ motion was studied along two orthogonal directions, representing the left-right and cranial-caudal directions of organ-movement for a patient setup in the supine position. In the case of an IMRT treatment, the multi-leaf collimator (MLC) is usually set up such that the MLC leaves move either along the left-right or the anterior-posterior direction of the patient. In Fig. 1, we represent the possible positions of a point of the moving organ relative to the MLC leaves.
Fig. 1.
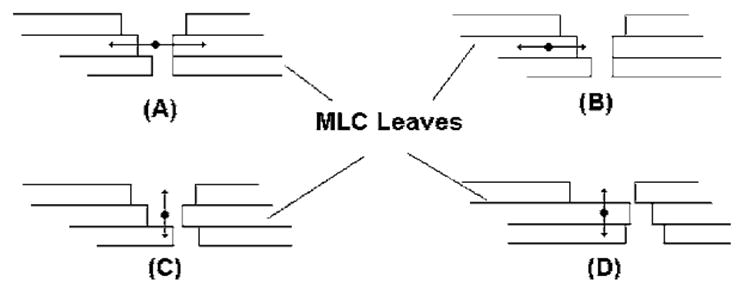
Examples of interplay effects between IMRT delivery and tumor motion. Organ motion may occur parallel to the leaf motion such as represented in (a) and (b), and motion may occur perpendicular to the leaf motion such as represented in (c) and (d).
An in-house made motor driven platform was used,3 which allows sinusoidally (sin) or sin2n (equivalent to the cos2n characterization of the breathing motion9) movement with a user-specified period chosen to be between 4 and 5 s, which is within the breathing range of 3–5 s observed by Ozhasoglu and Murphy10 and Seppenwoolde et al.11 The motion platform is able to perform one-dimensional sin/sin2n movement. Tumor motion was modeled along the cranial-caudal direction.
An exradin (Standard Imaging Ltd., Middleton, USA) ionization chamber and Kodak X-Omat films were used to measure the dose in the moving phantom. The film alignment for the measurements was performed using the light-field of the linac, where an uncertainty of 2 mm in the positioning of the films and ionization chamber is expected. The chamber and films were placed in solid water phantom on top of the moving platform. A 5 cm buildup of solid water was set above the measurement point (for the chamber) or plane (for the film). The linac gantry was placed at 0° on a Varian 2100C (Varian Medical Systems, Inc., Palo Alto, CA) with 120 leaves. The source-to-surface (SSD) distance was 95 cm, and the source-to-axis (SAD) was 100 cm to represent an isocentric treatment setup with 5 cm buildup material.
The measurements were performed for motion amplitude of 2 and 4 cm in 4 × 4, 6 × 6, and 10 × 10 cm2 open fields and delivery dose rate of 500 MU min−1, which is comparable to a single fraction IMRT treatment with intrafraction motion. The numbers of MU delivered by the open fields were 8, 17, 33, 67, 100, 200, and 400 MU, corresponding approximately to delivery times of 1, 2, 4, 8, 12, 24, and 48 s. To evaluate the dose variation due to the different segment delivery times, the measurements were repeated for ten different initial phases (φi=2iπ/10, i=1, … ,10). Each initial phase was visually determined based on the position of a marker on the driven gear of the motor, through a video monitoring system.
For patient treatment, the phase of the tumor motion at the beginning of each field segment delivery is unknown. Therefore, the dose from several segments of a treatment field, for a single fraction, is the summation of the dose from each segment at a random initial phase. The dose to the measurement point from all the segments that make up the treatment field can be calculated using random sampling of the measured initial phase dose values:
| (1) |
where ξ(i) is a random number between 1 and 10 (for the ten possible initial phases) that is obtained for every segment such that ζ(i)∊[1,10], ∀i∊[1,Nsegements], Nsegments is the number of segments in the beam, and dζ(i) is the dose delivered to the measurement point for random initial phase of ζ(i). Similarly, the dose to the measurement point after 30 fractions of treatment, for the treatment beam, can also be calculated with random sampling of the initial phase:
| (2) |
where is the dose delivered to the measurement point for random initial phase of ζ(i), for the treatment fraction k.
B. Simulation of motion effects
To study the effect of organ motion, a MATLAB simulation code was written to model the IMRT delivery, for segments of varying delivery times relative to the breathing period. The motion was simulated in the isocenter plane, by moving a one-dimensional grid perpendicular to the beam direction. Grid points were spaced evenly at 1 mm distance apart. The input for the simulations was the open field measured profiles for the fields 4 × 4, 6 × 6, and 10 × 10 cm2 and the motion amplitude of 2 or 4 cm. The simulation would then mimic the motion of a point in a uniform field, while integrating the dose delivered to this point.
This simulation allowed the study of the effect of organ motion on the delivered dose for various parameters such as
random starting phase,
relative delivery time to breathing time (relative total MU delivered),
number of treatment fractions,
field size dependence, and
motion amplitude dependence.
The simulation is based on Eqs. (1) and (2), where a total of 105 runs were performed in order to produce the probability distributions of the delivered dose from the individual field after 1 and 30 fractions.
C. Theoretical assessment of motion effects in statistical models
In Ref. 2 a statistical model was developed for the motion of one volume element (voxel) in a radiation beam, which is independent of the initial direction of the motion. A probability density function (PDF) of the position of the particular voxel was defined as f p(x)dV, which is the probability to find the voxel in volume dV at position x in 3D space. The two idealized PDF distributions presented in the literature are the sine distribution of Bortfeld et al.2 [Eq. (3)] and the even power distribution of Lujan et al.10 defined in Evans et al.6 [Eq. (4)]:
| (3) |
| (4) |
In Eq. (3), the distribution has a zero average value and variance of A/2, with A being the amplitude of the movement that occurs between −A and A. Equation (4) describes a distribution with an average value of A(2n−1)!!/(2nn!) and variance of A(4n−1)!!/(22n(2n)!)−[(2n−1)!!/2nn!]2, with A the peak-to-peak amplitude of the motion which occurs between 0 and +A.
The probability density function for the dose deviation from the expected value has the same functional form as the PDF defined in Eqs. (3) and (4) and is written as f p(ΔD), where ΔD is the dose difference relative to the average and A represents the dose amplitude or maximum dose difference relative to the average dose observed during the motion.
D. Clinical IMRT plans
In order to study the clinical impact of organ motion on IMRT fields, we assessed (i) the number of MU required per IMRT beam segment (MUseg) and (ii) the average leaf-pair opening distance (ALPO) per IMRT segment.12 Actual IMRT plans for cancer patients based on the CORVUS planning system were analyzed in terms of MUseg and ALPO for a large number of patient plans (planed for the step-and-shoot IMRT delivery). In Fig. 2 we present the distribution of MU-seg and ALPO per beam segment.
Fig. 2.
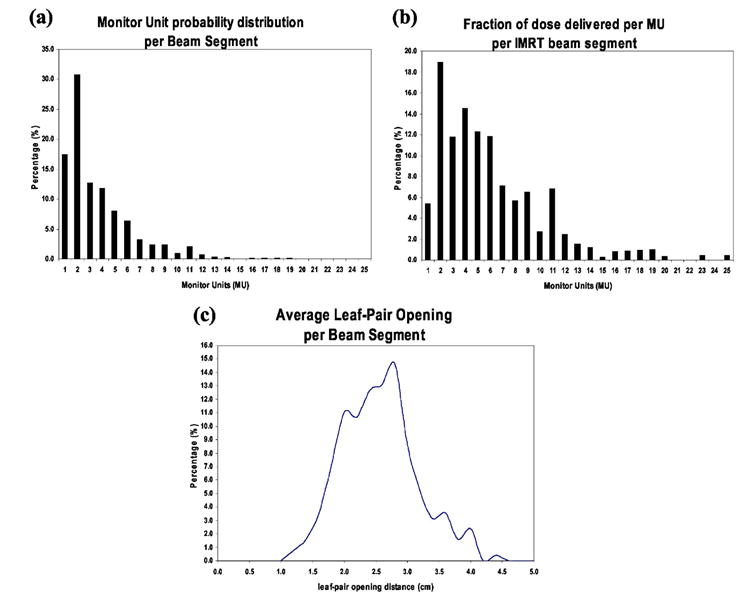
(a) Probability distribution of the number of MU delivered per IMRT beam segment for step-and-shoot MLC delivery based on, approximately, 3000 IMRT beams (planned using CORVUS), (b) fraction dose delivered per beam segment in units of cGy, where 100 MU is 1 Gy, approximately, and (c) probability distribution of the average leaf-pair opening distance (in cm) per beam segment.12
From Fig. 2(a) it becomes clear that the majority (more than 80%) of IMRT beam segments deliver 5 MU or less, therefore the delivery time is of the order of 1 s or less for dose rates of 300 or 500 MU/min. These small delivery times are comparable with the breathing period of 3–5 s. In Fig. 2(b), the total delivered dose in cGy per MU per IMRT beam segment obtained from CORVUS is also presented. The results presented in this figure indicate that for an IMRT treatment, the majority of the dose delivered is based on low MU segments.
In addition, Fig. 2(c) shows that the average leaf-pair opening is of the order 2–3 cm, which is also comparable to motion amplitudes of the order 1 cm, if organ motion is in the same direction as the MLC leaf movement. Most of the organ motion is usually in the cranial-caudal direction while the leaf motion is in the left-right direction.11 In these situations where we have small ALPO, distances in the direction perpendicular to the organ motion (which has amplitude of 2 cm10,11 in the cranial-caudal direction) may lead to the tumor volume being irradiated by the fluence-intensity produced by adjacent MLC leaves. In addition to this, since leaf pairs have small leaf gaps (of order of 2–3 cm), most of the underdosage from motion is a consequence of motion into or from the penumbra region.
There is some deviation, ΔD, of the delivered dose relative to the average dose given over the path of the motion. This deviation can be represented by Eqs. (3) and (4), respectively, for the sine and even-power motion distributions. These PDFs represent the case that if the same treatment were given to the same patient several times, the dose in each voxel would be somewhat different each time. However, for an infinite number of times the 1- and 30-fraction PDFs represent the probability that the patient will receive a dose D that deviates from the average dose by ΔD. In the case of 30 fraction, most of the patients receive a dose that is very close to the average 〈D〉, which corresponds to ΔD=0.2 However, due to the nonzero dose variance, there is nonzero interpatient variation of the delivered dose over the course of the 30-fraction treatment. Since radiation treatments are made up of many beams, with many segments, the nonzero variance, σ2, will reduce quadraticaly.
III. RESULTS
A. Single beam delivering a small number of monitor units
1. Motion effect over 30 fractions for a single low-MU segment
In Figs. 3(a) and 3(b) we present the results for the case of the dose profile obtained over 30 fractions using Eq. (2), with (MOTION) and without (STATIC) motion, for 10 and 20 MU segment (approximately 1 and 2.5 s delivery times). The results presented were measured in the water phantom with films and ionization chamber. The curve MOTION represents the average dose that will be delivered in a 30-fraction treatment by a beam to a moving object with a sinusoidal motion of amplitude A from −A to +A. The curves MAX and MIN represent the maximum and minimum dose observed over 105 samples of 30-fraction treatments where 30 random initial phases were selected for each treatment. The curves MAX Diff and MIN Diff represent, respectively, the difference between MAX and MIN and the average value indicated by the MOTION curve.
Fig. 3.
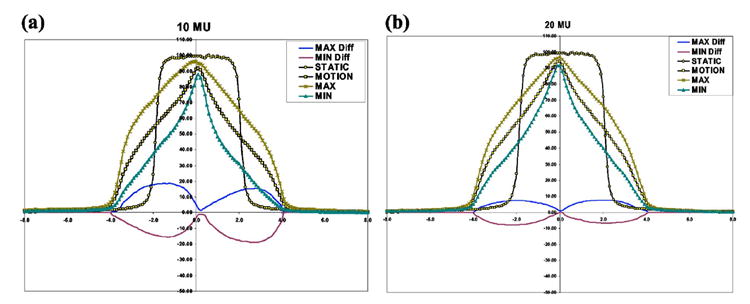
Experimentally determined dose profiles, where the curve MOTION represents average dose delivered in a 30-fraction treatment to a moving object with a sinusoidal motion of amplitude A from −A to +A, while STATIC is the case that the object being irradiated is static. The curves MAX and MIN represent the maximum and minimum dose observed over 105 samples of 30-fraction treatments. The curves MAX Diff and MIN Diff represent, respectively, the difference between MAX and MIN and the average value indicated by the MOTION curve.
In comparing the STATIC and MOTION results, it becomes apparent that there are large differences in the delivered dose along the profile due to motion, where differences can be as large as 100% in the penumbra region of the beam. These large differences are consistent with results published in the literature1,4,5 for dynamic and static MLC deliveries. The large differences occur because the dose points spend most of the time near the edges of the radiation beam, due to the motion as indicated by the sine-motion PDF given in Eq. (3).
In comparing the MOTION results with the MAX and MIN values, differences of up to 20% and 10% are observed for points in the penumbra region and respectively for the 10 and 20 MU cases, as indicated by the MAX Diff and MIN DIFF curves. Therefore, there is a large variation of the dose around the average dose for a 30-fraction treatment. As a consequence, for a particular segment dose averaging will not occur over 30 fractions to within 1% as indicated in the literature,2 for beams with segments of few MUs. In the present case, the width or variance of the dose around the average dose is approximately 25% and 15% respectively for the 10 and 20 MU cases, where the beam was considered to have a single intensity segment. A dose error can be introduced in the radiotherapy plan if the plan dose is normalized to the calculated average dose over the path of the motion. This normalization is usually performed when modeling tumor motion with a PDF function.
In Figs. 4(a)–4(d) we present the simulation results for a dose point in the penumbra region of the beam, where the largest dose differences were observed in Fig. 3. In addition, the study is now performed for three types of motion: sin(x), sin4(x), and sin6(x) [sinusoidal, n=2, and n=3 in Eq. (4)] and for a breathing period of 4 s. A total of 10 or 100 segments of identical MU value were considered per beam. The simulation study was performed for different numbers of incident MU to the dose point that was moving, with the dose calculated over 30 fractions. In the Y axis is represented the percentage dose difference relative to the average dose obtained over the path of the motion, and this indicates the error in the motion dose averaging over 30 fractions, for sin(x), sin4(x), and sin6(x) motion. The error bars represent one (1) standard deviation of the dose difference around the average value and indicate the 68% confidence level. Over 30 fractions, delivering 10 segments of 10 MU or less to a moving object can lead to dose differences relative to the average of up to 2.5%, 3.7%, and 4.4% respectively, for the sin(x), sin4(x), and sin6(x) motion. In some extreme cases (for 5–10% of the cases), the dose delivered during motion can deviate from the average by 6%, 8%, and 10–12% respectively for sin(x), sin4(x), and sin6(x) motion. For the situation of delivering 100 segments of 10 MU or less, over 30 fractions, differences are now significantly smaller of the order of 1% as indicated in the literature,2 for the three types of motion studied, the sin(x), sin4(x), and sin6(x).
Fig. 4.
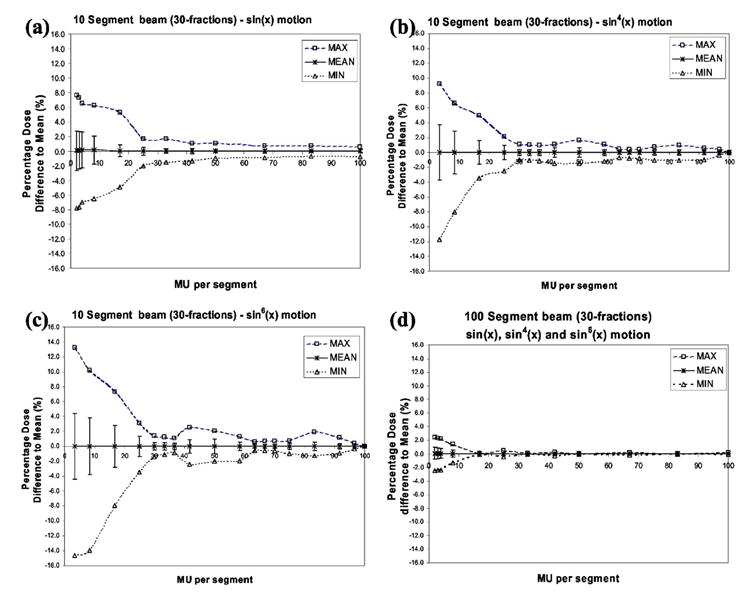
Simulated data of a dose point in the penumbra region of the beam for three types of motion: (a) sin(x) (b) sin4(x), and (c) sin6(x) and for a breathing period of 4 s. The point is irradiated with a beam with either 10 or 100 segments of identical MU value. The error bars represent one (1) standard deviation around the mean, corresponding to the 68% confidence level.
2. Motion effect over 30 fractions for a beam with many segments of low MU values
In the simulation study discussed above we assessed the error in the delivered dose relative to the average dose for both the 10 and 100 segments per beam cases. However, 10 segments of 5 MU do not deliver the same dose over 30 fractions as 10 segments of 10 MU. In the latter you will deliver 1500 MU (approximately 15 Gy) over 30 fractions, the former will deliver 3000 MU (approximately 30 Gy), while a clinical beam usually delivers around 6000 MU for a 30-fraction treatment or 7000 MU for a 35-fraction treatment (so 2 Gy per fraction).
In order to assess the error of the delivered dose relative to the average for a clinical beam, we use the fraction of dose delivered per beam segment provided in Fig. 2(b) as weighting in order to calculate the overall standard deviation defined as follows:
| (5) |
where σMUi is the standard deviation per MU from Figs. 4(a)–4(d) for the 10 and 100 segment cases. The FDi is the fraction of dose delivered per segment given in Fig. 2(b) and σclinical is the standard deviation of a clinical beam as was calculated for MU values ranging from 1 to 30 MU.
The standard deviation for beams with 10 or 100 segments are
| (6a) |
| (6b) |
| (6c) |
| (6d) |
Therefore, an IMRT beam made up of 10 segments has approximately a 68% chance that the delivered dose will be within 2.4%, 3.3% and 4.3% of the average dose calculated over the motion path, respectively, for the sin(x), sin4(x), and sin6(x) type motion. As a consequence, normalizing to the average dose obtained over the path of the motion can lead to a dose error depending on the type of motion, where normalization is usually performed when modeling tumor motion with a PDF function.
Again there is 5–10% chance that the delivered dose can deviate from the average by as much 6%, 8%, and 10–12%, respectively, for the sin(x), sin4(x), and sin6(x) motion. Thus, normalizing to average over motion path in these cases can lead to significant systematic error in the delivered dose relative to calculated dose.
In the case of a beam with 100 segments, the delivered dose will be within 0.9% of the average with 68% confidence, for all the three types of motion. This reduction in the error is a consequence of the statistical error becoming smaller with increasing number of segments.
B. Single beam delivery of clinical IMRT beams
An IMRT beam is made up of both low- and high-MU segments. For this study we considered two patients, A and B, where the individual IMRT beams were studied previously on a moving phantom with sinusoidal motion.3 The patients A and B studied here were randomly selected from a pool of patients treated with IMRT at our center, in order to evaluate the clinical impact of low-MU segments in IMRT planning, where motion is accounted for by using a PDF. We analyzed intra fraction motion on a beam-by-beam basis in order to assess if IMRT beams will deliver doses significantly different (by more that 1%) from the average dose, obtained along the path of motion.
In Figs. 5 and 6, we present the probability distributions of the delivered dose over 30 fractions, D30, calculated using Eq. (2) for patients A and B, where SW, SS10, and SS20 are respectively the sliding-window, step-and-shoot 10 segments, and step-and-shoot 20 segments. The 500 and 300 values represent the 500 and 300 MU/min dose rates. In Table I we present the probability that each beam, given in figures 5 and 6, delivers a dose that is different by more than 1% of the motion average dose. From Figs. 5 and 6 and Table I we see that the majority of the beams of patient A deliver a dose that is within 1% of average value. In the case of beam 2 there are three delivery techniques with higher than 5% probability that the delivered dose differs from the motion average dose by more than 1%, they are SW500, SS20-500, and SS20-300. This is a consequence of SS beams having significantly more low-MU segments than SW beams. In addition it is also possible to see that beams 2, 4, and 5 have a more than 10% chance to deliver dose significantly different from motion average dose, by more than 1%. In the case of patient B, beams 1, 2, 4, and 5, for the delivery techniques SS10-500, SS10-300, SS20-500 and SS20-300, respectively, have more than 10% likelihood that the delivered dose is different from the motion average dose by more 1%. We see that patient B IMRT beams are nearly all composed of many few-MU segments. The worst delivery method for patient B is SS10-500, where there is a 62.8% chance that the delivered dose differs from the motion average dose by more than 1%.
Fig. 5.
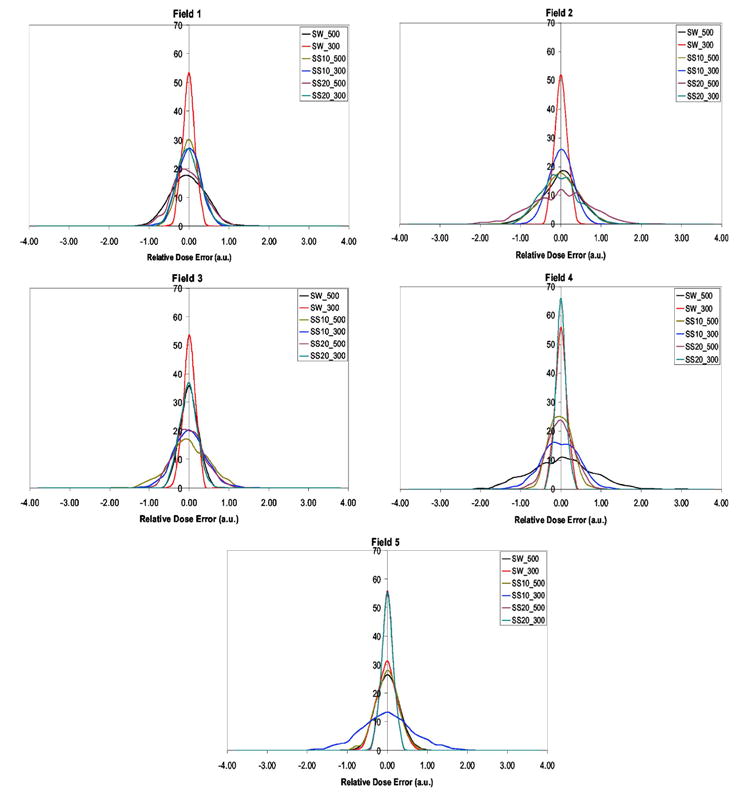
Patient A, where fields 1–5 represent IMRT beam plans from CORVUS planning system.
Fig. 6.
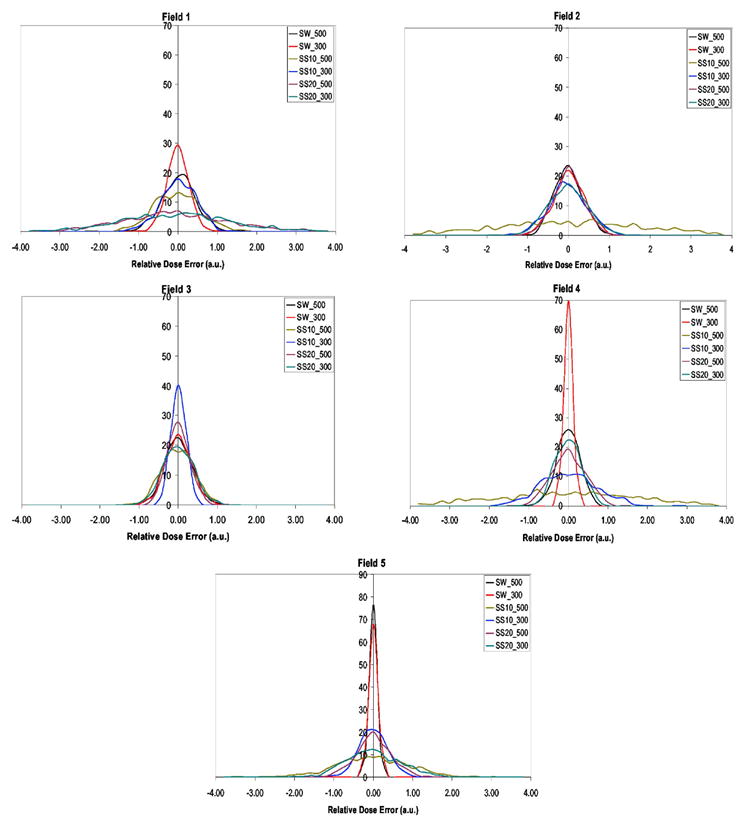
Patient B, where fields 1–5 represent IMRT beam plans from CORVUS planning system.
Table I.
The probability that each clinical IMRT beam for patients A and B delivers a dose that is different by more than 1% than the motion-averaged dose. In bold are represented larger than 5% probability values that dose error is more than 1%
| Patient A | Patient B | |||||||||
|---|---|---|---|---|---|---|---|---|---|---|
| 1 | 2 | 3 | 4 | 5 | 1 | 2 | 3 | 4 | 5 | |
| SW500 | 3.2 | 6.2 | 0.0 | 25.6 | 0.2 | 3.7 | 0.9 | 1.4 | 0.3 | 0.0 |
| SW300 | 0.0 | 0.0 | 0.0 | 0.0 | 0.0 | 0.3 | 1.5 | 1.4 | 0.0 | 0.0 |
| SS10-500 | 0.0 | 4.6 | 7.9 | 0.1 | 0.0 | 12.2 | 62.8 | 2.9 | 60.5 | 31.2 |
| SS10-300 | 0.1 | 0.2 | 3.0 | 4.8 | 16.3 | 4.1 | 6.3 | 0.0 | 19.5 | 1.6 |
| SS20-500 | 1.9 | 22.2 | 1.7 | 0.7 | 0.0 | 48.9 | 1.7 | 0.2 | 2.8 | 5.0 |
| SS20-300 | 0.1 | 5.2 | 0.0 | 0.0 | 0.0 | 52.0 | 5.7 | 2.5 | 0.2 | 19.6 |
In the case of relative dose errors exceeding 2% relative to the motion average dose, this was only found in patient B for three out of five beams. Although two patients is not enough to conclude on the error that is committed when normalizing the planned dose to the average dose (using a motion PDF), we demonstrated here that clinical IMRT beams with low-MU segments can lead to large errors in the dose normalization with motion PDF. However, this is treatment planning specific, where the present study was performed with the CORVUS planning system. Other treatment planning algorithms might produce fewer low-MU segments.
C. Multiple beam delivery of clinical IMRT beams
An IMRT plan is usually made up of several beams, where there is a mix of both low- and high-MU segments. Therefore standard deviations will be reduced by the square root of the number of beams, due to statistical averaging. In Table II, we present the probability that the overall IMRT delivered dose for the five beam plan deviates from the motion average dose by more than 1%. Most of the IMRT delivery techniques studied have a lower than 10% chance that the total delivered IMRT dose to the moving target will deviate from the motion average dose by more than 1%. However, in the case of patient B and for the delivery techniques SS10-500, SS20-500, and SS20-300, there is a larger than 10% chance of the total IMRT delivered dose being different from the motion average dose. Especially in the case of the delivery technique SS10-500 there is a 1-in-3 chance that the total IMRT delivered dose is different from the motion average by more than 1%, and there is 12.6% chance that the delivered dose is more than 2% different from PDF dose.
Table II.
The probability that total IMRT dose, delivered by a combination of 5 IMRT beams obtained for patients A and B, delivers a dose that is different by more than 1% than the motion-averaged dose. For patient B is presented in parentheses the probability of a larger than 2% dose error, while for the remaining delivery techniques the probability of more than 2% dose error is negligible.
| Patient A | Patient B | |
|---|---|---|
| SW500 | 7.0 | 1.3 |
| SW300 | 0.0 | 0.6 |
| SS10-500 | 2.5 | 33.9 (12.6) |
| SS10-300 | 4.9 | 6.3 |
| SS20-500 | 5.3 | 11.7 (3.3) |
| SS20-300 | 1.1 | 16.0 (3.4) |
As an example we present in Fig. 7 for both patients A and B an example of an IMRT delivery to a moving tumor. The dose delivered relative to the motion average dose is represented for each of the five beams (numbered form 1 to 5). In addition IMRT field number 0 represents the total IMRT dose delivered by all five beams. It is possible to see for patient A that fluctuations in the delivered dose per beam are significantly reduced due statistical averaging over the five IMRT beams. Therefore, for patient A the total delivered dose is within 1% of the motion average dose, while in the case of patient B statistical averaging over all five beams has reduced but not removed the effect of intra fraction motion on the delivered dose. The total IMRT dose delivered, to the moving target, from five beams is different by more than 1% from the average motion dose. This indicates that modeling the motion using a PDF for patient B can lead to an error of more than 1% in the final delivered dose to the moving tumor region due to low-MU segments.
Fig. 7.
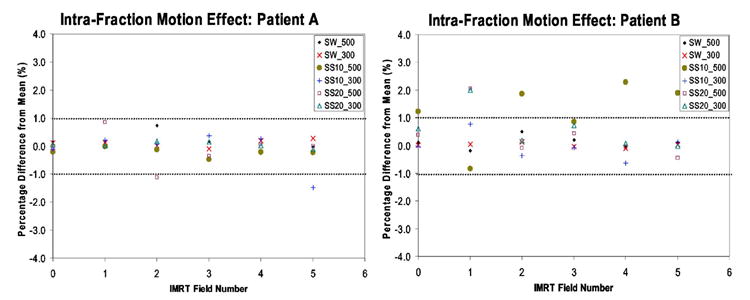
An example of an IMRT delivery to a moving tumor for patients A and B. The dose delivered relative to the motion average dose is represented for each of the five beams (numbered from 1 to 5) and IMRT field number 0 represents the total IMRT dose delivered by all five beams.
D. Intra fraction dose variation, relative average dose, due to organ-motion, for low-MU segments
In the studies discussed above we evaluated if the average dose delivered over the course of a treatment (say 30 fractions) was approximately within 1% of the motion-averaged dose, for low-MU segments. Here we assess how the dose, delivered to the moving PTV, varies from fraction to fraction over the course of the treatment because daily variations may lead to non-negligible biological effects.12,13 Daily variation, relative to the motion-averaged dose, is characterized by the standard deviation of the intra fraction dose variation over a 30-fraction treatment. In Fig. 8, the standard deviation of the intra fraction dose variation due to organ motion is presented for the simulated motions sin(x), sin4(x), and sin6(x) motion and for 30-fraction treatment. The X axis represents the ratio of delivery time to breathing period (DB), where the intrafraction standard deviation for each DB value is weighted by the number of segments needed to deliver that intensity and represented by . The weighting guarantees that at any DB value, the total delivered dose is the same dose, where for lower DB values we have fewer MUs per segment and thus more segments are needed to deliver the same total dose.
Fig. 8.
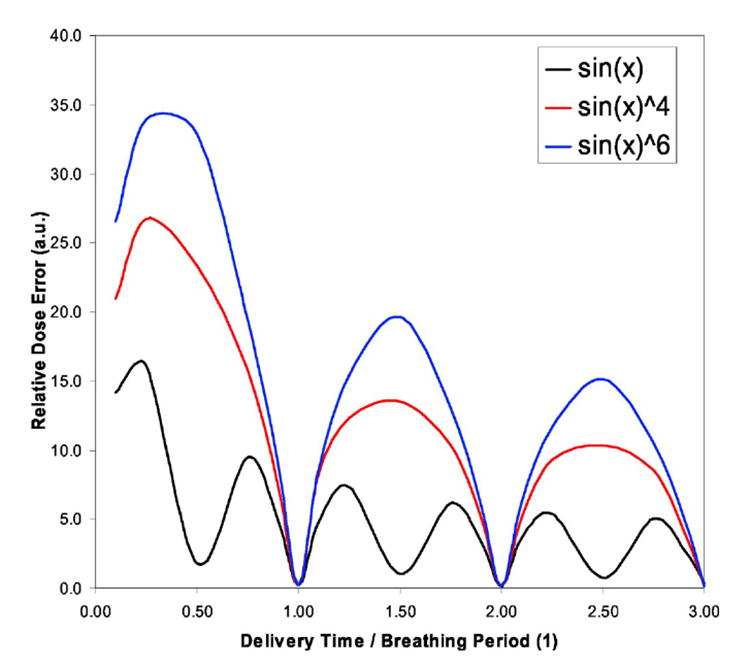
Standard deviation of the intrafraction dose variation due to organ motion presented for the sin(x), sin4(x), and sin6(x) motion, where X axis represent the ratio of delivery time to breathing period (DB). As an example, for breathing period of 4 s and dose rate of 500 MU/min, a DB value of 1 or 0.5 corresponds approximately to 33 or 17 MU intensity per beam segment.
All three curves reach an absolute maximum for DB values below 0.50, while local maxima are reached at DB values of 1.50 and 2.50 for both sin4(x) and sin6(x) motion. In the case of the sin(x) simulated motion, the local maxima occur at DB values of 1.25/1.75 and 2.25/2.75. For the sin motion the absolute maximum occurs approximately at DB of 0.25, while for sin4(x) and sin6(x) the absolute maximum occurs for DB value between 0.25 and 0.40. This maximum is reached because there are two competing processes: (i) the increase in the intrafraction standard deviation of the delivered dose due to motion and (ii) the increase of the number of segments needed to deliver the beam segments with fewer MUs, which reduces the overall dose uncertainty in the delivered dose by the factor , where N is the number of segments required. Another interesting result in Fig. 8 is the fact that the overall dose error, relative to the average dose, of the delivered dose can be 0.0 (zero), when delivery times are integer values of the breathing period. This occurs because the delivered dose will average out over the full breathing cycle as indicated by Bortfeld et al.2
The standard deviation for the simulated sin(x) motion is below 10% for all DB values above 0.40, where 0.40 corresponds to approximately 13 MU delivery for a breathing period of 4 s and 500 MU/min dose rate. Therefore, for any daily treatment of 2 Gy, the delivered dose can differ by more than 10% from the planned dose if segments have equal or less than 13 MUs. This variation in the daily dose is due to the sinusoidal motion of the tumor. As pointed out by Bortfeld and Paganetti,13 daily dose variations above 10% may cause significant alterations in biological effect. In the case of DB below 0.4, the standard deviation now increases until reaching a maximum of 15% for DB values of 0.2. However, the effect may be reduced if multiple beams are used to delivered dose to a moving tumor site with sin(x) type motion.
In the case of the standard deviation for simulated sin4(x) or sin6(x) motion, a much larger daily variation of the dose is observed relative to the motion-averaged dose, where now the 10% threshold occurs a at DB value of 0.90. For a 4 s breathing period and 500 MU/min dose rate, the 0.90 DB value corresponds, approximately, to 30 MU intensity. Therefore, IMRT beams made up of segments with less than 30 MUs will have large daily variations of 10% or more. For DB below 0.90 the standard deviation also increases to values of 25% and 35%, for the sin4(x) and sin6(x) motion, respectively. These very large daily variations could lead to a six- to eightfold increase of the biological effect13 and possibly lack of local tumor control.
IV. DISCUSSION AND CONCLUSION
We evaluated for a single beam of one single segment, the dose delivered to a moving target over 30 fractions. In Fig. 3 we showed that the dose error between delivered dose and motion-averaged dose can vary up to 20% and 10% for segments of 10 and 20 MU, respectively. This dose error occurs because when a radiotherapy plan is normalized to the average dose over the path of motion, it does not accurately account for the fact that the tumor spends most of the time near the edges of the radiation beam. Therefore, modeling the tumor motion in IMRT optimization by a probability density function (PDF) is not sufficient to accurately describe the position of the tumor during radiation treatment; more information is required.
In the case of a single beam made of 10 or 100 identical segments with 10 MU, differences between the delivered dose and the motion-averaged dose, calculated over the path of motion, for sin(x), sin4 (x), and sin6(x) motion, were respectively 2.5%, 3.7%, and 4.4% for the case of 10 segments of 10 MU, as shown in Fig. 4. Therefore, a dose error can be introduced in the radiotherapy treatment plan if the dose plan is normalized to the motion-averaged dose obtained over the path of motion, where normalization is usually performed when modeling tumor motion with a PDF function. For beams made up of 100 segments of 10 MU or less, the differences were significantly smaller, indicating that, for such cases, a less than 1% dose error would be committed if normalizing delivered dose to motion-averaged dose.
For the case of the single beam with varying number of MU per segment, we observed 2.4%, 3.3% and 4.3% differences for sin(x), sin4(x), and sin6(x) motion, respectively, between delivered dose and motion-averaged dose for points in the penumbra region of the beam and over 30 fractions. In approximately 5–10% of the cases, differences between the motion-averaged dose and the delivered 30-fraction dose could reach 6%, 8% and 10–12% for sin(x), sin4(x), and sin6(x) motion, respectively.
For clinical IMRT plans randomly selected from our CORVUS planning system, two patient plans, A and B, were selected, each composed of five IMRT beams. For plan A, we found that there was a less than 25.6% likelihood that the delivered dose would deviate from the motion dose by more than 1%. For plan B, the beams were found to have a less than 62.8% chance of delivering a dose more than 1% different from the motion average dose and approximately 30% likelihood of 2% error in delivered dose relative to motion average dose. The results indicated that the step-and-shoot beams (SS10 and SS20) could deliver a dose, over a 30-fraction treatment, which differed from the motion-averaged dose by more than 1% (in the case of patient B more than 2%).
In the case of the entire five-beam IMRT plan, statistical averaging over the beams reduced the overall dose error between the delivered dose and the motion average dose. For plan A, there is less than 7.0% likelihood that the dose error is greater than 1%, while for plan B there is a less than 33.9% chance that the dose error is more than 1% and 12.6% chance that the dose error exceeds 2%. Thus, using the motion-averaged dose to normalize the treatment plan to account for motion could lead to a systematic dose error of more than 1% in the delivered dose.
The magnitude of the intra fraction variation of the delivered dose as a function of the MU per segment can potentially lead to non-negligible biological effects.13 For both sin(x) and patient breathing motion [sin4(x) and sin6(x)], beam segments below 10–15 MU lead to large daily variations with subsequent change in the biological effectiveness of the treatment. Therefore, for small MU segments, non-negligible biological effects will be incurred with large daily variations of the delivered dose.
In conclusion, breathing can compromise the radiotherapy treatment with IMRT segments of low number of MU, where the delivery times of the segments are of the order of the breathing period (so a few seconds). In addition, few-MU segments may have appreciable interplay effects for an IMRT delivery because the MLC controller determines the time sequence for the starting of the treatment, and it is not entirely independent of the patient breathing cycle. Although for most clinical cases the effects may be small, it is desirable to avoid low-MU segments when treating moving targets.
Our study also has some implications for hypo-fractionation regimes, where fewer fractions are used per treatment but higher doses are delivered per fraction. Normally one would expect that hypo-fractionation regimes cause higher dose errors due to motion. But since more dose is delivered per fraction, there are likely more MUs per segment, which will cause a lower overall dose error based on the results of our study.
Acknowledgments
We would like to acknowledge Steve Jiang and Cynthia Pope for providing the published data of patients A and B, which were studied in our work, and George Chen and Steve Jiang for use of the moving platform, with which some of the measurements were performed. This work was sponsored by NIH Grant No. R01-CA 111590.
References
- 1.Yu C, Jaffray DA, Wong JW. The effects of intra-fraction organ motion on the delivery of dynamic intensity modulation. Phys Med Biol. 1998;43:91–104. doi: 10.1088/0031-9155/43/1/006. [DOI] [PubMed] [Google Scholar]
- 2.Bortfeld T, Jokivarsi K, Goitein M, Kung JH, Jiang S. Effect of intra-fractioon motion on IMRT dose delivery: statistical analysis and simulation. Phys Med Biol. 2002;47:2203–2220. doi: 10.1088/0031-9155/47/13/302. [DOI] [PubMed] [Google Scholar]
- 3.Jiang S, Pope C, Al Jarrah KM, Kung JH, Bortfeld T, Chen TY. An experimental investigation on intra-fractional organ motion effects in lung IMRT treatments. Phys Med Biol. 2003;48:1773–1784. doi: 10.1088/0031-9155/48/12/307. [DOI] [PubMed] [Google Scholar]
- 4.Chui CS, Yorke E, Hong L. The effects of intra-fraction organ motion on the delivery of intensity-modulated field with a multileaf collimator. Med Phys. 2003;30(7):1736–1746. doi: 10.1118/1.1578771. [DOI] [PubMed] [Google Scholar]
- 5.Schaefer M, Münter MW, Thilmann C, Sterzing F, Haering P, Combs SE, Debus J. Influence of intra-fractional breathing movement in step-and-shoot IMRT. Phys Med Biol. 2004;49:N175–N179. doi: 10.1088/0031-9155/49/12/n03. [DOI] [PubMed] [Google Scholar]
- 6.Evans PM, Coolens C, Nioutsikou E. Effects of averaging over motion and the resulting systematic errors in radiation therapy. Phys Med Biol. 2006;51:N1–N7. doi: 10.1088/0031-9155/51/1/N01. [DOI] [PubMed] [Google Scholar]
- 7.Stroom JC, de Boer HCJ, Huizenga H, Visser AG. Inclusion of geometrical uncertainties in radiotherapy treatment planning by means of coverage probability. Int J Radiat Oncol Biol Phys. 1999;43:905–919. doi: 10.1016/s0360-3016(98)00468-4. [DOI] [PubMed] [Google Scholar]
- 8.van Herk M, Remeijer P, Rasch C, Lebesque JV. The probability of correct target dosage: dose-population histograms for deriving treatment margins in radiotherapy. Int J Radiat Oncol Biol Phys. 2000;47:1121–1135. doi: 10.1016/s0360-3016(00)00518-6. [DOI] [PubMed] [Google Scholar]
- 9.Luxan AE, Larsen EW, Balter JM, TenHaken RK. A method for incorporating organ motion due to breathing into 3D dose calculations. Med Phys. 1999;26:715–720. doi: 10.1118/1.598577. [DOI] [PubMed] [Google Scholar]
- 10.Ozhasoglu C, Murphy MJ. Issues in respiratory motion compensation during external-beam radiotherapy. Int J Radiat Oncol Biol Phys. 2002;52:1389–1399. doi: 10.1016/s0360-3016(01)02789-4. [DOI] [PubMed] [Google Scholar]
- 11.Seppenwoolde Y, Shirato H, Kitamura K, Shimizu S, van Herk M, Lebesque JV, Miyasaka K. Precise and real-time measurement of 3D tumor motion in lung due to breathing and heartbeat, measured during radiotherapy. Int J Radiat Oncol Biol Phys. 2002;53:822–834. doi: 10.1016/s0360-3016(02)02803-1. [DOI] [PubMed] [Google Scholar]
- 12.Zygmanski P, Kung JH. Method of identifying dynamic multileaf collimator irradiation that is highly sensitive to a systematic MLC calibration error. Med Phys. 2001;28:2220–2226. doi: 10.1118/1.1408284. [DOI] [PubMed] [Google Scholar]
- 13.Bortfeld T, Paganetti H. The biologic relevance of daily dose variations in adaptive treatment planning. Int J Radiat Oncol Biol Phys. 2006;65:899–906. doi: 10.1016/j.ijrobp.2006.02.036. [DOI] [PubMed] [Google Scholar]


