

Abstract
OBJECTIVE
To prospectively compare measurement precision of calf intramyocellular lipid (IMCL) quantification at 3.0T and 1.5T using 1H magnetic resonance spectroscopy (1H-MRS).
MATERIALS AND METHODS
We examined the soleus and tibialis anterior (TA) muscles of 15 male adults [21–48 years of age, body mass index (BMI)=21.9–38.0 kg/m2]. Each subject underwent 3.0T and 1.5T single-voxel short-echo-time point-resolved 1H-MRS both at baseline and 31-day follow-up. The IMCL-methylene peak (1.3 ppm) was scaled to unsuppressed water peak (4.7 ppm) using the LCModel routine. Full width at half maximum (FWHM) and signal-to-noise ratios (SNR) of unsuppressed water peak were measured using jMRUI software. Measurement precision was tested by comparing interexamination coefficients of variation (CV) between different field strengths using Wilcoxon matched pairs rank test in all subjects. Overweight subjects (BMI>25 kg/m2) were analyzed separately to examine benefits of 3.0T acquisitions in subjects with increased adiposity.
RESULTS
No significant difference between 3.0T and 1.5T was noted in CVs for IMCL of soleus (P=0.5). CVs of TA were significantly higher at 3.0T (P=0.02). SNR was significantly increased at 3.0T for soleus (64%, P<0.001) and TA (62%, P<0.001), however lower than the expected improvement of 100%. FWHM at 3.0T was significantly increased for soleus (19%, P<0.001) and TA (7%, P<0.01). Separate analysis of overweight subjects showed no significant difference between 3.0T and 1.5T CVs for IMCL of soleus (P=0.8) and TA (P=0.4).
CONCLUSION
Using current technology, 1H-MRS for IMCL at 3.0T did not improve measurement precision compared to 1.5T.
Keywords: Proton magnetic resonance spectroscopy, Muscle, Lipids, 3.0-Tesla
INTRODUCTION
Fat deposition in skeletal muscle plays a significant role in the regulation of insulin metabolism. Fat storage in muscle occurs in the form of cytoplasmic fat droplets within myocytes (intramyocellular lipids, IMCL), or in adipocytes between muscle cells and fascicles (extramyocellular lipids, EMCL) [1;2]. IMCL accumulation is strongly associated with insulin resistance [3–6], and is currently a critical endpoint in studies evaluating insulin homeostasis. To this effect, 1H-MRS has become the key non-invasive technique for measuring IMCL in conditions with insulin resistance, such as Type 2 diabetes mellitus [3], obesity [6], and HIV-lipodystrophy syndrome [7].
In vivo 1H-MRS IMCL quantification is performed with a high level of technical success on clinical 1.5T scanners [1;2;8] with measurement variability in the range of 13% (intraday scans) and 14–21% (interexamination scans) [9]. With the widespread availability of 3.0T MR scanners there is growing interest in the performance of high-field muscle 1H-MRS with respect to 1.5T. 1H-MRS performed at 3.0T has theoretical advantages of higher signal-to-noise ratio (SNR) and improved chemical shift dispersion, potentially increasing measurement precision and sensitivity. However, these gains may be partially offset by changes in relaxation times and linewidth broadening due to susceptibility effects at higher magnetic field strengths [10;11].
Prior measurements of relaxation times at 4.0T demonstrated increases in T1 of 70–90% and decreases in T2 of 10–20% when compared to 1.5T [12]. In a study comparing 3.0T and 1.5T, Gold et al. [13] showed that musculoskeletal tissues at 3.0T had significantly higher T1 relaxation times (15–22%), while T2 relaxation times were significantly lower (10–37%). Changes in T2 relaxation times may have an effect on IMCL quantification, as they contribute to linewidth broadening that may decrease measurement precision. Increased susceptibility effects at 3.0T may also represent a potential drawback, limiting the advantages of better peak separation due to broadening of the EMCL linewidth. In addition, spectral distortions and SNR loss due to more severe eddy current artifacts, and increased chemical shift artifact may represent further factors decreasing measurement precision a 3.0T [14].
A recent report on IMCL quantification using long-echo 1H-MRS examined separate subject groups at 3.0T and 1.5T, measuring variability in a same-day session without repositioning [15]. To our knowledge, no prior studies have compared IMCL measurement variability in the same subject group performing 1H-MRS both at 3.0T and 1.5T on baseline and follow-up visits. The purpose of our study was to prospectively examine, in a single cohort, temporal changes in IMCL measured by 3.0T and 1.5T 1H-MRS and determine if variability indices were significantly different when comparing both field strengths.
MATERIALS AND METHODS
The recruitment procedures and study protocol were HIPAA compliant and performed with the approval of our institutional review board. Written informed consent was obtained from all subjects.
Subject Selection
Between April 2005 and March 2006, male subjects were recruited by means of advertisement posted at our institution’s clinical research website. Subjects underwent a screening interview for body mass index (BMI) determination and were required to complete a 5-item questionnaire developed specifically for the study, which included questions on current medications, past medical and surgical history, nutritional pattern, and physical activity level. Individuals with history of endocrine/metabolic disease (including but not limited to type 2 diabetes, Cushing’s disease, hypo/hyperthyroidism), undergoing treatment with medications, use of hormones, steroids, dietary supplements, undergoing exercise training programs, and elite athletes (running more than 50 miles/week) were excluded from the study.
1H-MR Spectroscopy Technique
Eligible subjects were scanned using a 3.0T (Siemens Trio) and 1.5T (Siemens Sonata; Siemens Medical Systems, Erlangen, Germany) magnetic resonance imaging systems. After 8-hour overnight fasting, each subject underwent 1H-MRS at both magnetic fields on the same morning between 0700 and 0900 AM. This procedure was done at baseline and repeated on a 31-day follow-up visit. Therefore, all subjects had paired 3.0T and 1.5T scans on the same day. All subjects were required not to change usual physical activity and dietary habits for the duration of the study, avoiding physical effort (moderate or vigorous exercise) or high-fat diet 72 hours prior to scanning. Subjects were interviewed immediately prior to scanning in order to assess compliance to these instructions.
Subjects were positioned feet first in the magnet bore and the right calf was placed in commercially available extremity coils. At 3.0T, we used a 12-element transmit/receive quadrature extremity coil, with 18 cm birdcage diameter (USA Instruments, Aurora, Ohio). At 1.5T, we employed a circularly polarized transmit/receive extremity coil, with 20.5 cm birdcage diameter (Siemens Medical Systems, Erlangen, Germany). At 3.0T and 1.5T, tri-plane gradient echo localizer pulse sequences with echo time (TE) of 5 ms and repetition time (TR) of 15 ms were obtained. Axial T1-weighted images (TR, 400 ms; TE, 11 ms; slice thickness, 4 mm; inter-slice gap, 1 mm; matrix, 5122; NEX, 1; FOV 22 cm) of proximal two-thirds of calf were prescribed using the proximal tip of fibula as osseous landmark. The first slice was always placed at the level of proximal fibular tip and the prescription stack was propagated distally with the above-mentioned thickness and spacing parameters. At 3.0T and 1.5T, single-voxel 1H-MRS data was acquired using point-resolved spatially localized spectroscopy (PRESS) pulse sequence with TE of 30 ms, TR of 3,000 ms, 64 acquisitions, 1024 data points, and receiver bandwidth of 1000 Hz. The PRESS acquisition time lasted 3 minutes and 24 seconds both at 1.5T and 3.0T. In all cases, a voxel measuring 15 × 15 × 15 mm (3.4 mL) was placed on the axial T1-weighted slice with largest muscle cross-sectional area, avoiding visible interstitial tissue, fat or vessels. Oblique voxels and spatial presaturation bands were not employed. Due to time constraints, we relied on automated procedures for optimization of gradient shimming, water suppression, transmit and receive gain. We did not perform manual shimming or manipulation of high-order shimming. Water presaturation was used for metabolite acquisition, and unsuppressed water spectra of same voxel were obtained for each scan (Figure 1). At both field strengths, unsuppressed water signal acquisition was obtained with same parameters as the metabolite acquisition. Neither metabolite levels nor unsuppressed water levels were corrected for T1 and T2 relaxation times. To ensure consistent positioning in follow-up examination, the axial slice used for voxel placement (counted from proximal fibular tip) was annotated in a log book and screen-captured with voxel overlays and x-y coordinates.
Figure 1.
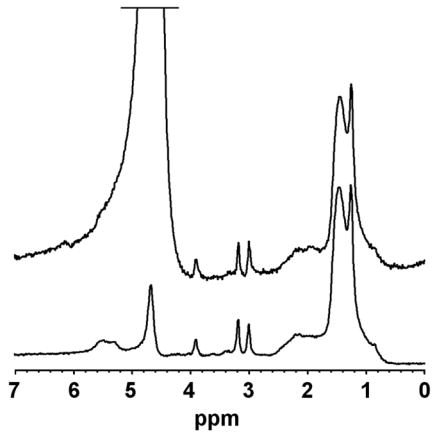
Spectra of soleus muscle recorded at 3.0T collected from same voxel. The top acquisition shows an unsuppressed water spectrum (truncated water signal at 4.7 ppm). The lower acquisition represents the water-suppressed metabolite spectrum (residual water signal at 4.7 ppm).
1H-MR Spectroscopy Data Analysis
Fitting of all 1H-MRS data was performed using LCModel (version 6.1-4A) [16]. Data were transferred from the scanners to a Linux workstation and metabolite quantification was performed using eddy current correction and water scaling. The fitting algorithm was customized for muscle analysis providing estimates for lipid peaks (0.9, 1.1, 1.3, 1.5, 2.1 and 2.3 ppm), creatine (2.8 and ~3.0 ppm), trimethylamines (3.2 ppm), and putative taurine signal (~3.5 ppm). Data for IMCL (1.3 ppm) and EMCL (1.5 ppm) methylene protons were used for statistical analyses. LCModel IMCL and EMCL estimates were automatically scaled to unsuppressed water peak (4.7 ppm) and expressed in institutional units (IU). The jMRUI software package [17] was used for measurement of full width at half maximum (FWHM) and SNR of unsuppressed water peak, analyzing the time domain directly on free induction decays (FIDs). FWHM was calculated automatically using the Hankel-Lanczos single-variable decomposition (HLSVD) fitting algorithm. SNR was determined by the ratio between maximal unsuppressed water amplitude at 4.7 ppm measured by HLSVD and noise root mean square (standard deviation) extracted from the final 10 percent of FID (102 data points). Since the theoretical twofold increase of SNR from 1.5T to 3.0T applies only if signal area is compared, percent change in SNR from 1.5T to 3.0T was calculated based on the product of mean SNR (amplitude) × mean FWHM.
Determination of calf adiposity
Calf adiposity was measured as an additional parameter for correlation with BMI and IMCL results. Tracings for determination of right calf fat area were obtained utilizing commercial software (Alice, Parexel Inc., Waltham, MA). Data was collected from a single axial MR T1-weighted image located 8.0 cm distal to the proximal fibular tip. After selection of total calf cross section, the upper bound pixel intensity was determined automatically by the software, while the lower bound was fixed at 50% of upper bound. Fat within the marrow of tibia and fibula was manually removed from analysis, and a ratio was calculated between the resulting fat area and total cross section area of calf. Results were expressed in percent.
Statistical Analyses
Coefficients of variation (CV) were calculated by dividing the standard deviation of baseline and follow-up visit measurements by the mean of baseline and follow-up visit measurements. These values were then multiplied by 100 for presentation as percentages. Mean CVs, SNR and FWHM were compared between 3.0T and 1.5T using the Wilcoxon matched pairs signed rank test. Comparisons of IMCL, EMCL, unsuppressed water peak, SNR and FWHM between baseline and follow-up scans were also performed using this procedure. Baseline calf adiposity and soleus IMCL values were compared between healthy weight (BMI < 24.9 kg/m2) and overweight (BMI > 25 kg/m2) subject groups using one-way analysis of variance. Univariate analysis was performed comparing calf adiposity to BMI. In order to determine if data obtained at 3.0T improved CVs of subjects with increased adiposity, comparison of 3.0T to 1.5T CVs was performed specifically in overweight subjects using one-way analysis of variance. The BMI threshold was adopted as defined by the National Center for Health Statistics/Centers for Disease Control and Prevention [18]. The Shapiro-Wilk W-test for normality (goodness of fit) was performed on CVs from both muscles at both magnetic field strengths, with P < 0.05 rejecting the supposition of normality. Overall statistical significance was defined as P < 0.05. Statistical analyses were made using JMP Statistical Database Software (SAS Institute, Inc., Cary, NC).
RESULTS
A total of 15 male subjects were recruited. No subjects were excluded based on information provided during the screening interview. No subjects referred changes in dietary habits or physical activity during the study. Data from participating subjects is outlined in Table 1.
Table 1.
Subject data (n = 15).
| Parameter | Value (range) |
|---|---|
| Age (years) | 31.5 (21.0 – 48.0) |
| BMI | |
| Mean value | 27.8 (21.9 – 38.0) |
| Healthy weight (BMI < 24.9 kg/m2) | 5/15 |
| Overweight (BMI ≥ 25 kg/m2) | 10/15 |
| Time interval (days) | |
| Screening interview to baseline scan | 18 (5 – 56) |
| Baseline to follow-up scan | 31 (21 – 42) |
| Physical activity * | |
| Mild to moderate a | 11/15 |
| Sedentary b | 4/15 |
BMI, body mass index.
, Based on screening visit questionnaire response.
, Regular/stable exercise regimen, such as biking daily or running three times per week.
, Regular/stable non-exercising lifestyle.
All subjects completed the entire scanning protocol generating a total of 120 spectra, with 30 soleus and 30 TA spectra acquired at 3.0T and at 1.5T. Soleus spectra with indistinct IMCL-methylene peak due to overlapping lipid peaks were noted in baseline and follow-up scans of 3 subjects at 3.0T (6 spectra) and 5 subjects at 1.5T (10 spectra). These data were excluded from statistical analyses. The remaining soleus spectra showed well-defined separation of lipid peaks at 3.0T (12 subjects, 24 spectra) and 1.5T (10 subjects, 20 spectra). Unpaired data was not utilized by the Wilcoxon statistical procedure, resulting in analysis of 9 subjects (18 spectra) for differences in soleus CVs. All subjects showed spectra of TA at baseline and follow-up with well-defined separation of lipid peaks at 3.0T and 1.5T, resulting in analysis of 15 subjects (30 spectra). A qualitative assessment of soleus and TA spectra at both fields suggested better distinction of IMCL-methylene peaks at 3.0T (Figure 2).
Figure 2.
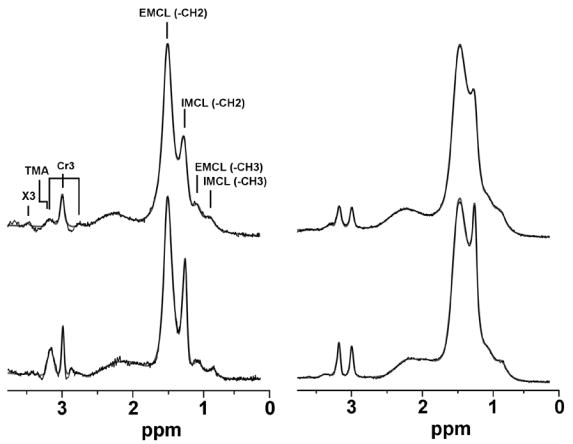
Spectra of tibialis anterior (left column) and soleus (right column). The top row shows data collected at 1.5T and the bottom row shows data collected at 3.0T. Spectra were fitted using the LCModel routine (dark trace, fitted spectrum; thin trace, raw data). The effect of increased spectral dispersion is noted in both muscles with improved resolution of the IMCL-methylene peak at 1.3 ppm at 3.0T. IMCL (-CH3), intramyocellular lipid methyl protons at 0.9 ppm; EMCL (-CH3), extramyocellular lipid methyl protons at 1.1 ppm; IMCL (-CH2), intramyocellular lipid methylene protons at 1.3 ppm; EMCL (-CH2), extramyocellular lipid methylene protons at 1.5 ppm; Cr3, creatine methyl protons at 2.8, 3.0 and 3.2 ppm; TMA, trimethylamines peak at 3.2 ppm; X3, peak tentatively assigned to taurine.
No significant difference between 3.0T and 1.5T was noted in mean CVs of soleus. CVs of TA were significantly higher at 3.0T. The data comparing mean CVs and lipid concentrations at 3.0T and 1.5T are listed in Table 2. Baseline and follow-up visit were not significantly different for concentrations of IMCL, EMCL, and unsuppressed water peak in soleus and TA at 3.0T and 1.5T (all P-values > 0.2).
Table 2.
Mean concentration and interexamination coefficients of variation of lipid measurements obtained at 3.0T and 1.5T.
| 3.0T | 1.5T | P-value † | |||
|---|---|---|---|---|---|
| Measured Lipid Ratio | Concentration * | CV | Concentration * | CV | |
| Soleus a | |||||
| IMCL | 830.3 ± 92.1 | 12.0 | 675.3 ± 91.1 | 9.6 | 0.50 |
| EMCL | 983.2 ± 156.7 | 11.6 | 992.3 ± 158.2 | 6.1 | 0.06 |
|
| |||||
| Tibialis anterior b | |||||
| IMCL | 139.5 ± 15.8 | 26.4 | 131.3 ± 12.8 | 20.3 | 0.02 |
| EMCL | 180.6 ± 27.0 | 21.5 | 188.4 ± 39.5 | 22.6 | 0.49 |
, Data are mean lipid ratio concentrations, in institutional units, ± standard errors of the mean. Concentrations are averages across
H MR spectroscopic data from both visits.
Comparison between mean CVs at 3.0T and 1.5T using Wilcoxon matched pairs signed rank test.
, 9 subjects, 18 spectra.
, 15 subjects, 30 spectra.
CV, mean interexamination coefficient of variation (standard deviation/mean) in percent.
IMCL, intramyocellular lipid methylene protons (1.3 ppm) and EMCL, extramyocellular lipid methylene protons (1.5 ppm), both scaled to unsuppressed water peak (3.0 ppm).
The Shapiro-Wilk statistic for normality showed significant values for soleus (P =0.002 ) and tibialis anterior (P =0.04) at 1.5T, in contrast to soleus (P =0.32) and tibialis anterior (P =0.59) at 3.0T.
Mean FWHM and SNR values were significantly higher at 3.0T, as outlined in Table 3. The maximum FWHM in soleus was 16.4 Hz at 3.0T and 13.4 Hz at 1.5T. The maximum FWHM in TA was 15.8 Hz at 3.0T and 14.3 Hz at 1.5T. No significant difference was noted between FWHM of baseline and follow-up visit for soleus or TA at 3.0T and 1.5T (all P-values > 0.1).
Table 3.
Mean SNR amplitudes and FWHM of unsuppressed water peak at 3.0T and 1.5T.
| SNR
|
FWHM (Hz)
|
|||||
|---|---|---|---|---|---|---|
| 3.0T | 1.5T | %-chg | 3.0T | 1.5T | %-chg | |
| Soleus | 340.5 ± 4.5 * | 247.3 ± 6.5 | 64 | 14.2 ± 0.3 * | 11.9 ± 0.3 | 19 |
| Tibialis anterior | 379.4 ± 1.2 * | 250.4 ± 4.9 | 62 | 13.4 ± 0.3 † | 12.5 ± 0.3 | 7 |
Data are mean values ± standard errors of the mean.
SNR, signal-to-noise ratio; FWHM, full-width at half maximum; Hz, Hertz.
-chg, percent change from 1.5T to 3.0T [for SNR, percent change was calculated from SNR area (mean SNR amplitude × mean FWHM)].
, P<0.001 and
P=0.02, for comparison of 3.0T to 1.5T using Wilcoxon matched pairs signed rank test.
Baseline soleus IMCL values were not significantly different in overweight vs. healthy weight subjects at 3.0T (920.2 ± 120 vs. 672.2 ± 141 IU, P = 0.2) and 1.5T (777.3 ± 106 vs. 554.7 ± 130 IU, P = 0.2). Calf adiposity was significantly correlated to BMI (r = 0.64, P = 0.01), and significantly higher in overweight vs. healthy weight subjects (20.2% ± 2.8 vs. 9.5% ± 3.8, P = 0.04). Separate analysis of overweight subjects showed no significant difference between 3.0T and 1.5T CVs of soleus (P = 0.13) and TA (P = 0.08).
DISCUSSION
The rationale for performing 1H-MRS for IMCL at higher magnetic fields comes from the expectation of improved measurement precision. Several factors affect the precision of IMCL quantification and are strongly related to variability introduced by field strength-dependent changes, equipment performance, repositioning, biologic variation and fitting error. IMCL-methylene (1.3 ppm) demonstrates consistent overlap with neighboring lipid peaks in the 0.9 – 1.5 ppm range, which may potentially benefit from increased chemical shift dispersion at 3.0T, in turn decreasing measurement variability secondary to fitting errors. Skoch et al. [15] performed long echo-time 1H-MRS of TA in subjects at 1.5T, with improved separation of methylene and methyl lipid components, and better repeatability indices in a separate group of subjects scanned without repositioning at 3.0T. In the current study, we examined the measurement precision of 1H-MRS for IMCL by comparing interexamination CVs of subjects scanned both at 3.0T and 1.5T.
Our study demonstrates no improvement in IMCL interexamination CVs obtained at 3.0T compared to 1.5T. In fact, CVs of soleus were comparable at both fields while CVs of TA were significantly higher at 3.0T. In a prior 1H-MRS report examining single-voxel PRESS of the posterior cyngulate gyri, Kantarci et al. [10] noted CVs for interexamination variability from phantom and inter-subject variability actually higher at 3.0T when compared to 1.5T. The lack of significant improvement in interexamination variability may be secondary to increased magnetic susceptibility effects within the 1H-MRS voxel at 3.0T. Coupled with shorter transverse relaxation times, this effect leads to increased FWHM that in turn decreases both SNR and accuracy of quantitative analysis at 3.0T [10]. As outlined in our data results, the relative proximity of CV values at 3.0T and 1.5T for both muscles suggests that gains in spectral resolution were offset by FWHM broadening coupled with lower than expected increase in SNR at 3.0T. On the other hand, statistical tests for normality were significant for CVs at 1.5T and non-significant at 3.0T. This indicates an increased likelihood of non-normal distribution of CV values at 1.5T, suggesting there may be increased uncertainty of spectral fitting due to lower spectral resolution.
Changing the operating field from 1.5T to 3.0T theoretically results in a twofold gain in SNR, since magnetization increases with the square of the field strength while noise increases linearly [19]. However, prior studies examining changes in brain SNR from 1.5T to 3.0T have demonstrated increases in the range of 30–60% for T2-weighted fast-spin echo imaging [19], 28% for short-echo single-voxel stimulated echo acquisition mode (STEAM) spectroscopy [11], 23% for single-voxel PRESS spectroscopy [10], and 23–46% for long-echo 3D multi-voxel spectroscopy [20]. An increase of ~80% in SNR was obtained when comparing 1.5T to 4.0T in short-echo single-voxel STEAM spectroscopy [21].
In our study, although SNR area was significantly increased at 3.0T for soleus (64%) and TA (62%), these were below the theoretically anticipated gain of 100%. In addition, comparison of FWHM in our study showed a modest however significant increase at 3.0T. Prior studies have shown increased FWHM at higher magnetic fields from 50% [11;21] to slightly more than double [10]. The increase in FWHM observed at higher fields is attributed mainly to increased field inhomogeneity [11;21] and decreased transverse relaxation times at 3.0T [11]. In a study examining the centrum semiovale of healthy volunteers at 3.0T and 1.5T, Barker et al. [11] noted a greater contribution of field inhomogeneity to FWHM broadening at 3.0T than at 1.5T. Further studies measuring T2 values of muscle have demonstrated decreased relaxation times in the range of 10% at 3.0T [13] and 15% at 4.0T [12] when compared to 1.5T. Additional decrease in SNR gain and quantification precision during high field 1H-MRS may occur secondary to more severe eddy current artifacts due to increased demand on gradient coils, causing spectral distortions and SNR loss; prolonged longitudinal relaxation causing signal losses; and increased chemical shift artifact which unless held constant by larger gradients, may lead to more artifacts from eddy currents [21].
Taken together, these factors represent characteristics inherent to high-field spectroscopic acquisitions that may have ultimately affected IMCL measurement precision in our study, regardless of qualitative improvements in spectral resolution. Soleus demonstrated more ample FWHM broadening from 1.5T to 3.0T, with concurrently lower SNR gain when compared to TA. Considering that soleus normally presents higher adiposity, numerous intrinsic deposits of macroscopic fat (EMCL) and a non-uniform multipennate architecture, it seems reasonable to speculate that inhomogeneities within the soleus 1H-MRS voxel may be more accentuated than in TA contributing to measurement imprecision despite gains in spectral resolution and SNR at 3.0T. Furthermore, the increased adiposity of soleus likely contributed to excessive overlap of neighboring lipid peaks, precluding reliable IMCL estimation.
The interexamination variability of TA IMCL at 1.5T was 20%, which is in agreement with a prior report showing variability of 21% with technical factors accounting for half of total variability [9]. Another prior study has demonstrated variability indices of 4% at 3.0T and 10–11% at 1.5T for TA IMCL (methylene peak) on same-day scans without repositioning, which likely reflects technical factors [15]. Our study was designed to compare variability at both scanners regardless of source (biological or technical), with results suggesting combined variations after 31 days were larger than the influence of increasing field strength. In the current study, EMCL CVs for soleus and TA at 3.0T and 1.5T were within the previously reported ranges of 10%–50% [22] and 4%–74% [23] suggesting consistent interexamination placement of 1H-MRS voxels.
Increased IMCL of soleus has been previously described in overweight and obese subjects examined using 1H-MRS [6]. In our study, overweight subjects had higher calf adiposity and showed no significant difference in soleus and TA CVs when comparing 3.0T to 1.5T. This finding suggests that 3.0T acquisitions did not improve measurement precision in subjects with higher adiposity, as determined by BMI and calf adiposity measurements. The use of smaller voxel sizes at 3.0T or high resolution chemical shift imaging may represent a reasonable approach to reduce the influence of the EMCL signal on the precision of spectral fitting, thereby decreasing variability indices.
Metabolite concentrations were calculated as ratios and expressed in institutional units, which are easily implemented and widely described in the literature. This method was employed rather than absolute quantification with phantom calibration, which requires time-consuming measurements of T1 and T2 relaxation times. Although corrections for relaxation may lead to higher accuracy in metabolite concentration measurements, the use of short echo times helps to minimize the effects of T2 relaxation changes. Furthermore, short echo time acquisitions yield better signal-to-noise ratios than long echo time acquisitions and thus appear to be preferable for quantification of lipid concentrations. The current study was performed using a relatively long TR (3,000 ms) compared to the reported T1 relaxation time for subcutaneous fat (288 ms at 1.5T; 371 ms at 3.0T) and muscle (1,130 ms at 1.5T; 1,420 ms at 3.0T) [13]. Therefore, it is likely our spectra had weak saturation, minimizing effects of T1 changes on SNR measurements.
There were several limitations in our study. First, although both spectrometer consoles are from the same manufacturer and data acquisition was performed with similar types and sizes of radiofrequency coils (quadrature) at both field strengths, coil efficiency was not measured. Measurement with standard phantoms would have allowed more precise estimation of SNR performance and helped explain the lower than expected SNR gains at 3.0T [12]. Furthermore, although the pulse sequence parameters were similar on both systems, we cannot rule out that there may have been small differences in their performance. Our study was also limited because pre-scan shimming was performed employing automated procedures provided by the spectrometers, without specific manual adjustments. Although all 1H-MRS scans were completed successfully, manual adjustments albeit time-consuming may have improved performance at both magnetic fields. This could be done targeting specific linewidths during the manual shimming procedure, thereby establishing thresholds for acceptance or rejection of collected data. In addition, improved high-order shimming techniques may also help to minimize inhomogeneity contributions to FWHM broadening [11].
Another shortcoming was the use of metabolite ratios (relative quantification). This requires an assumption of no significant temporal change in the concentration of reference metabolite (water), which was confirmed by our study results. However, potential changes in muscle water in free-living subjects remain unclear. Although relative quantification methodology may introduce larger errors than absolute quantification [24], Larson-Meyer et al. [25] have recently demonstrated a strong correlation between IMCL referenced to unsuppressed water peak and IMCL referenced to an external oil phantom (soleus, r = 0.981; TA, r = 0.990; P < 0.01 for all). Finally, our study was focused on comparing long-term variability between 3.0T and 1.5T data, without specifically addressing the origin of such variations (biological, technical). Nevertheless, our data provides useful information for longitudinal studies, showing that long-term variability in IMCL measurements offset potential benefits of higher-field acquisitions.
In summary, our study suggests that using current technology, 1H-MRS of soleus and TA muscles at 3.0T does not improve measurement precision when compared to 1.5T.
Acknowledgments
Funded in part by NIH Grant M01 RR01066 and MGH Musculoskeletal Imaging Research Core.
Footnotes
Publisher's Disclaimer: This is a PDF file of an unedited manuscript that has been accepted for publication. As a service to our customers we are providing this early version of the manuscript. The manuscript will undergo copyediting, typesetting, and review of the resulting proof before it is published in its final citable form. Please note that during the production process errors may be discovered which could affect the content, and all legal disclaimers that apply to the journal pertain.
References
- 1.Schick F, Eismann B, Jung WI, Bongers H, Bunse M, Lutz O. Comparison of localized proton NMR signals of skeletal muscle and fat tissue in vivo: two lipid compartments in muscle tissue. Magn Reson Med. 1993;29:158–167. doi: 10.1002/mrm.1910290203. [DOI] [PubMed] [Google Scholar]
- 2.Boesch C, Slotboom J, Hoppeler H, Kreis R. In vivo determination of intra-myocellular lipids in human muscle by means of localized 1H-MR-spectroscopy. Magn Reson Med. 1997;37:484–493. doi: 10.1002/mrm.1910370403. [DOI] [PubMed] [Google Scholar]
- 3.Jacob S, Machann J, Rett K, et al. Association of increased intramyocellular lipid content with insulin resistance in lean nondiabetic offspring of type 2 diabetic subjects. Diabetes. 1999;48:1113–1119. doi: 10.2337/diabetes.48.5.1113. [DOI] [PubMed] [Google Scholar]
- 4.Krssak M, Falk Petersen K, Dresner A, et al. Intramyocellular lipid concentrations are correlated with insulin sensitivity in humans: a 1H NMR spectroscopy study. Diabetologia. 1999;42:113–116. doi: 10.1007/s001250051123. [DOI] [PubMed] [Google Scholar]
- 5.Levin K, Daa Schroeder H, Alford FP, Beck-Nielsen H. Morphometric documentation of abnormal intramyocellular fat storage and reduced glycogen in obese patients with Type II diabetes. Diabetologia. 2001;44:824–833. doi: 10.1007/s001250100545. [DOI] [PubMed] [Google Scholar]
- 6.Sinha R, Dufour S, Petersen KF, et al. Assessment of skeletal muscle triglyceride content by (1)H nuclear magnetic resonance spectroscopy in lean and obese adolescents: relationships to insulin sensitivity, total body fat, and central adiposity. Diabetes. 2002;51:1022–1027. doi: 10.2337/diabetes.51.4.1022. [DOI] [PubMed] [Google Scholar]
- 7.Torriani M, Thomas BJ, Barlow RB, Librizzi J, Dolan S, Grinspoon S. Increased intramyocellular lipid accumulation in HIV-infected women with fat redistribution. J Appl Physiol. 2006;100:609–14. doi: 10.1152/japplphysiol.00797.2005. [DOI] [PMC free article] [PubMed] [Google Scholar]
- 8.Szczepaniak LS, Babcock EE, Schick F, et al. Measurement of intracellular triglyceride stores by H spectroscopy: validation in vivo. Am J Physiol. 1999;276:E977–989. doi: 10.1152/ajpendo.1999.276.5.E977. [DOI] [PubMed] [Google Scholar]
- 9.Torriani M, Thomas BJ, Halpern EF, Jensen ME, Rosenthal DI, Palmer WE. Intramyocellular lipid quantification: repeatability with 1H MR spectroscopy. Radiology. 2005;236:609–14. doi: 10.1148/radiol.2362041661. [DOI] [PubMed] [Google Scholar]
- 10.Kantarci K, Reynolds G, Petersen RC, et al. Proton MR spectroscopy in mild cognitive impairment and Alzheimer disease: comparison of 1 5 and 3 T. AJNR Am J Neuroradiol. 2003;24:843–9. [PMC free article] [PubMed] [Google Scholar]
- 11.Barker PB, Hearshen DO, Boska MD. Single-voxel proton MRS of the human brain at 1.5T and 3.0T. Magn Reson Med. 2001;45:765–9. doi: 10.1002/mrm.1104. [DOI] [PubMed] [Google Scholar]
- 12.Duewell SH, Ceckler TL, Ong K, et al. Musculoskeletal MR imaging at 4 T and at 1.5 T: comparison of relaxation times and image contrast. Radiology. 1995;196:551–5. doi: 10.1148/radiology.196.2.7617876. [DOI] [PubMed] [Google Scholar]
- 13.Gold GE, Han E, Stainsby J, Wright G, Brittain J, Beaulieu C. Musculoskeletal MRI at 3.0 T: relaxation times and image contrast. AJR Am J Roentgenol. 2004;183:343–51. doi: 10.2214/ajr.183.2.1830343. [DOI] [PubMed] [Google Scholar]
- 14.Behrens GM, Boerner AR, Weber K, et al. Impaired glucose phosphorylation and transport in skeletal muscle cause insulin resistance in HIV-1-infected patients with lipodystrophy. J Clin Invest. 2002;110:1319–1327. doi: 10.1172/JCI15626. [DOI] [PMC free article] [PubMed] [Google Scholar]
- 15.Skoch A, Jiru F, Dezortova M, et al. Intramyocellular lipid quantification from 1H long echo time spectra at 1.5 and 3 T by means of the LCModel technique. J Magn Reson Imaging. 2006;23:728–35. doi: 10.1002/jmri.20574. [DOI] [PubMed] [Google Scholar]
- 16.Provencher SW. Estimation of metabolite concentrations from localized in vivo proton NMR spectra. Magn Reson Med. 1993;30:672–679. doi: 10.1002/mrm.1910300604. [DOI] [PubMed] [Google Scholar]
- 17.Naressi A, Couturier C, Devos JM, et al. Java-based graphical user interface for the MRUI quantitation package. MAGMA. 2001;12:141–152. doi: 10.1007/BF02668096. [DOI] [PubMed] [Google Scholar]
- 18.Kuczmarski RJ, Flegal KM. Criteria for definition of overweight in transition: background and recommendations for the United States. Am J Clin Nutr. 2000;72:1074–81. doi: 10.1093/ajcn/72.5.1074. [DOI] [PubMed] [Google Scholar]
- 19.Frayne R, Goodyear BG, Dickhoff P, Lauzon ML, Sevick RJ. Magnetic resonance imaging at 3.0 Tesla: challenges and advantages in clinical neurological imaging. Invest Radiol. 2003;38:385–402. doi: 10.1097/01.rli.0000073442.88269.c9. [DOI] [PubMed] [Google Scholar]
- 20.Gonen O, Gruber S, Li BS, Mlynarik V, Moser E. Multivoxel 3D proton spectroscopy in the brain at 1.5 versus 3.0 T: signal-to-noise ratio and resolution comparison. AJNR Am J Neuroradiol. 2001;22:1727–31. [PMC free article] [PubMed] [Google Scholar]
- 21.Bartha R, Drost DJ, Menon RS, Williamson PC. Comparison of the quantification precision of human short echo time (1)H spectroscopy at 1.5 and 4.0 Tesla. Magn Reson Med. 2000;44:185–92. doi: 10.1002/1522-2594(200008)44:2<185::aid-mrm4>3.0.co;2-v. [DOI] [PubMed] [Google Scholar]
- 22.Boesch C, Decombaz J, Slotboom J, Kreis R. Observation of intramyocellular lipids by means of 1H magnetic resonance spectroscopy. Proc Nutr Soc. 1999;58:841–850. doi: 10.1017/s0029665199001147. [DOI] [PubMed] [Google Scholar]
- 23.Decombaz J, Schmitt B, Ith M, et al. Postexercise fat intake repletes intramyocellular lipids but no faster in trained than in sedentary subjects. Am J Physiol Regul Integr Comp Physiol. 2001;281:R760–769. doi: 10.1152/ajpregu.2001.281.3.R760. [DOI] [PubMed] [Google Scholar]
- 24.Jansen JF, Backes WH, Nicolay K, Kooi ME. 1H MR spectroscopy of the brain: absolute quantification of metabolites. Radiology. 2006;240:318–32. doi: 10.1148/radiol.2402050314. [DOI] [PubMed] [Google Scholar]
- 25.Larson-Meyer DE, Smith SR, Heilbronn LK, Kelley DE, Ravussin E, Newcomer BR. Muscle-associated triglyceride measured by computed tomography and magnetic resonance spectroscopy. Obesity (Silver Spring) 2006;14:73–87. doi: 10.1038/oby.2006.10. [DOI] [PMC free article] [PubMed] [Google Scholar]