

Abstract
Background
The last decade witnessed an explosion of information regarding the genetic, molecular, and mechanistic basis of heart disease. Translating this information into clinical practice requires the development of novel functional imaging modalities for diagnosis, localization, and guided intervention. A noninvasive modality for imaging cardiac arrhythmias is not yet available. Present electrocardiographic methods cannot precisely localize a ventricular tachycardia (VT) or its key reentrant circuit components. Recently, we developed a noninvasive electrocardiographic imaging modality (ECGI) that can reconstruct epicardial electrophysiological information from body surface potentials. Here, we extend its application to image reentrant arrhythmias.
Methods and Results
Epicardial potentials were recorded during VT with a 490 electrode sock during an open chest procedure in 2 dogs with 4-day-old myocardial infarctions. Body surface potentials were generated from these epicardial potentials in a human torso model. Realistic geometry errors and measurement noise were added to the torso data, which were then used to noninvasively reconstruct epicardial isochrones, electrograms, and potentials with excellent accuracy. ECGI reconstructed the reentry pathway and its key components, including (1) the central common pathway, (2) the VT exit site, (3) lines of block, and (4) regions of slow and fast conduction. This allowed for detailed characterization of the reentrant circuit morphology.
Conclusions
ECGI can noninvasively image arrhythmic activation on the epicardium during VT to identify and localize key components of the arrhythmogenic pathway that can be effective targets for antiarrhythmic intervention.
Keywords: electrocardiography, myocardial infarction, reentry, tachycardia
The practice of modern medicine relies heavily on noninvasive imaging modalities, such as CT and MRI, for diagnosis and therapy. These modalities can reconstruct very detailed anatomic images, and they also provide functional information regarding regional blood flow, perfusion, and metabolic activity. Equivalent noninvasive modalities for functional electrophysiological imaging of the heart are not yet available, despite the fact that cardiac arrhythmias constitute a major cause of death and disability, with an estimated 300 000 cases of sudden cardiac death annually in the United States alone.1 Despite this alarming fact, noninvasive evaluation of cardiac electrical function during arrhythmias is deduced from the (low resolution, remote from the heart) body surface ECG,2 body surface potential maps,3,4 or paced body surface QRS integral mapping.5 However, these body surface measures cannot provide detailed information on regional electrical activity in the heart, such as the origin of arrhythmogenic activity, the sequence of arrhythmic activation, or the existence and location of an abnormal electrophysiological substrate that may put a patient at high risk for sudden cardiac death.
Clearly, we need a true imaging modality that can noninvasively provide detailed electrophysiological information on the surface of the heart. Potential applications include screening patients at risk for sudden cardiac death, noninvasive evaluation of electrophysiological changes caused by drug therapy, and guiding nonpharmacological interventions, such as ablation and pacing, in terms of optimal positioning relative to the arrhythmogenic substrate. Furthermore, advances in genetic and molecular biology have helped determine the genetic basis and cellular mechanisms of various cardiac arrhythmias (ie, long-QT syndrome6-11). A true imaging modality for cardiac electrical function will be needed for the diagnosis and treatment (eg, targeted drug delivery or genetic/molecular modification) of such hereditary rhythm disorders.
The most common mechanism of clinical cardiac arrhythmias is reentry,12,13 an abnormal propagation of the excitation wavefront that forms closed loops or spiral waves14 that capture the heart and disturb the normal pattern of synchronized excitation necessary for efficient blood pumping. Reentry develops in pathological substrates, such as those associated with ischemia and infarction12 or electrophysiological remodeling,15-18 and it involves slow conduction and conduction block. In this report, we demonstrate for the first time the feasibility of the noninvasive imaging of reentrant cardiac arrhythmias.
Electrocardiographic imaging (ECGI) is a noninvasive method for reconstructing detailed electrophysiological information on the surface of the heart using body surface measurements.19 Using a recently developed and validated ECGI methodology,20-22 we reconstructed the reentry pathway and activation pattern of the heart during ventricular tachycardia (VT). We showed that ECGI can noninvasively reconstruct the sequence of activation on the epicardium, including the double-loop reentry pathway, regions of slow conduction, and epicardial potentials and electrograms during VT. Importantly, lines of conduction block and the common pathway of the 2 reentrant waves (a strategic site for ablation) are accurately reconstructed and located by this approach.
Methods
Experimental and Modeling Methods
Both experimentally measured epicardial electrical potentials from a canine heart and a computer model of the human torso were used in this study.22 Myocardial infarction was surgically produced in 2 dogs (body weights, 20 and 22 kg) through the ligation of the left anterior descending coronary artery (LAD) just distal to the first diagonal branch; 2 additional distant branches were ligated to prevent collateral flow.23,24 The chest was closed in layers, an airtight seal was established, and the infarct was allowed to form. Four days later, the heart was exposed through a median sternotomy for electrical epicardial mapping during induced reentrant VT.
The VT was induced through programmed stimulation with a basic cycle length drive train and 1, 2, or 3 premature extrastimuli. Epicardial potentials were recorded with a temporal resolution of 1 ms using a sock containing 490 electrodes. The potentials were placed on the surface of a digitized heart, which was positioned in the correct anatomical location within the human torso model, as described in a previous study.22 The recorded epicardial potentials were used to generate electrocardiographic potentials on the human torso surface; these potentials were contaminated by measurement noise and electrode-position errors. Fifty microvolt peak-to-peak gaussian noise (0.5% of the signal) was added to the electrocardiographic torso potentials, and 2 mm geometric error with gaussian distribution was added to the torso surface points to represent realistic electrocardiographic recordings. A more detailed description of this model and discussion of its advantages and limitations was published previously.22
Computational Methods
Epicardial potentials were noninvasively reconstructed from the electrocardiographic torso potentials over the entire surface of the heart and throughout the cardiac cycle using previously developed and validated ECGI mathematical methodology.21,25 Briefly, ECGI noninvasively computes potentials on the heart surface by solving Laplace's equation within the torso volume, using torso surface potentials and the geometric relationship between the epicardial and torso surfaces as inputs. The first step in this procedure is the discretization of the relationship between the epicardial potentials and the torso surface potentials. The discretization is obtained through the use of the boundary element method, which results in the linear matrix relationship of VT=AVE, where VT and VE represent vectors of torso and epicardial surface potentials, respectively. The matrix A encodes the geometric relationship between the epicardial and torso surfaces as discretized through the boundary element method.
The second step is the inversion of the linear matrix relation to obtain epicardial potentials from the measured torso surface potentials. Tikhonov regularization26 is used to stabilize the solution because this problem is ill-posed (ie, unstable in the presence of noise). The Composite Residual and Smoothing Operator method27 is used to determine the degree of regularization required for an accurate estimate of the epicardial potentials. Two consecutive reentry cycles of monomorphic VT are presented in detail as representative data. Reconstructions were performed for 4 additional reentrant cycles in both dogs. The accuracy of reconstruction was similar for all cases, and statistical measures are provided in the Table. In addition to spatial epicardial potential maps, epicardial electrograms (potential over time at a single site) were reconstructed at 490 evenly distributed epicardial sites and used to construct isochronal maps describing the sequence of ventricular activation during the arrhythmia.
Reconstruction Errors
| Average RE |
Average CC |
Average AE, mV |
Maximum AE, mV |
|
|---|---|---|---|---|
| Electrograms | ||||
| Dog 1, cycle 1* | 0.47 | 0.88 | 12.04 | 44.41 |
| Dog 1, cycle 2* | 0.48 | 0.88 | 11.97 | 40.64 |
| Dog 1, cycle 3 | 0.49 | 0.86 | 10.83 | 36.76 |
| Dog 2, cycle 1 | 0.54 | 0.87 | 12.82 | 40.00 |
| Dog 2, cycle 2 | 0.46 | 0.89 | 12.60 | 44.18 |
| Dog 2, cycle 3 | 0.51 | 0.88 | 13.31 | 39.57 |
| Potential maps | ||||
| Dog 1, cycle 1* | 0.44 | 0.87 | 16.04 | 44.41 |
| Dog 1, cycle 2* | 0.41 | 0.87 | 15.95 | 40.64 |
| Dog 1, cycle 3 | 0.46 | 0.85 | 17.31 | 36.75 |
| Dog 2, cycle 1 | 0.50 | 0.85 | 19.42 | 40.00 |
| Dog 2, cycle 2 | 0.43 | 0.89 | 16.43 | 44.18 |
| Dog 2, cycle 3 | 0.46 | 0.85 | 21.55 | 39.57 |
Relative error (RE), correlation coefficient (CC), and absolute error (AE) are defined as follows:
| (1) |
| (2) |
| (3) |
For the potential map error measures, n is the number of epicardial points (490). For the electrogram error measures, n is the number of time frames in the cycle. is the computed potential for sample i; is the measured potential for sample i; is the average computed potential; and is the average measured potential. The average RE, CC, and AE for the potential maps are averaged over each cycle, and the corresponding values for the electrograms are averaged over all 490 epicardial points.
The general quality of reconstructed potential maps and electrograms was evaluated with respect to measured data using absolute error, relative error, and correlation coefficient, as defined previously22 (definitions are provided in the Table). The average absolute error, relative error, and correlation coefficient presented for potential maps were averaged over all reconstructed time frames, and the corresponding values used for electrograms were averaged over all 490 epicardial points. Activation times were determined as the time of maximum negative derivative in the epicardial electrograms.21 Information from neighboring electrograms was used to edit activation times in a small number (<5%) of electrograms with multiple large negative derivatives. Lines of block were drawn to separate sites with activation time differences >30 ms.
Results
Activation isochrones during the arrhythmia are shown in Figure 1 for 2 sequential reentrant cycles. The general activation pattern is that of a double-loop reentry, with lines of conduction block defining a central common pathway (CCP) in the region of the infarction (the area of the left ventricle not perfused due to LAD occlusion). During the first cycle (Figure 1, top), an analysis of the measured isochrones shows the activation front entering the CCP near the distal tip of the LAD and advancing through the CCP to the exit site, where the wavefront divides into 2 reentrant arms: one propagates counterclockwise around the superior line of block toward the base and the other propagates clockwise and posterior around the inferior line of block. The counterclockwise wavefront spreads superiorly across the left ventricle, crosses the LAD to the right ventricle, and turns to reenter the CCP. The clockwise wavefront spreads around the posterior of the heart to rejoin the circuit over the right ventricle at the entrance to the CCP. At the base of the right ventricle, excitation due to the previous reentrant cycle occurs at the same time that the next cycle begins at the entrance to the CCP.
Figure 1.
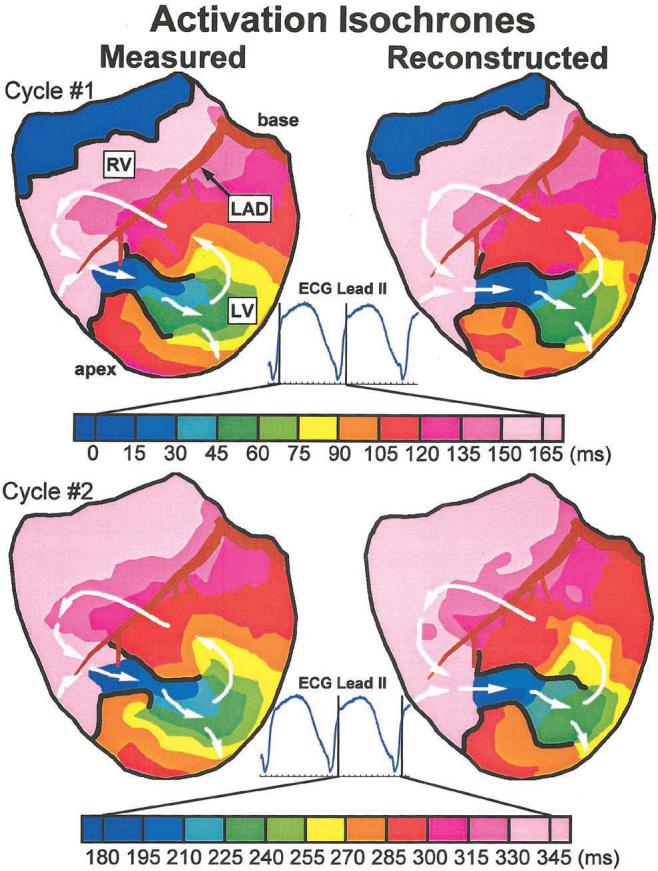
Anterior view of activation isochrones during 2 cycles of VT. Isochrones are presented for each cycle, with color legend (time in ms) displayed below. The right ventricle (RV), LAD, and left ventricle (LV) are labeled. Lines of block are drawn in black. ECG lead II is shown, with vertical lines indicating time frames displayed for each cycle. Top, Isochrones from first VT cycle. Bottom, Isochrones from second VT cycle. Left, Measured isochrones. Right, Noninvasively reconstructed isochrones. Arrows indicate direction of wavefront propagation. An animated version of this figure can be found at www.circulationaha.org
The noninvasively reconstructed isochrones for the first cycle show the same reentrant pattern of activation, with the CCP and lines of block reconstructed in approximately the same locations as their directly measured counterparts. The crowding of isochrones around the tips of the lines of block indicates a slowing of conduction as the wavefronts turn around the pivot points on exiting from the CCP. The sparse isochrones across the right ventricle (120 to 165 ms) reflect faster conduction. These variations of conduction velocity are captured in the noninvasive isochrone map. The measured isochrones from the second cycle of reentry (Figure 1, bottom) show the same reentrant pattern, with lines of block forming in approximately the same locations as during the first cycle. Again, the ECGI-reconstructed isochrones capture the morphology of the reentrant circuit, allowing for a detailed noninvasive identification of the arrhythmia pathway.
Electrograms were recorded from 12 locations around the heart surface during 2 cycles of the VT; they are shown in Figure 2 with their noninvasively reconstructed counterparts. Sites A through C are in the region of the reentrant circuit CCP. The noninvasive electrograms are similar to the measured electrograms, with low-level reconstruction noise and suppression of peak-to-peak amplitude at site A. Sites D through F are located near the exit region of the CCP. The timing of the maximum negative derivatives of the electrograms (time of local activation) shows that activation spreads from site D to sites E and F at about the same time, indicating the formation of the superior and inferior arms, as shown in Figure 1. The reconstructed electrograms at these sites closely match the measured electrograms, resulting in the same estimated sequence of activation.
Figure 2.

Epicardial electrograms during 2 cycles of VT. Anterior and posterior views of heart are shown. Letters in boxes identify sites where measured and noninvasively reconstructed electrograms are displayed. Solid black lines estimate location of CCP. Electrograms are shown in pairs, with measured electrograms on left and noninvasively reconstructed electrograms on right. Sites A through C are from CCP, D through F are from anterior left ventricle (LV), G through I are from anterior right ventricle (RV), J and K are from the posterior left ventricle, and L is from posterior right ventricle. CC indicates correlation coefficient between noninvasively reconstructed and measured electrograms.
Electrograms from sites G-I lie over the infarct-free anterior right ventricle and have sharp RS (positive-negative) deflections, which are characteristic of the passage of a well-organized activation wavefront through normal myocardium. The reconstructed electrograms at sites G and I closely resemble the measured electrograms. At site H, the reconstructed electrogram has a reduced amplitude. However, the timing of the sharp negative deflection at this site still matches the timing of the measured deflection, providing an accurate activation time estimation. Electrograms at sites J through L, from the posterior surface of the heart, show very sharp negative deflections, indicating the passage of a well-organized wavefront under the recording site. ECGI noninvasively reconstructs the morphologies of these electrograms with good accuracy.
Note that, on average, the maximum negative derivatives of the reconstructed electrograms are 30% smaller in magnitude (less sharp) relative to the measured ones. However, the timing of their occurrence is similar in both, resulting in accurate determination of local activation times and isochrones (Figure 1). The Table summarizes the average errors of the 490 reconstructed electrograms for the 6 reentrant cycles.
Potential distributions on the epicardial surface at various time points throughout the VT provide yet another method for mapping the reentrant circuit. Epicardial potential maps are shown in Figure 3, together with the corresponding torso surface electrocardiographic potentials. The location of the activation wavefront on the epicardial surface can be estimated from the presence of sharp potential changes (sharp spatial gradients).28 In some cases, the wavefront also marks the boundary between negative and positive potentials (propagation is toward positive potentials). At 5 ms (Figure 3A), the wavefront is entering the CCP while the previous cycle terminates over the basal right ventricle. This is reflected in the positive regions, both at the opening of the CCP and over the basal right ventricle, which are separated by a large negative region over the anterior right ventricle. This potential pattern is noninvasively reconstructed from the torso potential map using ECGI.
Figure 3.

Potential maps during VT. Potentials are displayed as contour maps, with negative regions shaded red to green and positive regions shaded green to blue. Estimated wavefront locations are shown with arrows. A, 5 ms wavefront entering CCP. Left, Anterior view of torso. Middle, Anterior view of measured epicardial potentials. Right, Anterior view of noninvasively reconstructed epicardial potentials. Bottom, ECG lead II is shown, with arrow indicating time frame presented. B, 50 ms wavefront exiting CCP. C, 105 ms wavefront forming arms of reentrant circuit.
At 50 ms (Figure 3B), the wavefront has exited the CCP and propagated inferiorly, as indicated by the large magnitude positive region and steep gradients over the inferior left ventricle. This progression of the wavefront is accurately reconstructed in the noninvasive epicardial map. At 105 ms (Figure 3C), the reentrant wavefront has formed 2 arms that envelope the CCP. ECGI reconstructs this complex potential pattern, correctly showing the 2 reentry arms of the circuit. Note that the torso potentials at this time only show a single anterior negative region, which does not reflect the complexity of the underlying epicardial pattern. Despite this lack of detail, ECGI can reconstruct the complexity of the epicardial potentials from the smooth and low resolution torso pattern. Potential map reconstruction errors for each reconstructed reentrant cycle are presented in the Table.
Discussion
This study is the first demonstration of noninvasive reconstruction of reentrant activation during an arrhythmia. We showed that ECGI can image the reentry pathway and its key components, including the CCP, its entry and exit sites, lines of block, and regions of slow and fast conduction. Previously, such detailed electrophysiological information was available only through very invasive epicardial mapping procedures.29,30 The ability to noninvasively obtain such information in patients will open the door for mechanistic studies of arrhythmogenesis in humans.
The infarct substrates produced in this study through LAD occlusion23,24 differed from the ethanol-induced infarct used previously to evaluate ECGI in the context of infarct substrates.22 The abnormal substrate produced by LAD occlusion resulted in reentrant arrhythmias with epicardial participation in the area over the infarct (epicardial border zone) in both dogs studied. For all 6 reconstructed reentrant cycles, an epicardial reentrant circuit similar to those presented in Figures 1 through 3 was recorded. The thickness of the spared tissue in the epicardial border zones varied from 0 to 2 mm. ECGI reconstructions accurately reproduced the general circuit morphology, lines of conduction block, and regions of slow and fast conduction in all cases. Although clinical reentry often occurs in the 3D myocardium, the subepicardium plays an important role in the maintenance of reentry in up to 33% of patients undergoing epicardial photocoagulation or ablation therapy.29-32 Failure to locate and ablate subepicardial target sites has been suggested as a reason for the failure of catheter ablation to treat patients with VT.33,34 Thus, the noninvasive reconstruction of epicardial electrophysiological information demonstrated in this study would provide valuable clinical information that is presently not available.
It should be noted that ECGI need not be limited to epicardial reentry, because previous studies have shown that information on intramural activity can be obtained from the epicardial potential patterns and their evolution in time.21,35,36 Furthermore, in the case of transmural infarction, ECGI could be used to characterize the electrophysiology of the infarct substrate22 and identify sites of epicardial breakthrough during reentrant activation. Interpretation of intramural arrhythmogenic activity could be further enhanced by direct catheter mapping37,38 or noncontact catheter reconstruction39-41 of electrophysiological information on the endocardial surface simultaneously with noninvasive epicardial ECGI. The combination of epicardial and endocardial electrophysiological information, with knowledge of the intramural anatomic organization of the myocardium, would provide an unprecedented ability to localize arrhythmogenic activity within the myocardial depth using only noninvasive or minimally invasive procedures.
Noninvasive localization of critical regions such as the CCP is a prerequisite for guiding noninvasive therapeutic intervention. Once a target is identified and localized, focused energy could be applied for noninvasive ablation.42 ECGI could also be used to immediately and noninvasively view reentrant circuit changes caused by drug administration. Finally, ECGI's ability to detect abnormal electrophysiological substrates22 can provide a noninvasive procedure for identifying patients at a high risk of life-threatening arrhythmias. After screening, prophylactic measures (eg, implantable defibrillators, ablation, drug therapy, or genetic/molecular modification) can be taken before sudden cardiac death occurs.
This study builds on the existing foundation of work20-22,43 toward the clinical implementation of ECGI through careful validation using controlled and verifiable combinations of experimental and modeling approaches. In this and previous studies,20-22 the exact geometry of the epicardial and torso surfaces was known, and the volume between the 2 surfaces was assumed homogeneous (eg, no lungs). A previous detailed geometric study43 suggested that successful clinical implementation of ECGI could be achieved through the fusion of existing anatomic imaging modalities (eg, CT or MRI), with ECGI for patient-specific acquisition of the torso and epicardial geometry. The assumption of a homogenous torso used in this study is valid because it has been previously demonstrated to have minimal effect on epicardial potential patterns, electrogram waveforms, or isochrones.28,44 Of course, implementing ECGI in the clinical setting will require additional validation in patients with known activation sequences; this can be done through direct comparison with epicardial maps recorded during open heart surgery.
Acknowledgments
This study was supported by National Institutes of Health/National Heart, Lung and Blood Institute grants R37 HL-33343, R01 HL-49054 (to Y.R.), and R01 HL-43276 (to B.T.). Additional support was provided by awards from the Whitaker Foundation (to Y.R.), the Nora Eccles Treadwell Foundation, and the Richard A. and Nora Eccles Harrison Fund for Cardiovascular Research (to B.T.). The authors thank Drs Philip Ershler, Robert L. Lux, Bonnie B. Punske, and Robert S. Macleod for assistance during the experiment and data transfer, Jane H. Davis for helping with the sterile surgery, and Yonild Vyhmeister for helping with the surgery and the data processing.
References
- 1.Myerburg RJ, Kessler KM, Kimura S, et al. Life-threatening ventricular arrhythmias: the link between epidemiology and pathophysiology. In: Zipes DP, Jalife J, editors. Cardiac electrophysiology: From Cell to Bedside. 2nd ed. Saunders; Philadelphia, Pa: 1995. pp. 723–31. [Google Scholar]
- 2.Josephson M, Horowitz L, Waxman H, et al. Sustained ventricular tachycardia: role of the 12-lead electrocardiogram in localizing site of origin. Circulation. 1981;64:257–272. doi: 10.1161/01.cir.64.2.257. [DOI] [PubMed] [Google Scholar]
- 3.Klug D, Ferracci A, Molin F, et al. Body surface potential distributions during idiopathic ventricular tachycardia. Circulation. 1995;91:2002–2009. doi: 10.1161/01.cir.91.7.2002. [DOI] [PubMed] [Google Scholar]
- 4.Liebman J, Zeno JA, Olshansky B, et al. Electrocardiographic body surface potential mapping in the Wolff-Parkinson-White syndrome: noninvasive determination of the ventricular insertion sites of accessory atrioventricular connections. Circulation. 1991;83:886–901. doi: 10.1161/01.cir.83.3.886. [DOI] [PubMed] [Google Scholar]
- 5.Sippensgroenewegen A, Spekhorst H, van Hemel NM, et al. Value of body surface mapping in localizing the site of origin of ventricular tachycardia in patients with previous myocardial infarction. J Am Coll Cardiol. 1994;24:1708–1724. doi: 10.1016/0735-1097(94)90178-3. [DOI] [PubMed] [Google Scholar]
- 6.Moss AJ, Zareba W, Benhorin J, et al. ECG T-wave patterns in genetically distinct forms of the hereditary long QT syndrome. Circulation. 1995;92:2929–2934. doi: 10.1161/01.cir.92.10.2929. [DOI] [PubMed] [Google Scholar]
- 7.Keating MT, Sanguinetti MC. Molecular genetic insights into cardiovascular disease. Science. 1996;272:681–685. doi: 10.1126/science.272.5262.681. [DOI] [PubMed] [Google Scholar]
- 8.Barinaga M. Tracking down mutations that can stop the heart [published erratum appears in Science. 1998;282:417] Science. 1998;281:32–34. doi: 10.1126/science.281.5373.32. [DOI] [PubMed] [Google Scholar]
- 9.Clancy CE, Rudy Y. Linking a genetic defect to its cellular phenotype in a cardiac arrhythmia. Nature. 1999;400:566–569. doi: 10.1038/23034. [DOI] [PubMed] [Google Scholar]
- 10.Priori S, Barhanin J, Hauer R, et al. Genetic and molecular basis of cardiac arrhythmias: impact on clinical management, part III. Circulation. 1999;99:674–681. doi: 10.1161/01.cir.99.5.674. [DOI] [PubMed] [Google Scholar]
- 11.Priori S, Barhanin J, Hauer R, et al. Genetic and molecular basis of cardiac arrhythmias: impact on clinical management, parts I and II. Circulation. 1999;99:518–528. doi: 10.1161/01.cir.99.4.518. [DOI] [PubMed] [Google Scholar]
- 12.Janse MJ, Wit AL. Electrophysiological mechanisms of ventricular arrhythmias resulting from myocardial ischemia and infarction. Physiol Rev. 1989;69:1049–1169. doi: 10.1152/physrev.1989.69.4.1049. [DOI] [PubMed] [Google Scholar]
- 13.El-Sherif N. Reentrant mechanisms in ventricular arrhythmias. In: Zipes DP, Jalife J, editors. Cardiac Electrophysiology: From Cell to Bedside. 2nd ed. Saunders; Philadelphia, Pa: 1995. pp. 567–582. [Google Scholar]
- 14.Davidenko JM, Pertsov AV, Salomonsz R, et al. Stationary and drifting spiral waves of excitation in isolated cardiac muscle. Nature. 1992;355:349–351. doi: 10.1038/355349a0. [DOI] [PubMed] [Google Scholar]
- 15.Wijffels MC, Kirchhof CJ, Dorland R, et al. Atrial fibrillation begets atrial fibrillation: a study in awake chronically instrumented goats. Circulation. 1995;92:1954–1968. doi: 10.1161/01.cir.92.7.1954. [DOI] [PubMed] [Google Scholar]
- 16.Pu J, Boyden PA. Alterations of Na+ currents in myocytes from epicardial border zone of the infarcted heart: a possible ionic mechanism for reduced excitability and postrepolarization refractoriness. Circ Res. 1997;81:110–119. doi: 10.1161/01.res.81.1.110. [DOI] [PubMed] [Google Scholar]
- 17.Fareh S, Villemaire C, Nattel S. Importance of refractoriness heterogeneity in the enhanced vulnerability to atrial fibrillation induction caused by tachycardia-induced atrial electrical remodeling. Circulation. 1998;98:2202–2209. doi: 10.1161/01.cir.98.20.2202. [DOI] [PubMed] [Google Scholar]
- 18.Peters NS, Wit AL. Myocardial architecture and ventricular arrhythmo-genesis. Circulation. 1998;97:1746–1754. doi: 10.1161/01.cir.97.17.1746. [DOI] [PubMed] [Google Scholar]
- 19.Barr RC, Spach MS. Inverse calculation of QRS-T epicardial potentials from body surface potential distributions for normal and ectopic beats in the intact dog. Circ Res. 1978;42:661–675. doi: 10.1161/01.res.42.5.661. [DOI] [PubMed] [Google Scholar]
- 20.Oster HS, Taccardi B, Lux RL, et al. Noninvasive electrocardiographic imaging: reconstruction of epicardial potentials, electrograms, and isochrones and localization of single and multiple electrocardiac events. Circulation. 1997;96:1012–1024. doi: 10.1161/01.cir.96.3.1012. [DOI] [PubMed] [Google Scholar]
- 21.Oster HS, Taccardi B, Lux RL, et al. Electrocardiographic imaging: noninvasive characterization of intramural myocardial activation from inverse-reconstructed epicardial potentials and electrograms. Circulation. 1998;97:1496–1507. doi: 10.1161/01.cir.97.15.1496. [DOI] [PubMed] [Google Scholar]
- 22.Burnes JE, Taccardi B, MacLeod RS, et al. Noninvasive electrocardiographic imaging of electrophysiologically abnormal substrates in infarcted hearts: a model study. Circulation. 2000;101:533–540. doi: 10.1161/01.cir.101.5.533. [DOI] [PubMed] [Google Scholar]
- 23.Harris A. Delayed development of ventricular ectopic rhythm following experimental coronary occlusion. Circulation. 1950;1:1318–1328. doi: 10.1161/01.cir.1.6.1318. [DOI] [PubMed] [Google Scholar]
- 24.Dillon SM, Allessie MA, Ursell PC, et al. Influences of anisotropic tissue structure on reentrant circuits in the epicardial border zone of subacute canine infarcts. Circ Res. 1988;63:182–206. doi: 10.1161/01.res.63.1.182. [DOI] [PubMed] [Google Scholar]
- 25.Rudy Y, Messinger-Rapport BJ. The inverse problem in electrocardiography: solutions in terms of epicardial potentials. Crit Rev Biomed Eng. 1988;16:215–268. [PubMed] [Google Scholar]
- 26.Tikhonov AN, Arsenin VY. Solutions of Ill-Posed Problems. John Wiley & Sons; New York, NY: 1977. [Google Scholar]
- 27.Colli-Franzone P, Guerri L, Tentoni S, et al. Mathematical procedure for solving the inverse potential problem of electrocardiography: analysis of the time-space accuracy from in vitro experimental data. Math Biosci. 1985;77:353–396. [Google Scholar]
- 28.Rudy Y. The electrocardiogram and cardiac excitation. In: Sperelakis N, Kurachi Y, Terzic A, et al., editors. Heart Physiology and Pathophysiology. Academic Press; San Diego, Callif: 2000. pp. 133–148. [Google Scholar]
- 29.Kaltenbrunner W, Cardinal R, Dubuc M, et al. Epicardial and endocardial mapping of ventricular tachycardia in patients with myocardial infarction: is the origin of the tachycardia always subendocardially localized? Circulation. 1991;84:1058–1071. doi: 10.1161/01.cir.84.3.1058. [DOI] [PubMed] [Google Scholar]
- 30.Littmann L, Svenson RH, Gallagher JJ, et al. Functional role of the epicardium in postinfarction ventricular tachycardia: observations derived from computerized epicardial activation mapping, entrainment, and epicardial laser photoablation. Circulation. 1991;83:1577–1591. doi: 10.1161/01.cir.83.5.1577. [DOI] [PubMed] [Google Scholar]
- 31.Svenson RH, Littmann L, Gallagher JJ, et al. Termination of ventricular tachycardia with epicardial laser photocoagulation: a clinical comparison with patients undergoing successful endocardial photocoagulation alone. J Am Coll Cardiol. 1990;15:163–170. doi: 10.1016/0735-1097(90)90194-t. [DOI] [PubMed] [Google Scholar]
- 32.Sosa E, Scanavacca M, D'Avila A, et al. Endocardial and epicardial ablation guided by nonsurgical transthoracic epicardial mapping to treat recurrent ventricular tachycardia. J Cardiovasc Electrophysiol. 1998;9:229–239. doi: 10.1111/j.1540-8167.1998.tb00907.x. [DOI] [PubMed] [Google Scholar]
- 33.Morady F, Harvey M, Kalbfleisch SJ, et al. Radiofrequency catheter ablation of ventricular tachycardia in patients with coronary artery disease. Circulation. 1993;87:363–372. doi: 10.1161/01.cir.87.2.363. [DOI] [PubMed] [Google Scholar]
- 34.Gonska BD, Cao K, Schaumann A, et al. Catheter ablation of ventricular tachycardia in 136 patients with coronary artery disease: results and long-term follow-up. J Am Coll Cardiol. 1994;24:1506–1514. doi: 10.1016/0735-1097(94)90147-3. [DOI] [PubMed] [Google Scholar]
- 35.Harada AD, Agostino HJJ, Schuessler RB, et al. Potential distribution mapping: new method for precise localization of intramural septal origin of ventricular tachycardia. Circulation. 1988;78:III-137–III-147. [PubMed] [Google Scholar]
- 36.Taccardi B, Macchi E, Lux RL, et al. Effect of myocardial fiber direction on epicardial potentials. Circulation. 1994;90:3076–3090. doi: 10.1161/01.cir.90.6.3076. [DOI] [PubMed] [Google Scholar]
- 37.Smeets JL, Ben-Haim SA, Rodriguez LM, et al. New method for nonfluoroscopic endocardial mapping in humans: accuracy assessment and first clinical results. Circulation. 1998;97:2426–2432. doi: 10.1161/01.cir.97.24.2426. [DOI] [PubMed] [Google Scholar]
- 38.Eldar M, Fitzpatrick AP, Ohad D, et al. Percutaneous multielectrode endocardial mapping during ventricular tachycardia in the swine model. Circulation. 1996;94:1125–1130. doi: 10.1161/01.cir.94.5.1125. [DOI] [PubMed] [Google Scholar]
- 39.Khoury DS, Taccardi B, Lux RL, et al. Reconstruction of endocardial potentials and activation sequences from intracavitary probe measurements: localization of pacing sites and effects of myocardial structure. Circulation. 1995;91:845–863. doi: 10.1161/01.cir.91.3.845. [DOI] [PubMed] [Google Scholar]
- 40.Liu ZW, Jia P, Ershler PR, et al. Noncontact endocardial mapping: reconstruction of electrograms and isochrones from intracavitary probe potentials. J Cardiovasc Electrophysiol. 1997;8:415–431. doi: 10.1111/j.1540-8167.1997.tb00807.x. [DOI] [PubMed] [Google Scholar]
- 41.Liu ZW, Jia P, Biblo LA, et al. Endocardial potential mapping from a noncontact nonexpandable catheter: a feasibility study. Ann Biomed Eng. 1998;26:994–1009. doi: 10.1114/1.32. [DOI] [PubMed] [Google Scholar]
- 42.Strickberger SA, Tokano T, Kluiwstra JU, et al. Extracardiac ablation of the canine atrioventricular junction by use of high-intensity focused ultrasound. Circulation. 1999;100:203–208. doi: 10.1161/01.cir.100.2.203. [DOI] [PubMed] [Google Scholar]
- 43.Messinger-Rapport BJ, Rudy Y. Noninvasive recovery of epicardial potentials in a realistic heart-torso geometry: normal sinus rhythm. Circ Res. 1990;66:1023–1039. doi: 10.1161/01.res.66.4.1023. [DOI] [PubMed] [Google Scholar]
- 44.Green LS, Taccardi B, Ershler PR, et al. Epicardial potential mapping: effects of conducting media on isopotential and isochrone distributions. Circulation. 1991;84:2513–2521. doi: 10.1161/01.cir.84.6.2513. [DOI] [PubMed] [Google Scholar]