

Abstract
Intracellular redox potential of skeletal muscle becomes progressively more oxidized with aging, negatively impacting regenerative ability. We examined the effects of oxidizing redox potential on terminal differentiation of cultured C2C12 myoblasts. Redox potentials were manipulated by changing the culture O2 environment, by free radical scavenging, or addition of H2O2. Intracellular reactive oxygen species (ROS) production was higher in 20% environmental O2 and in this condition, redox potential became progressively oxidized compared to cultures in 6% O2. Treatment with a ROS trapping agent (phenyl-N-tert-butylnitrone, PBN) caused reducing redox potentials and enhanced C2C12 differentiation, while addition of 25 μM H2O2 to cells in 20% O2 dramatically slowed differentiation. Under these most oxidative conditions, quantitative PCR showed a significant decrease in myogenic basic helix-loop-helix transcription factor expression compared to cultures treated with phenyl PBN or grown in 6% O2. Thus, oxidative intracellular environments impair myoblast differentiation, while reducing environments favor myogenesis.
Keywords: C2C12 myoblast, muscle aging, myoblast, myogenin, redox potential
Introduction
The resident stem cell population of adult skeletal muscle, the satellite cell, is the major source for replacing muscle lost as a consequence of overuse, disuse, or degenerative processes. Muscle repair is usually adequate through middle age, but by age 80, humans have lost about 40% of their muscle mass and more than 50% of their ability to generate power (Faulkner et al., 1995). Age-related muscle mass and functional loss is correlated generally with loss of reducing potential with age (Hazelton and Lang, 1985; Noy et al., 1985), reflected in increases in glutathione/glutathione disulfide (GSH/GSSG) ratio in tissues and plasma. GSH/GSSG is a redox couple of particular importance because, as the single largest cellular source of reducing equivalents (up to 90%) (Cotgreave and Gerdes, 1998), GSH serves as a reliable indicator of intracellular redox status (Schafer and Buettner, 2001). In parallel with decreased ratios of cytosolic GSH to GSSG in aged muscle, markers of oxidative damage increase in all cellular compartments. Aged human muscle accumulates increased levels of 8-hydroxy-2-deoxyguanosine, protein carbonyls and malondialdehyde, markers of oxidative damage to DNA, proteins and lipids, respectively (Mecocchi et al., 1999; Pansarasa et al., 2000). In summary, intracellular redox status in aged skeletal muscle shifts to a more oxidizing milieu, permitting local persistence of reactive oxygen species (ROS) (Hamilton et al., 2001) and progressive oxidative damage. Despite the central role of an oxidized environment in muscle aging, the differentiation patterns of myoblasts as a function of oxidative stress in the microenvironment have not been well described.
Redox status affects virtually all cellular processes including DNA synthesis, transcriptional activation, enzyme kinetics, and protein folding (Sen and Packer, 1996; Cotgreave and Gerdes, 1998) and trafficking (Pfau, et al., 2004). Differentiation processes, then, are inevitably impacted by redox potential changes. Intracellular redox status is dependent on the abundance of reduced partners of redox couples, particularly GSH. GSH is used directly in many of the biochemical reactions that mediate survival responses to oxidative stress. For example, under conditions of moderate oxidative stress a thiol group in the transcription factor NF kappa B undergoes a two-stage modification by H2O2 and a reaction requiring GSH. The resulting post-translational modification (S-glutathionylation) causes impaired NF kappa B DNA binding (Pineda-Molina et al., 2001). These and other studies point to H2O2 as a ubiquitous second messenger (Reynaert et al., 2006) during physiologic and pathologic conditions of oxidant stress.
In this study we focus on redox-regulated expression of the myogenic basic helix-loop-helix transcription factors (muscle regulatory factors; MRFs) that are the core regulators of skeletal muscle differentiation. Four MRFs (myf5, mrf4, MyoD, myogenin) constitute this family. Except for myf5 (Beauchamp et al, 2000) undifferentiated satellite cells do not express these factors. Activation of satellite cells for muscle regeneration is marked by expression of MRFs in a precisely coordinated temporal pattern (Yun and Wold, 1996). MyoD and myf5 are expressed early in muscle development and differentiation, and have overlapping functions (Rudnicki et al., 1992). Mrf4 is expressed transiently early in development and is also involved in terminal differentiation. Myogenin plays its role later in terminal muscle differentiation (reviewed in Berkes and Tapscott).
The C2C12 cell line is a standard model for the study of muscle differentiation (Yaffe and Saxel, 1977). These mononuclear myoblasts differentiate into fused, multinucleated myotubes over the course of a few days upon mitogen withdrawal, recapitulating developmental and regenerative myogenesis. Because intracellular redox status is increasingly recognized as an important regulator of transcriptional activation, our objective was to characterize C2C12 myogenesis under varied oxidizing and reducing conditions. These studies show that optimal skeletal muscle differentiation is promoted under reducing intracellular redox potentials and inhibited under more oxidizing redox potentials. Understanding redox-sensitivity in muscle differentiation is a potentially powerful approach for identifying new pathways and pharmacologic tools to enhance muscle regeneration, especially in the context of aging.
Materials and Methods
Materials
C2C12 cells were from American Type Cell Collection (Manassas, VA), and all sera from HyClone (Logan, UT). Mf20 antibody, developed by Donald A. Fischman, was from the Developmental Studies Hybridoma Bank developed under the auspices of the NICHD and maintained by the University of Iowa Department of Biological Sciences, Iowa City, IA 52242. 5-(and-6)-carboxy-2′, 7'- dichlorodihydrofluorescein diacetate (DCF) and Alexa 568 secondary antibodies were from Molecular Probes (Eugene, OR). All HPLC columns, equipment and software were from Waters (Milford, MA). DTPA, Hepes, PBN, and MSA were purchased from Sigma (St. Louis, MO). Vectashield with 4'-6-diamidino-2-phenylindole (DAPI) was purchased from Vector Labs (Burlingame, CA). Dulbecco's Modified Eagle's Medium (DMEM), glutamine and penicillin-streptomycin were from Life Technologies (Grand Island, NY). Modular incubators for lowered O2 culturing were from Billups-Rothenburg (Del Mar, CA) and cell manipulations were handled in a customized, gas-controlled hood (Coy Labs, Grass Lake, MI).
Animals
Young (6-7 months old) and aged (31-32 months old) CBA mice were purchased from the National Institute of Aging (NIA) breeding colony. Housing and handling of mice followed protocols approved by institutional IUCUC, and NIH guidelines.
Cell culture
C2C12 myoblasts were grown until confluence in growth medium (15% fetal bovine serum in DMEM containing 2 mM glutamine and antibiotics) then switched to differentiation medium (2% horse serum in DMEM containing 2 mM glutamine and antibiotics). The addition of differentiation medium is defined as the zero time-point in all experimental protocols. For culture in 6% O2, cells were placed into modular incubators after equilibration in a gas-controlled environment. CO2 was maintained at 5% for all experiments. Cultures maintained at 20% O2 were treated with either 1 mM PBN or 25 μM H2O2. All differentiation experiments were carried out for 72 hr.
DCF detection of ROS in cultured myoblasts
DCF was used to determine the production of reactive oxygen species, specifically the production of H2O2 (LeBel et al., 1992), using a modification of published protocols (Wang and Joseph, 1999). DCF (100 μM) was added to C2C12 cells in serum-free medium for 45 min. After washes with PBS, the cells were incubated in serum-containing medium at either 6% or 20% O2 for 24 hr. DCF fluorescence was measured using a Molecular Devices Gemini XS fluorometer (Sunnyvale, CA) at 488 nm (excitation) and 518 nm (emission). Data gathered from a total of 46-48 wells per condition are presented as relative fluorescence units (RFU)/well ± SEM, and differences between conditions were analyzed using Student's standardized t-tests.
High pressure liquid chromatography (HPLC) measurement of glutathione (GSH) and glutathione disulfide (GSSG) concentrations
At 0, 24, 48, or 72 hours of differentiation, C2C12 cells were collected in 200 mM methane sulfonic acid (MSA), snap-frozen in liquid N2, and stored at −70° C until HPLC derivitization and analysis. Similarly, hamstring muscle (including biceps femoirs, semitendinosus, semimembranosus) from young and aged CBA mice were dissected in PBS, frozen with liquid N2, pulverized, placed in 200 mM MSA and stored as described above until analysis. Glutathione concentration was determined using published protocols (Newton and Fahey, 1985; Harris, 1993). Sodium methanesulfonate (4 M) was added to homogenized samples to precipitate protein, followed by centrifugation at 13,900 rpm (about 12 g) for 5 min at 5° C. The resulting supernatants were split into two equal portions for GSH and GSSG analyses and GSH samples placed into 5 mM diethylenetriaminepentaacetic acid (DTPA) in 1 M HEPES (pH 8.5). Derivitization was carried out by the addition of 0.2 mM monobromobimane (thiolyte), followed by 20 min incubation in the dark at room temperature. Derivitization was terminated by the addition of 400 mM MSA, then the samples were snap-frozen in liquid N2, and stored at −70° C.
HPLC analyses were carried out using a Waters NovaPak C 4-mm Radial-Pak cartridge fitted with a NovaPak Guard-Pak guard pre-column. Samples were eluted using an isocratic mobile phase consisting of 14.2% methanol (v/v) and 2.5% glacial acetic acid (v/v) at a flow rate of 1.0 ml/min. Following elution of the GSH peak, the column was washed with 90% methanol (v/v) and 2.5% glacial acetic acid (v/v) for 15 min. Detection of GSH-bimane was accomplished using a Waters Model 470 scanning fluorescence detector (excitation 360 nm; emission 455 nm) followed by analysis and quantitation using a Waters Model 746 data module. Authentic standards were prepared and used to identify and quantify each peak of interest. This HPLC method accurately detects GSH and cysteine levels down to 10 pmol per 200 ml injection.
For GSSG analyses, samples were prepared as for GSH, except that GSSG supernatants were placed into 5 mM DPTA and 3.5 mM dithiothreitol (DTT) in 1 M HEPES (pH 8.5). Samples were incubated at 37° C for 30 min prior to derivitization with monobromobimane to reduce GSSG to GSH. Derivatization was then carried out by adding monobromobimane (2 mM) in acetonitrile for 20 min and terminated by addition of 400 mM MSA. Samples were stored at −70° C until HPLC analysis. Glutathione disulfide concentrations were determined by quantitation of the GSH peak, subtraction of prior GSH measurement above, and division by 2. Final concentrations were normalized to protein content (16). Cysteine (Cys) and cystine (CysS) detection was performed similarly, with cysteine standards used to quantify the sample HPLC peaks.
GSH and GSSG concentration differences in mouse muscle were analyzed by t-tests (SigmaStat 2.0, Jandel Scientific). Cell culture concentration differences were analyzed by one-way ANOVA (Tukey's posthoc test). Concentrations were considered significantly different if p<0.05.
Calculation of intracellular redox potential
The Nernst equation was adapted to calculate intracellular redox status using GSH and GSSG concentrations (Sen and Packer, 1996; Kirlin et al., 1999) as follows:
where Eo is the standard potential of GSH (−0.24 mV), R is the gas constant (8.31 J/ deg mol), T is the absolute temperature (298° K), n is the number of electrons transferred (two), and F is the Faraday constant (96,406 J/ V). Redox potentials are presented as mean millivolts (mV) ± SEM, and differences between conditions were analyzed using one-way ANOVA.
Immunocytochemistry
Anti-myosin heavy chain immunoreactivity was used as one criterion of terminal muscle differentiation. Cultures were fixed in methanol:acetone (1:1), dried overnight, and then rehydrated with PBS. Cells were blocked using 10% donkey serum in PBS for 30 minutes, then incubated with Mf20 mouse monoclonal antibody (1:5 dilution in PBS) against myosin heavy chain (MHC) for 2 hr at room temperature, followed by three PBS washes. Secondary goat anti-mouse Alexa 568 antibody was incubated for 45 min. After washes, cells were mounted in Vectashield containing 4',6-Diamidino-2-phenylindole (DAPI), from Vector Labs, Burlingame CA. Differentiation was quantified using fluorescence microscopy. C2C12 cells were counted as differentiated if they were MHC-positive and incorporated into a myotube with ≥ 3 nuclei (Kim et al., 1998). The percentage of differentiated cells is presented as mean ± SEM, and differences between groups were analyzed using one-way ANOVA.
Western blotting
Cells were collected in protein extraction reagent (Pierce, Rockford IL) with phosphatase and protease inhibitors, then stored at −80°C until assayed. Protein concentration was determined using the Bradford method (Bradford, 1976). Sixty μg total protein was loaded per well on 12% agarose gels (Bio-Rad, Hercules CA). Proteins were transferred to nitrocellulose membranes (Amersham, Piscataway NJ), then the membranes blocked with TBS + 5% nonfat milk and 0.1% Tween-20 for 2 hr at room temperature. All antibodies: rabbit polyclonal α-activated caspase-3, mouse monoclonal α-p38 mitogen-activated protein kinase (MAPK), and α-phospho-p38 MAPK (Cell Signaling Technology, Boston, MA) were incubated overnight at 4°C at a dilution of 1:1000. After TBS-T washes, membranes were incubated with the appropriate secondary antibodies: Goat α-rabbit IgG conjugated to horse radish peroxidase (1:3000) for activated caspase-3 or goat α-mouse IgG conjugated to horse radish peroxidase (1:3000) for MAPKs in 5% nonfat milk for 1 hr at room temperature, then washed again. The reaction was developed using chemiluminescence (ECL, Amersham, Piscataway NJ).
Quantitation of bHLH gene expression
Cultures were washed with PBS, and total RNA isolated using RNeasy (Qiagen, Valencia, CA). Reverse transcription of RNA was performed with M-MLV RT using 1 μg of RNA, 40 mM dithiothreitol, 0.5 mM dNTPs, 10 U RNAase inhibitor, and 200 ng random primers (all reagents from Promega, Madison WI). The reaction was incubated for 1 hr at 37°C.
Primers for myf-5, MyoD, MRF-4 and myogenin were from published protocols (Cornelison and Wold, 1997). β-actin PCR was used as an internal control (forward primer: 5'-TCACCCACACTGTGCCCATGTACGA-3'; reverse primer 5'-CCTACGGTGTT-CTAA GGTATGGGT-3').
Real-time PCR was performed using a LightCycler and the LightCycler FastStart DNA Master SYBR Green I kit (Roche, Indianapolis, IN). Reactions using 50 ng of cDNA from each condition included a preincubation (95°C for 5 min), 45 amplification cycles, and melting curve analysis for verification of specific product. Products were also run on 2% agarose gels to verify size. The myf-5 amplification cycle used annealing at 57°C for 7 sec and elongation at 72°C for 14 sec. The MyoD amplification cycle used annealing at 64°C for 7 sec and elongation at 72°C for 16 sec. The MRF-4 amplification cycle used annealing at 57°C for 7 sec and elongation at 72°C for 14 sec. The myogenin amplification cycle used annealing at 59°C for 7 sec and elongation at 72°C for 14 sec. The β-actin amplification cycle used annealing at 60°C for 7 sec and elongation at 72°C for 21 sec.
Results
Young vs. aged mouse muscle
Glutathione concentrations in young mouse muscle (41.4 pmoles GSH/ μg protein ± 4.49) were higher but not significantly so (p=0.054) than GSH concentrations in old mouse muscle (33.4 pmoles GSH/ μg protein ± 5.01) (Figure 1). Absolute GSSG concentrations were not statistically different as a consequence of age. However, GSH:GSSG ratios, which define the overall redox potentials, did differ significantly (p<0.001). In young mouse muscle, GSH:GSSG ratios were 25.1 ± 5.28 but significantly more oxidized at 4.7 ± 0.73 in old muscle.
Figure 1.
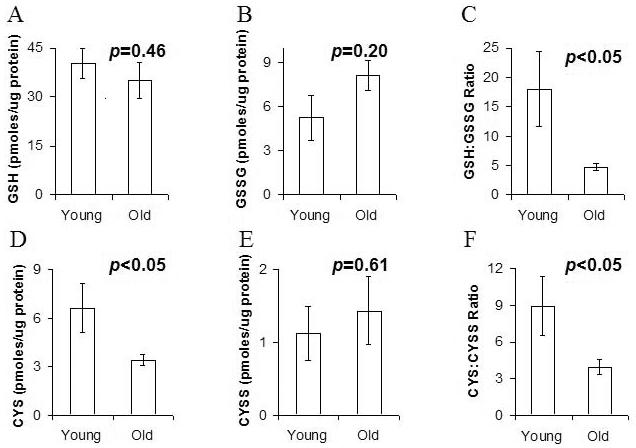
GSH:GSSG and cysteine:cystine ratios in young vs. aged murine hamstring
GSH concentration was not significantly different in young vs. aged muscle (A) and GSSG was also similar in the two groups (B). However, reducing potential, indicated by GSH:GSSG ratio was significantly lower in old muscle (C). Similarly cysteine was less abundant in aged muscle (D) cystine levels were similar (E), and the ratio of cysteine: cystine was significantly lower in aged muscle (F). These data support significant loss of reducing potential in aged vs. young skeletal muscle.
To further describe the oxidative state of muscle with aging, the cysteine:cystine ratio was also measured. GSH prevents cysteine oxidation but age-related changes in the Cys/CysS ratio have not been reported in muscle. Our data indicate that the Cys/CysS ratio is more oxidized with aging in murine muscle, as has recently been reported for human plasma (Jones et al., 2002).
Reactive oxygen species and redox potentials in differentiating C2C12 myoblasts
After only 24 hr in 6% O2, C2C12 cells contained significantly less ROS, as assessed by DCF fluorescence, compared to traditional 20% O2 culture conditions: 5.79 ± 0.14 vs. 7.85 ± 0.31 RFU/ well (n=48, p <0.001).
Redox potential of differentiating myoblasts as a function of oxygen, peroxide, or free radical scavenging
The redox potential patterns of differentiating C2C12 cells are shown in Figure 2. In general, myoblasts cultured in 20% O2 showed progressively oxidized redox potentials over 72 hr, whereas myoblasts cultured in 6% O2 maintained quite constant redox potential. Interestingly, the addition of 1 mM PBN resulted in a significant decrease in redox potential at 24 hr when compared to all other samples, but at the 72 hr time point was similar to that in the 6% O2 conditions. The addition of an exogenous source of ROS to culture media (25 μM H2O2) significantly exacerbated the progressively more positive (oxidized) redox potential seen in 20% O2 conditions.
Figure 2.
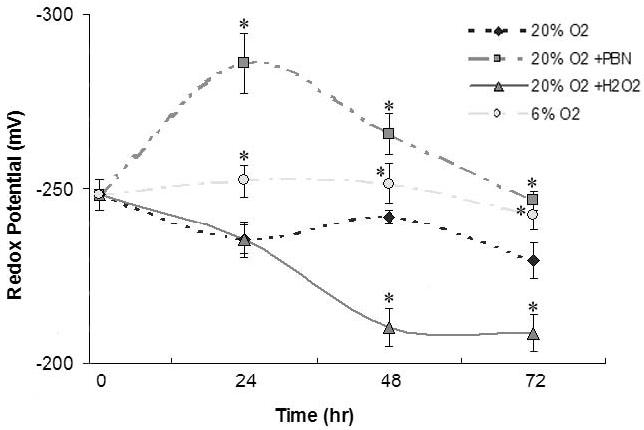
Redox potential of differentiating C2C12 myoblasts as a function of environmental O2 and ROS
Intracellular redox potential was calculated using the Nernst equation, with HPLC-derived concentrations of GSH and GSSH. Cultures grown in 6% O2 (circles) maintained stable redox potentials, but those in 20% O2 (small diamonds) gradually became more positive (oxidized) during differentiation. Treatment with the free radical trap PBN resulted in transient, significantly reduced redox potentials (squares), but H2O2 treatment mediated a significant sustained oxidizing redox potential (triangles) when compared to cultures in 20% O2. Data are presented as mean millivolts (mV) ± SEM. Asterisks (*) denote statistically significant differences (p<0.05) from 20% O2 conditions.
Quantitation of muscle differentiation as a function of redox potential
C2C12 differentiation was assessed by counting multinucleated myotubes immunoreactive for MHC. The kinetics of differentiation of C2C12 in 20% O2 is well known, and these cultures behaved typically with 43.9% (± 2.2; n=15) of nuclei incorporated into MHC-positive myotubes after 72 hr (Figures 3 and 4). At all assayed times, significantly more C2C12 cells differentiated in 6% O2 than in 20% O2, and at 72 hr 60.0% (± 2.6; n=15) of nuclei were incorporated into myotubes in 6% O2 (p<0.05, compared to 20%) (Figures 3 and 4). Cultures treated with PBN also showed enhanced differentiation when compared with traditional 20% O2 culture conditions, with significantly more myotube formation at all times analyzed (p<0.05). At 24 hr, 11.5% (± 3.9) of PBN-treated cells were myotubes vs. 5.3% (± 1.4) in 20% O2 cultures (n=20, p<0.05), indicating earlier differentiation in ROS-scavenged conditions. Cultures treated with H2O2 showed markedly diminished differentiation, which was statistically significant at all times when compared to other culture conditions: After 72 hr, only 25.1% (± 2.7) of nuclei in the H2O2 group were in differentiated myotubes (n=15, p<0.05) (Figures 3 and 4).
Figure 3.
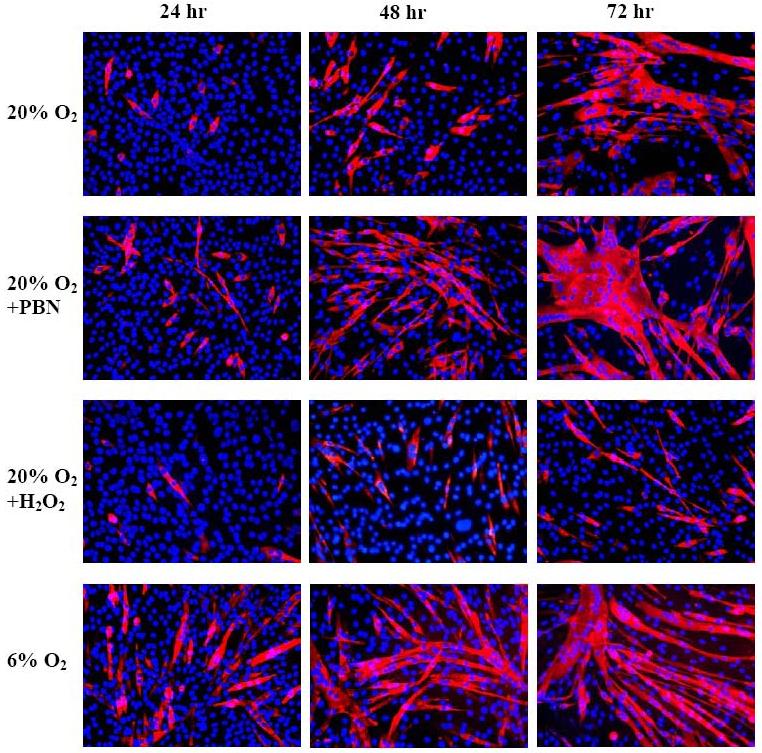
Myosin heavy chain immunohistochemistry to mark differentiating myotubes as a function of redox conditions
Myosin heavy chain detection with mf20 antibody (red) illustrates the patterns of morphologic differentiation in 20% O2, 20% O2 with 1 mM PBN, 20% O2 with 25 μM H2O2, or 6% O2. Cultures treated with PBN or in 6% O2 contained more myotubes than cultures in 20% O2, and terminal differentiation was obviously impaired in H2O2-treated cultures. DAPI (blue) stains nucleic acid.
Figure 4.
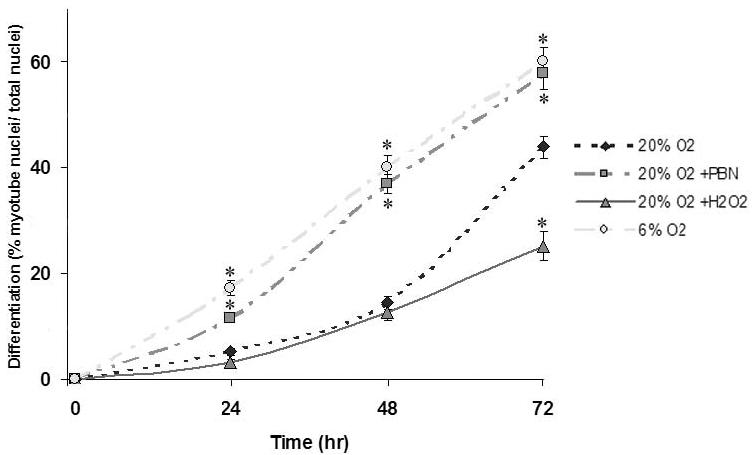
Quantitative analysis of C2C12 differentiation into myotubes as a function of redox conditions
Differentiated cells are defined as myotubes (≥ 3 nuclei) immunoreactive to anti-myosin heavy chain antibody. Data are presented as the percentage of nuclei in differentiated cells per total nuclei (± SEM). Asterisks (*) denote statistically significant differences from 20% O2 conditions (p<0.05).
Myogenic bHLH gene expression as a function of redox potential
Using real-time fluorescence quantitative PCR, expression patterns for the four myogenic bHLH transcription factors were assessed during differentiation in high vs. low oxidative stress conditions. Fold differences were determined by comparison with β-actin message abundance. β-actin expression was unaffected by culture conditions. Cultures maintained in 6% O2 showed a 1.9- and 1.5-fold increase in myf-5 and MRF-4 expression, compared to cells grown in 20% O2. Similar increases in myf-5 and MRF-4 expression were observed in cultures treated with PBN. Conversely, cultures treated with H2O2 showed approximately 2.7- and 3.7-fold less gene expression than cultures at 20% O2 for myf-5 and MRF-4, respectively. In 6% O2 and in PBN treated cultures, myogenin expression was not markedly different from that at 20% O2, but myogenin expression was dramatically decreased by 60-fold with H2O2 treatment. Expression patterns of MyoD were not affected by any treatment or culture condition. Alterations in myogenic bHLH factors gene expression are summarized in Table 1. Melting curve analysis and product electrophoresis confirmed amplification of the product of interest (not shown).
Table 1.
Myogenic gene expression in differentiating C2C12 cells as a function of redox conditions
Quantitative real-time PCR was performed on RNA collected after 72 hr of differentiation. Data are expressed as fold-difference relative to results from cells maintained in 20% O2. Asterisks (*) denote a statistically significant (p<0.05) expression difference, compared to 20% O2 conditions.
| Treatment/Condition | |||
|---|---|---|---|
| Gene | 6% O2 | 20% O2 +1 mM PBN |
20% O2 + 25 μM H2O2 |
| Myf-5 | +1.9 ± 0.6* | +2.2 ± 0.8* | −2.7 ± 1.7* |
| MyoD | +0.3 ± 0.6 | −0.2 ± 0.4 | +0.2 ± 0.3 |
| Myogenin | −0.2 ± 0.5 | +2.1 ± 1.2 | −60.1 ± 12.4* |
| MRF-4 | +1.5 ± 0.4* | +1.9 ± 0.5* | −3.7 ± 0.8* |
Regulation of p38 MAPK and activation of caspase-3 as a function of redox potential manipulations
Western blotting was used to quantify the amounts of p38 MAPK and activated phosphorylated p38, since p38 promotes muscle differentiation (reviewed in Keren, et al., 2006). In addition, to determine whether cells were diverted from differentiation by apoptosis, we screened for apoptosis using western blotting with an antibody specific for the activated form of caspase-3 (Figure 5). P38 was most abundant prior to differentiation, but only unphosphorylated p38 was detectable then. Differentiation in all conditions was associated with detectable phosphorylated p38, with no apparent differences in the absolute amount in the various conditions. At 24 hr, the percentage of phosphorylated p38 in the total pool appeared lowest in cells treated with H2O2 and those in 6% O2. At 48 hr cells treated with H2O2 appeared to have the lowest percentage of phosphorylated p38. At 72 hours, no differences between the groups were apparent. We also saw no significant differences in the amount of activated caspase-3 as a function of oxygen, PBN, or H2O2.
Figure 5.
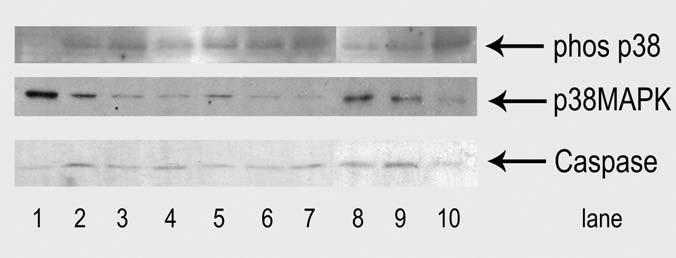
Western blotting to determine abundance of total p38 MAPK and its phosphorylated form, and activated caspase-3.
Lane 1: Before differentiation. Lanes 2-4: C2C12 cells grown in 6% O2 at days 1, 2, and 3 of differentiation. Lanes 5-7: 20% O2 at days 1,2, and 3 of differentiation. Lanes 8-10: 20% O2 + H2O2 at days 1, 2, and 3 of differentiation. Total p38 was most abundant before differentiation, but differentiation resulted in increased phosphorylated p38 in all conditions. Over the three day time course, H2O2 treated cells appeared to have the lowest ratio of phosphorylated p38 to total, but the absolute differences between conditions were small. All bands were imaged at their expected molecular weights: p38 at 38 kD, phosphorylated p38 at 40 kD, activated caspase-3 at 19 kD.
Discussion
Cysteine is a precursor for GSH, the limiting amino acid in GSH synthesis. GSH:GSSG is increasingly recognized to be a major factor in the overall redox balance of the cell, and so was the focus of this investigation. Progression through terminal differentiation (with loss of mitotic capacity) has been associated with depletion of GSH and an increase in GSSG (Balin and Allen, 1989), implying that differentiating cells usually increase redox potential (become more oxidative) during the transition from a proliferative state to a differentiated phenotype. For example, vascular smooth muscle differentiation is promoted by a variety of treatments that increase the oxidative state of cells through p38 MAPK-dependent pathways (Su et al., 2001).
The reported general cellular bias to execute differentiation as a function of increased oxidative conditions is not supported by data presented here for differentiating C2C12 myoblasts. To the contrary, maintenance of a low redox potential and a reducing redox environment correlated with an increase in C2C12 muscle differentiation. Perturbations that resulted in more positive redox potentials (more oxidative) of C2C12 cells significantly slowed their differentiation, and these morphologic observations were supported by changes in expression of the myogenic bHLH transcription factors.
Thus, these data suggest that the pattern of redox potential changes during differentiation is dependent on the particular lineage undergoing differentiation, and that redox-regulated genes may be one factor in determining lineage selection. For example, the data here and related work in primary myoblasts and mesenchymal stem cell lines (Csete et al, 2001; Lee et al, 2006) show that muscle differentiation is promoted by a reducing redox environment. In contrast, an oxidized redox environment promotes adipogenic differentiation (Takahashi and Zeydel, 1982; Csete et al, 2001). Furthermore, the shifts in glutathione (GSH) and glutathione disulfide (GSSG) as a function of adipogenic differentiation are opposite those shown here for muscle differentiation (Takahashi and Zeydel, 1982). Thus, it may be possible to manipulate the redox conditions of pluripotent cells to promote one of these fates over another. In the clinical setting, the oxidized muscle environment of aging is associated with increased adipogenic potential of myoblasts (Taylor-Jones et al., 2002).
Expression of myogenic bHLH genes appears to be regulated in part by redox conditions. In our experiments, myf5 expression was considerably lower in oxidative conditions, but MyoD expression was unchanged, suggesting that early muscle differentiation events may not be as redox-sensitive as later regenerative events. Myogenin expression was most sensitive to redox conditions in our studies. In other studies, silencing of myogenin has been associated with defective terminal muscle differentiation (Dedieu et al., 2002) similar to that seen in our H2O2-treated C2C12 cells. In both cases, ‘early’ bHLH genes were unable to functionally compensate for loss of myogenin expression at higher redox potentials. We did not see significant changes in p38 signaling as a function of redox conditions, which is somewhat inconsistent with the known role of p38 in promoting muscle differentiation (Keren et al, 2006). However, the first time point assessed was at 24 hours into differentiation and the peak signaling may have been missed. In addition, p38 promotes muscle differentiation in part by interacting early in differentiation with the myogenic bHLH genes, particularly Myf5, and again the peak activity may have been missed in our assay.
Though this study focuses on differentiation, other basic aspects of muscle stem cell biology are altered by oxygen and redox shifts in the culture environment. Proliferation of primary rodent myoblasts (Chakravarthy et al., 2001) and murine satellite cells (Csete et al., 2001) is increased in 6% O2 vs. 20% O2. However, we found that proliferation of C2C12 cells is the same in both these conditions (not shown), likely due to their transformed state. Cultured myoblasts from antioxidant deleted mice have a lower threshold for apoptosis in culture compared to wild type myoblasts (Lee et al., 2006), but apoptosis was not significantly affected by the redox manipulations in C2C12 cells, which again may be due to their transformed state.
In summary, these data emphasize that manipulations of the oxygen microenvironment or the intracellular redox potential can have profound effects on muscle differentiation. In order to further characterize the role of redox regulation in muscle differentiation, global measures of redox potential must be accompanied by more precise measures of the quantity and quality of intracellular oxidants. These measurements are the focus of ongoing work.
Acknowledgements
This research was supported by the Institute of Gerontology, University of Michigan, Contract grant T32 AG00114-17 (jh), and the National Institute on Aging, Contract grant PO1 AG20591 (mc) and the Emory Anesthesiology Department.
Footnotes
Publisher's Disclaimer: This is a PDF file of an unedited manuscript that has been accepted for publication. As a service to our customers we are providing this early version of the manuscript. The manuscript will undergo copyediting, typesetting, and review of the resulting proof before it is published in its final citable form. Please note that during the production process errors may be discovered which could affect the content, and all legal disclaimers that apply to the journal pertain.
References
- Balin AK, Allen RG. Molecular bases of biologic aging. Clinics in Geriatric Medicine. 1989;5(1):1–21. [PubMed] [Google Scholar]
- Beauchamp JR, Heslop L, Yu DS, Tajbakhsh S, Kelly RG, Wernig A, Buckingham ME, Partridge TA, Zammit PS. Expression of CD34 and Myf5 defines the majority of quiescent adult skeletal muscle satellite cells. Journal of Cell Biology. 2000;151(6):1221–1234. doi: 10.1083/jcb.151.6.1221. [DOI] [PMC free article] [PubMed] [Google Scholar]
- Berkes CA, Tapscott SJ. MyoD and the transcriptional role of myogenesis. Seminars in Cell Biology. 2005;16(45):585–595. doi: 10.1016/j.semcdb.2005.07.006. [DOI] [PubMed] [Google Scholar]
- Bradford MM. A rapid and sensitive method for the quantitation of microgram quantities of protein utilizing the principle of protein-dye binding. Analytical Biochemistry. 1976;72:248–254. doi: 10.1016/0003-2697(76)90527-3. [DOI] [PubMed] [Google Scholar]
- Chakravarthy MV, Spangenburg EE, Booth FW. Culture in low levels of oxygen enhances in vitro proliferation potential of satellite cells from old skeletal muscles. Cellular and Molecular Life Sciences. 2001;58(8):1150–1158. doi: 10.1007/PL00000929. [DOI] [PMC free article] [PubMed] [Google Scholar]
- Cornelison DDW, Wold BJ. Single-cell analysis of regulatory gene expression in quiescent and activated mouse skeletal muscle satellite cells. Developmental Biology. 1997;191(2):270–283. doi: 10.1006/dbio.1997.8721. [DOI] [PubMed] [Google Scholar]
- Cotgreave IA, Gerdes RG. Recent trends in glutathione biochemistry--glutathione-protein interactions: a molecular link between oxidative stress and cell proliferation? Biochemical and Biophysical Research Communications. 1998;242(1):1–9. doi: 10.1006/bbrc.1997.7812. [DOI] [PubMed] [Google Scholar]
- Csete M, Walikonis J, Slawny N, Wei Y, Korsnes S, Doyle JC, Wold B. Oxygen-mediated regulation of skeletal muscle satellite cell proliferation and adipogenesis in culture. Journal of Cellular Physiology. 2001;189(2):189–196. doi: 10.1002/jcp.10016. [DOI] [PubMed] [Google Scholar]
- Dedieu S, Mazeres G, Cottin P, Brustis JJ. Involvement of myogenic regulator factors during fusion in the cell line C2C12. International Journal of Developmental Biology. 2002;46(2):235–241. [PubMed] [Google Scholar]
- Faulkner JA, Brooks SV, Zerba E. Muscle atrophy and weakness with aging: contraction-induced injury as an underlying mechanism. Journal of Gerontology. 1995;A 50:124–129. doi: 10.1093/gerona/50a.special_issue.124. [DOI] [PubMed] [Google Scholar]
- Hamilton ML, Van Remmen H, Drake JA, Yang H, Guo ZM, Kewitt K, Walter CA, Richardson A. Does oxidative damage to DNA increase with age? Proceedings of the National Academy of Sciences USA. 2001;98(18):10469–10474. doi: 10.1073/pnas.171202698. [DOI] [PMC free article] [PubMed] [Google Scholar]
- Harris C. Glutathione biosynthesis in the postimplantation rat conceptus in vitro. Toxicology and Applied Pharmacology. 1993;120(2):247–256. doi: 10.1006/taap.1993.1109. [DOI] [PubMed] [Google Scholar]
- Hazelton GA, Lang CA. Glutathione peroxidase and reductase activities in the aging mouse. Mechanisms of Ageing and Development. 1985;29(1):71–81. doi: 10.1016/0047-6374(85)90048-x. [DOI] [PubMed] [Google Scholar]
- Jones DP, Mody VC, Jr., Carlson JL, Lynn MJ, Sternberg P., Jr. Redox analysis of human plasma allows separation of pro-oxidant events of aging from decline in antioxidant defenses. Free Radical Biology & Medicine. 2002;33(9):1290–1300. doi: 10.1016/s0891-5849(02)01040-7. [DOI] [PubMed] [Google Scholar]
- Keren A, Tamir Y, Bengal E. The p38 MAPK signaling pathway: a major regulator of skeletal muscle development. Molecular and Cellular Endocrinology. 2006;252(12):224–230. doi: 10.1016/j.mce.2006.03.017. [DOI] [PubMed] [Google Scholar]
- Kim SS, Rhee S, Lee KH, Kim JH, Kim HS, Kang MS, Chung CH. Inhibitors of the proteasome block the myogenic differentiation of rat L6 myoblasts. FEBS Letters. 1998;433(12):47–50. doi: 10.1016/s0014-5793(98)00883-7. [DOI] [PubMed] [Google Scholar]
- Kirlin WG, Cai J, Thompson SA, Diaz D, Kavanagh TJ, Jones DP. Glutathione redox potential in response to differentiation and enzyme inducers. Free Radical Biology & Medicine. 1999;27(1112):1208–1218. doi: 10.1016/s0891-5849(99)00145-8. [DOI] [PubMed] [Google Scholar]
- LeBel CP, Ischiropoulos H, Bondy SC. Evaluation of the probe 2', 7'-dichlorofluorescein as an indicator of reactive oxygen species formation and oxidative stress. Chemical Research in Toxicology. 1992;5(2):227–231. doi: 10.1021/tx00026a012. [DOI] [PubMed] [Google Scholar]
- Lee S, Shin HS, Shireman PK, Vasilaki A, Van Remmen H, Csete M. Glutathione-peroxidase-1 null muscle progenitor cells are globally defective. Free Radical Biology & Medicine. 2006;41(7):1174–1184. doi: 10.1016/j.freeradbiomed.2006.07.005. [DOI] [PubMed] [Google Scholar]
- Mecocci P, Fano G, Fulle S, MacGarvey U, Shinobu L, Polidori MC, Cherubini A, Vecchiet J, Senin U, Beal MF. Age-dependent increases in oxidative damage to DNA, lipids and proteins in human skeletal muscle. Free Radical Biology & Medicine. 1999;26(34):303–308. doi: 10.1016/s0891-5849(98)00208-1. [DOI] [PubMed] [Google Scholar]
- Newton GL, Fahey RC. Determination of biothiols by bromobimane labeling and high-performance liquid chromatography. Methods in Enzymology. 1985;251:148–166. doi: 10.1016/0076-6879(95)51118-0. [DOI] [PubMed] [Google Scholar]
- Noy N, Schwartz H, Gafni A. Age-related changes in the redox status of rat muscle cells and their role in enzyme-aging. Mechanisms of Ageing and Development. 1985;29(1):63–69. doi: 10.1016/0047-6374(85)90047-8. [DOI] [PubMed] [Google Scholar]
- Pansarasa O, Castagna L, Colombi B, Vecchiet J, Felzani G, Marzatico F. Age and sex differences in human skeletal muscle: role of reactive oxygen species. Free Radical Research. 2000;33(3):287–293. doi: 10.1080/10715760000301451. [DOI] [PubMed] [Google Scholar]
- Pfau JC, Schneider JC, Archer AJ, Sentissi J, Leyva FJ, Cramton J. Environmental oxygen tension affects phenotype in cultured bone marrow-derived macrophages. American Journal of Physiology Lung Cellular and Molecular Physiology. 2004;286(2):L354–L362. doi: 10.1152/ajplung.00380.2002. [DOI] [PubMed] [Google Scholar]
- Pineda-Molina E, Klatt P, Vazquez J, Marina A, Garcia de Lacoba M, Perez-Sala D, Lamas S. Glutathionylation of the p5- subunit of NF-κB: a Mechanism for redox-induced inhibition of DNA binding. Biochemistry. 2001;40(47):14134–14142. doi: 10.1021/bi011459o. [DOI] [PubMed] [Google Scholar]
- Reynaert NL, van der Vliet A, Guala AS, McGovern T, Hristova M, Pantano C, Heintz NH, Heim J, Ho YS, Matthews DE, Wouters EF, Janssen-Heininger YM. Dynamic redox control of NK-kappaB through glutaredoxin-regulated S-glutathionylation of inhibitory kappB kinase beta. Proceedings of the National Academy of Sciences. 2006;103(35):13086–13091. doi: 10.1073/pnas.0603290103. [DOI] [PMC free article] [PubMed] [Google Scholar]
- Rudnicki MA, Braun T, Hinuma S, Jaenisch R. Inactivation of MyoD in mice leads to up-regulation of the myogenic HLH gene Myf-5 and results in apparently normal muscle development. Cell. 1992;71(3):383–390. doi: 10.1016/0092-8674(92)90508-a. [DOI] [PubMed] [Google Scholar]
- Schafer FQ, Buettner GR. Redox environment of the cell as viewed through the redox state of the glutathione disulfide/glutathione couple. Free Radical Biology & Medicine. 2001;30(1):1191–1212. doi: 10.1016/s0891-5849(01)00480-4. [DOI] [PubMed] [Google Scholar]
- Sen CK, Packer L. Antioxidant and redox regulation of gene transcription FASEB Journal. 1996;10(7):709–720. doi: 10.1096/fasebj.10.7.8635688. [DOI] [PubMed] [Google Scholar]
- Su B, Mitra S, Gregg H, Flavahan S, Chotani MA, Clark KR, Goldschmidt-Clermont PJ, Flavahan NA. Redox regulation of vascular smooth muscle cell differentiation. Circulation Research. 2001;89(1):39–46. doi: 10.1161/hh1301.093615. [DOI] [PubMed] [Google Scholar]
- Takahashi S, Zeydel M. Gamma-glutamyl transpeptidase and glutathione in aging IMR-90 fibroblasts and in differentiating 3T3 L1 preadipocytes. Archives of Biochemistry and Biophysics. 1982;214(1):260–267. doi: 10.1016/0003-9861(82)90029-7. [DOI] [PubMed] [Google Scholar]
- Taylor-Jones JM, McGehee RE, Rando TA, Lecka-Czernik B, Lipschitz DA, Peterson CA. Activation of an adipogenic program in adult myoblasts with age. Mechanisms of Ageing and Development. 2002;123(6):649–661. doi: 10.1016/s0047-6374(01)00411-0. [DOI] [PubMed] [Google Scholar]
- Wang H, Joseph JA. Quantifying cellular oxidative stress by dichlorofluorescein assay using microplate reader. Free Radical Biology & Medicine. 1999;27(56):612–616. doi: 10.1016/s0891-5849(99)00107-0. [DOI] [PubMed] [Google Scholar]
- Yaffe D, Saxel O. A myogenic cell line with altered serum requirements for differentiation. Differentiation. 1977;7(3):159–166. doi: 10.1111/j.1432-0436.1977.tb01507.x. [DOI] [PubMed] [Google Scholar]
- Yun K, Wold B. Skeletal muscle determination and differentiation: story of a core regulatory network and its context. Current Opinion in Cell Biology. 1996;8(6):877–889. doi: 10.1016/s0955-0674(96)80091-3. [DOI] [PubMed] [Google Scholar]