

Abstract
Purpose
To investigate optical coherence tomography (OCT) measurements of retinal nerve fiber layer (RNFL) thickness change associated with elevated intraocular pressure (IOP) over a period of time, and to compare in vivo OCT RNFL thickness measurments with morphologic measurements of the same tissues.
Methods
One eye of each of 12 cynomolgus monkeys was treated with argon laser to the anterior chamber angle to induce elevated IOP. OCT measurements were made weekly in the treated and the contralateral eyes of each monkey for 14 weeks after the laser insult. The monkeys were killed at the conclusion of the experiment, and comparisons were made between the terminal OCT RNFL measurements and quantitative histomorphometric assessments in the same eyes. Effects of exposure to elevated IOP on RNFL were characterized by a mixed-effects model. Linear mixed-effects models provided unbiased analysis of balanced and unbalanced repeated-measures data, detection of group effects (fixed effects), and individual subject effects (random effects), thereby making the best use of all available data.
Results
Increased IOP was achieved in 10 eyes. Exposure to high IOP was associated with the loss of mean RNFL thickness at a median rate of 3.77 ± 0.08 μm/wk. On average, OCT RNFL thickness measurements were higher than histomorphologic measurements by 5.7 μm (95% confidence interval, 3.6 –7.8; P = 0.003).
Conclusions
Thinning of the RNFL associated with elevated IOP was demonstrated with OCT in a group of experimentally glaucomatous monkey eyes over a period. OCT measurements corresponded with histomorphometric measurements of the same tissues.
Primary open-angle glaucoma (POAG) is a multifactorial optic neuropathy in which there is a characteristic acquired loss of retinal ganglion cells and atrophy of the optic nerve.1 Specifically, the glaucomatous eye may have diffuse or focal narrowing or notching of the optic nerve head (ONH) neuro-retinal rim and diffuse or localized abnormalities in the retinal nerve fiber layer (RNFL), especially in the inferior and superior ONH poles.1 The progression, and often the development, of glaucoma is associated with elevated intraocular pressure (IOP).2-4
Optical coherence tomography (OCT) is a technology capable of producing high-resolution optical cross-sections of the retina, providing quantitative measurement of the thickness of the circumpapillary RNFL, the macular retinal thickness, and the ONH morphology.5-8 It is likely that longitudinal quantitative assessment of RNFL thickness may be a good indicator of glaucomatous damage and, therefore, may be useful in the diagnosis and management of glaucoma.9,10 We hypothesize that the OCT is capable of accurately detecting RNFL loss associated with glaucoma. The purpose of the present study was to use a primate model of glaucoma to ascertain the ability of OCT to detect thinning of the RNFL in response to exposure to elevated IOP and to assess the accuracy of those OCT measurements by confirming them with direct histomorpho-metric measurements of the RNFL.
Methods
Retinal nerve fiber layer thickness was assessed in 24 eyes of 12 young cynomolgus monkeys (Macaca fascicularis), each weighing 2.5 to 4.5 kg, for 14 weeks. One eye of each of 12 monkeys underwent argon laser to the trabecular meshwork to induce an elevation of IOP; the fellow eye served as control. After 14 weeks, histologic measurements of RNFL thickness were measured in six eyes of five monkeys. All procedures used in this study were performed in accordance with the ARVO Statement for the Use of Animals in Ophthalmic and Vision Research.
For all experimental sessions, animals were anesthetized with intramuscular injection of 20 mg/kg ketamine HCl, with repeated injections of 10 mg/kg ketamine as needed. A retrobulbar block consisting of 0.5 mL of 2% lidocaine was administered to reduce eye movements. The pupils were dilated with topical application of phenylephrine HCl (5%), tropicamide (0.5%), and cyclopentolate (1%). Each monkey's head was secured in a mount that consisted of a flexible neck-ring held by a pair of three-finger clamps that permitted elevation and rotation. The monkey head-mount provided a stable platform for ophthalmoscopic and OCT examinations.
Baseline Examination
The RNFL and ONH were evaluated by slit lamp biomicroscopy. IOP was taken as the average of three measurements performed by pneumotonometry (Modular One; Mentor, Norwell, MA). Each pneumotonometry measurement included a tracing to ensure that ocular pulsations were seen. The monkeys underwent OCT retinal scanning. The OCT beam was positioned around the optic disk by adjusting head mount and slit lamp positions.
Induction of Glaucoma
Elevation of IOP by laser ablation of the trabecular meshwork has been described.11-13 Briefly, glaucoma was induced by krypton laser (Omni Novus; Coherent, Palo Alto, CA) applications to the mid–trabecular meshwork in one randomly selected eye of each animal, applied in a single session. If no IOP increase was noted within 7 days, the procedure was repeated. The contralateral eye was maintained as a control. Laser parameters were as follows: yellow-green light (521 to 531 to 568 nm); 50° to 90° burns over 360°, 1000 mW power, 1-second duration, 50-μm spot size. Laser parameters were adjusted to obtain a visible reaction in the trabecular meshwork, most often a bubble formation. For laser exposure the animals were comfortably held with the head mount described. In case of significant inflammatory reaction (e.g., anterior chamber fibrin), the eyes were topically treated with prednisolone acetate 1% until resolution of the inflammation.
Follow-up Examinations and Tissue Preparation
To avoid bias, no inclusion or exclusion criteria were used in the selection of histologic sample eyes. The first six available treated glaucoma eyes were used. After laser treatment, IOP and RNFL thicknesses were measured, as described, weekly for 14 weeks. At the end of follow-up, the monkeys were enucleated under deep pentobarbital anesthesia and then killed with intracardiac injection of 0.5 mL/kg euthanasia solution (Beuthanasia; Schering Laboratories, Kenilworth, NJ). Silk sutures were placed, one in the superior rectus muscle and two at the medial rectus, to facilitate orientation for histologic processing. After enucleation, eyes were immediately placed in 10% neutral buffered formalin (monosodium phosphate in dibasic sodium phosphate) at pH 7.2 to 7.4 and were fixed for more than 48 hours. All segments were processed for paraffin sectioning except two halves of posterior segment sections of two eyes, which were reserved for frozen sectioning. Freezing resulted in tissue destruction, making the samples unusable for quantitative histomorphometric analysis. These two sections were excluded from further analysis. In the remaining samples, the posterior segment was cut in half from 12 o'clock to 6 o'clock through the center of the optic nerve head so that the posterior segment was divided into temporal and nasal portions. Serial 6-μm thick sections of the retina and ONH were vertically taken from the center of the ONH to the peripheral retina. Sections were then stained with hematoxylin and eosin.
OCT Technology
OCT was performed with a prototype system described previously.5,6 In brief, the device was a low-coherence interferometer that used a superluminescent diode light source operating at 840 nm to measure the thickness of optically reflective intraocular structures. Each OCT image consisted of 100 A-scan profiles of optical reflectivity of the scanned tissue that were acquired in a total of 2.5 seconds. The axial resolution of the system was 10 μm. Although this system did not scan as rapidly as the currently commercially available OCT device (StratusOCT; Carl Zeiss Meditec Inc., Dublin, CA), the physical principles and the axial resolution of the device were essentially the same.
Image and Data Processing
Cross-sectional imaging was performed in a circumpapillary fashion, with a circle diameter of 2.4 mm centered on the ONH. Each scan was repeated three times per session. Artificial tears were used to maintain corneal moisture. The machine automatically calculated the NFL thickness for each A-scan, and the data were exported to an electronic spreadsheet. Peripapillary RNFL thicknesses were identified in each individual A-scan, as averages over each quadrant (superior, inferior, temporal, nasal), and as an overall average.
Histomorphometric Measurement of RNFL Thickness
OCT A-scans were oriented in a circle with a diameter of 2.4 mm centered on the optic disk. With 100 OCT A-scans equally spaced, the distance between each A-scan was 3.6°. Therefore, any tissue location contained in an OCT scan was readily described in polar coordinates by slice and distance from center. To precisely locate and histomorphometrically measure the tissue analyzed in an OCT slice, tissue locations were transformed to Cartesian coordinates by the formulas y′ = sine (location of A-scan in radians) × R and x′ = cosine (location of A-scan radians) × R, where y′ was the distance from an OCT A-scan profile to the x-axis and x′ was the distance from the OCT A-scan profile to the y-axis (Fig. 1). R was the radius, the distance from an OCT A-scan profile to the center of the ONH. The measured section that matched an OCT A-scan profile with x′ was calculated by the formula as follows: section no. = x′/section thickness.
Figure 1.
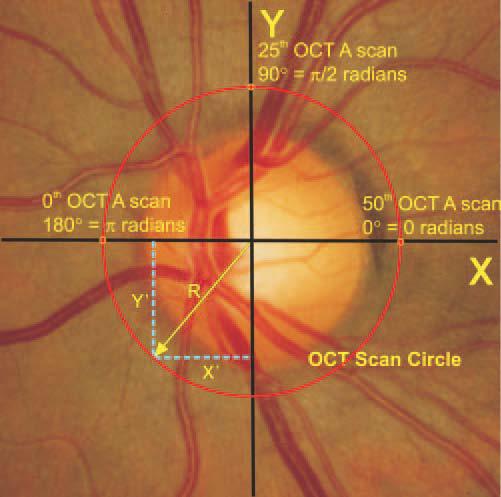
Schematic diagram of optical coherence tomography scan location and calculation of histologic slice coordinates.
A computerized image analysis system (Image ProPlus; Media Cybernetics, Silver Spring, MD) was used to measure RNFL thickness in the histologic preparation. A CCD camera connected the computer image analysis system and the light microscope (BH 2; Olympus, Tokyo, Japan) with a total magnification of 100×. The system digitized and stored images of sections. Digitized images were shown on the computer video display for RNFL measurement.
In the measured section, the distance between both side margins of the ONH in a histologic section was first measured. Then the y′ line was measured to obtain the histologic position that matched the OCT A-scan profile. Once the proper orientation was determined, the histologic RNFL thickness was measured along a vertical line from the innermost surface of the ganglion cell layer to the internal limiting membrane of the retina.14,15 Histomorphometric measurements were performed by experienced ophthalmologists in a masked fashion, without prior knowledge of the OCT-measured RNFL thickness. To correct for shrinkage artifact caused by processing the tissue with formalin fixation, dehydration, and paraffin embedding, 15% of the measured RNFL thickness value was added to the measured histologic RNFL thickness. This value has previously been shown to be a conservative estimate of tissue shrinkage with our method of tissue processing.15,16 Corrected histologic RNFL thicknesses are reported.
Statistical Analysis
Laser ablation of the trabecular meshwork was not expected to achieve the same level of IOP elevation in all the animals. Because of this, an analysis of the effect of the number of days since laser treatment would not be comparable between the different animals. Therefore, to assess the effects of exposure to elevated IOP, including both IOP level and the amount of time exposed to elevated IOP, an integral combining IOP and time was calculated.17 The “integrate.xy” function from the sfsmisc package of R statistical programming language18 was implemented, using a trapezoidal method to plot IOP over time and to calculate the integral.
Linear mixed-effects models provide unbiased analysis of balanced and unbalanced repeated-measures data, detection of group effects (fixed effects), and individual subject effects (random effects), thereby making the best use of all available data. This study was accomplished in two identical experiments (A and B). The effect of the actual experiment in which each monkey participated was included in the model. The effects of exposure to elevated IOP on NFL were characterized by a linear mixed effects model, as:
with the mean thickness difference in microns (treatment versus control) for the ith subject at day t denoted by NFL Difit, the integral of intraocular pressure difference (treatment versus control) for the ith subject up to and including day t denoted by IOPInt Difit, and Exper. The fixed (population-averaged) effects are: the intercept β0, the mean slope for IOP integral difference β1, the magnitude of the change in intercept as a function of the experiment (A vs. B) β2, and the change in the IOP integral difference slope as a function of experiment (A vs. B) β3. The random effects are: the intercept for ith monkey bi0 assumed to be normally distributed with mean zero and SD σ0 and the slope for IOP integral difference for ith monkey bi1 assumed to be normally distributed with mean zero and SD σ1. bi0 and bi1 are assumed to be statistically independent. The random error component for the ith subject at day t is εit and is assumed to be normally distributed with a mean of zero and SD σ and uncorrelated with bi0, bi1, IOPInt Dif, and Exper. Linear mixed-effects analysis uses the method of maximum likelihood to estimate the fixed-effect parameters and the standard deviations for the random effects and the random error. Note that the IOP term in the mixed-effects model is an integral (IOPInt) equal to intraocular pressure in millimeters of mercury multiplied by exposure time in days; exposure time was represented by the number of days after laser ablation of the trabecular meshwork. The same model was used to characterize the effects of exposure to elevated IOP on each quadrant.
Histomorphometric measurements were compared with OCT measurements of RNFL thickness, obtained at the final OCT session using Bland-Altman analysis.19 The Bland-Altman plot presents the difference between measurements as a function of the average of the measurements as obtained from different devices. P < 0.05 was considered statistically significant.
Results
IOP Response
We studied 24 eyes (12 treated and 12 control) of 12 monkeys. Two of the 12 treated eyes of two monkeys were excluded from the analysis: one eye needed four treatment sessions to reach constantly elevated pressures; this eye developed excessive anterior uveitis and posterior synechiae despite topical prednisolone acetate treatment, which did not allow good-quality scanning. The other eye failed to develop elevated IOP within 28 days after the second treatment. All post–laser surgery NFL analysis was omitted for these two animals (treated and control eyes). Baseline IOPs were 17.8 ± 3.4 mm Hg in the experimental glaucoma eyes and 19.2 ± 4.0 mm Hg in the control eyes (P = NS). Mean RNFL thickness at baseline was 102.3 ± 9.0 μm in control eyes and 100.6 ± 9.4 μm in experimental eyes (P = NS).
Effects of Experimental Primate Glaucoma
A gradual increase in the optic nerve head cupping was noted after the laser procedure in all experimental eyes (Fig. 2).
Figure 2.
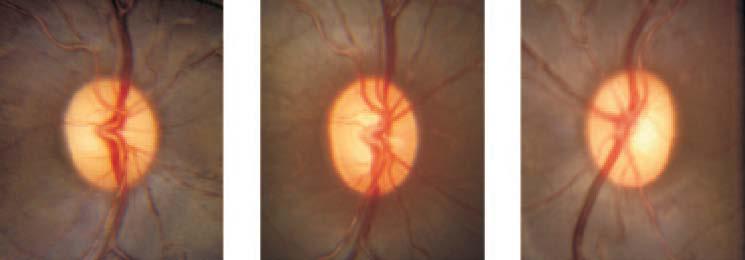
Optic nerve head photographs of experimental eye at baseline (left) and final follow-up (center) and the control eye at final follow-up (right) from a representative monkey. Enlargement of the optic nerve cupping was clearly evident in the experimental eye compared with baseline and control. The baseline optical coherence tomography RNFL thickness measurement in the experimentally glaucomatous eye was 117 μm, and the final RNFL thickness in this eye was 43 μm. Final RNFL thickness in the control eye was 114 μm.
Baseline and post–laser ablation IOP and mean RNFL thickness in experimental and control eyes are shown in Figures 3 and 4. RNFL thickness by quadrant in the experimental and control groups is shown in Figures 5 to 8.
Figure 3.
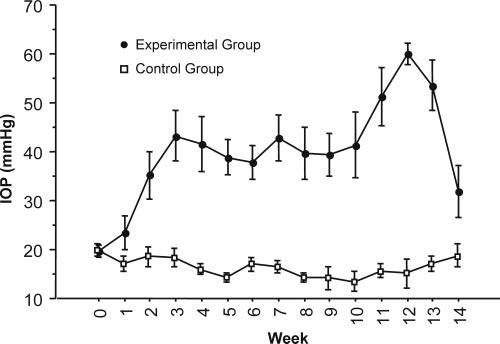
Average intraocular pressure in experimental eyes increased after trabecular meshwork laser ablation but was maintained in control eyes.
Figure 4.
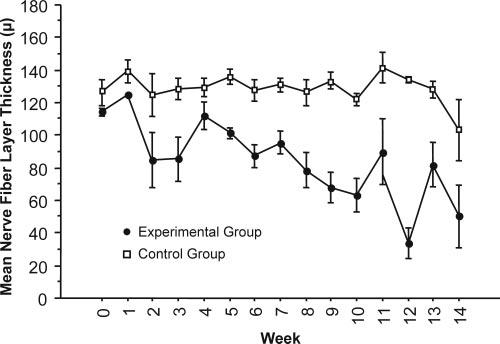
Average mean RNFL thickness decreased in experimental eyes and was maintained in control eyes after IOP elevation.
Figure 5.
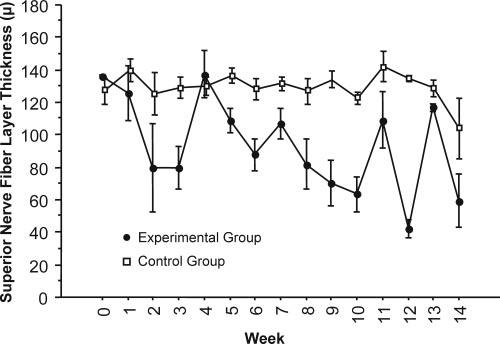
Average superior RNFL thickness decreased in experimental eyes and was maintained in control eyes after IOP elevation.
Figure 8.

Average temporal RNFL thickness decreased in experimental eyes and was maintained in control eyes after IOP elevation.
Mean RNFL thickness was constant in control eyes, but in experimental glaucoma eyes it was reduced at a median rate of 3.77 ± 0.08 μm/wk, as determined with the mixed-effects model (Fig. 4).
Analysis of the Relationship between RNFL Thickness and IOP Exposure
Mean RNFL thickness and IOP exposure (integral of IOP after experimental glaucoma induction) for each experimental and control eye and for the entire study group are plotted in Figure 9. The positive slope in IOP exposure (+) in the control eyes indicates the cumulative effect of the stable IOP over time. Exposure to an elevated IOP is represented by the steeper slope of the IOP exposure plot in the experimental eyes.
Figure 9.

Exposure to normal IOP is observed as a small positive slope representing the passage of time at normal IOP levels. Exposure to elevated IOP is represented by a large positive slope indicating the same passage of time, but at a higher IOP. Exposure to IOP (+) and mean nerve fiber layer (°) in control eyes (ct) and eyes after laser ablation of the trabecular meshwork (ex). Laser ablation was performed on day 0.
IOP Exposure Difference and RNFL Thickness Difference
The difference in RNFL thickness between experimental and control eyes was plotted against IOP exposure, as represented by the difference in IOP time exposure integral between eyes (Fig. 10). The rate of RNFL loss was lower in monkeys that were included in experiment group A (upper plots) than in those included in experiment group B (middle plots). The slope of the plots was negative, indicating that as RNFL loss progressed in the experimental eye, the difference between the control and the experimental eye became more pronounced (P = 0.0003).
Figure 10.
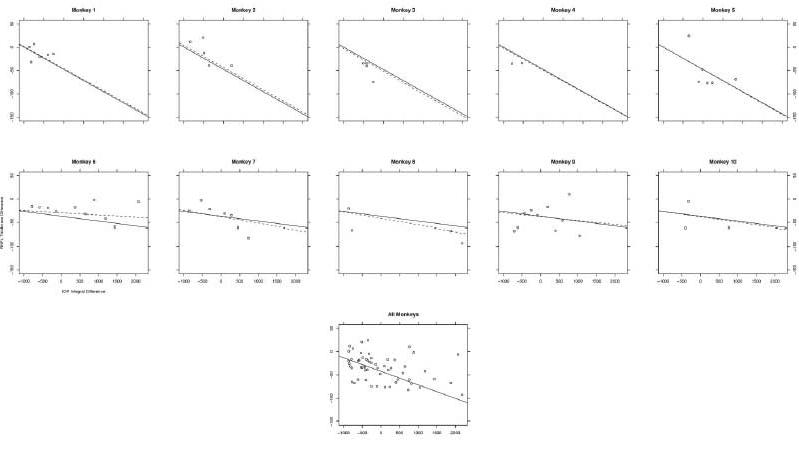
Difference in mean nerve fiber layer thickness between experimental and control eyes, calculated as experimental RNFL – control RNFL, as dependent on the difference in IOP between experimental and control eyes. The solid line is a best-fit line for the entire experimental group, described by the model as the fixed effect. The dashed line is a best-fit line for the individual animal, and it displays the magnitude of influence that each specific monkey (random effect) had on the overall or fixed effects. The “all monkeys” graph displays the association between IOP exposure and RNFL loss for all animals pooled from experiments A and B. As the experimental eye lost RNFL, the difference became increasingly negative, indicating that greater exposure to IOP was associated with a thinner RNFL.
OCT versus Histomorphometry
Six hundred sixty-four histology sections were obtained from the retinas of four experimentally glaucomatous monkey eyes and one healthy monkey eye (Fig. 11). Nine hundred eighty-two histomorphometric measurements were performed on these sections. Bland-Altman plots for each of five eyes are shown in Figure 12. On average, OCT RNFL thickness measurements were higher than histomorphometric measurements by 5.69 μm (95% confidence interval, 3.6–7.8; P = 0.003).
Figure 11.
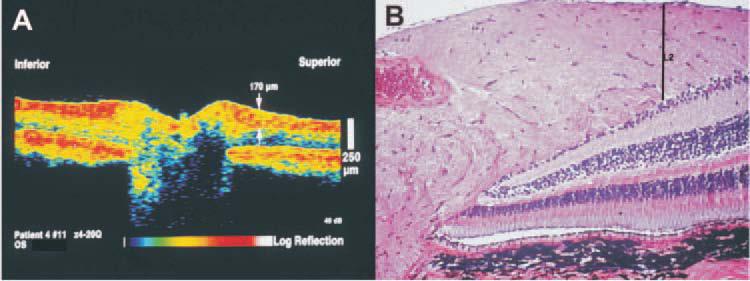
(A) OCT image of a control monkey eye. The arrow indicates the location of the RNFL thickness measurement of 170 μm at a single measuring point out of the 100 points obtained in each OCT circumpapillary scan. (B) Histologic section of the same eye; the line labeled L2 indicates the same tissue location measured in the OCT. Scale bars, 250 μm.
Figure 12.
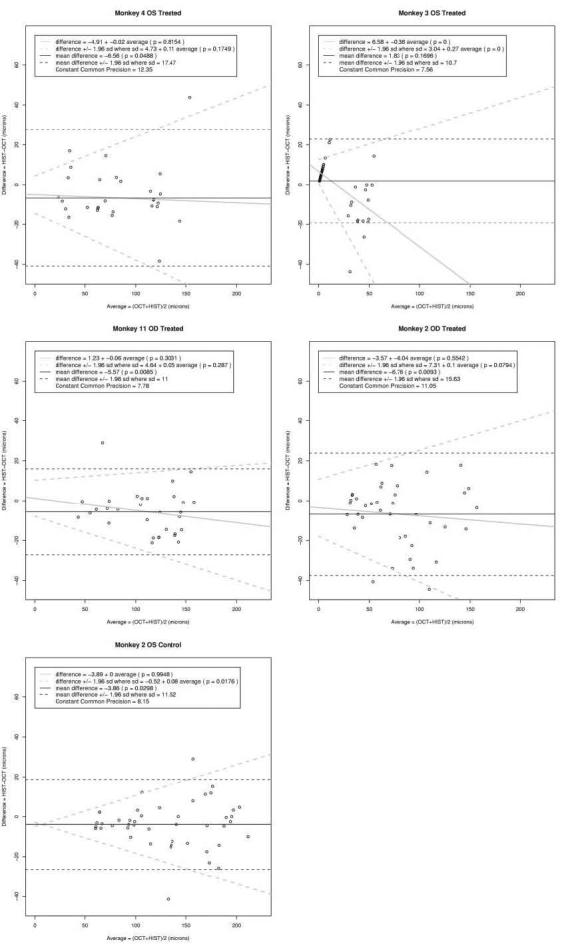
Bland-Altman analysis of the difference between the histomophometric and OCT paired measurements. The black dashed agreement lines assume a constant difference and constant imprecision with level. The solid black line denotes a constant difference. The gray dashed agreement lines allow for a linear trend in the difference and for an increasing imprecision. The gray solid line indicates the change in the difference with level.
Except for those of monkey 3, all eyes showed a higher difference between histomorphometric and OCT measurements with increased thickness of the retina. Excluding monkey 3 measurements, given that they appear to be outliers, the imprecision increased linearly by 0.085 μm for every 1 μm increase in the true measurement with an intercept of 4.04 μm. For true RNFL thicknesses of 50, 100, and 200 μm, the imprecision was 8.3, 12.5, and 21.0 μm, respectively.
Discussion
This study was designed to investigate our hypothesis that OCT could accurately measure and track RNFL thickness associated with elevated IOP over a period of 14 weeks. Our study is the first to record, with the use of OCT, in vivo RNFL thickness reduction in the primate experimental glaucoma model and the agreement between these measurements and histomorphometric measurements.
Longitudinal Evaluation of Glaucoma Using Imaging Devices
RNFL thinning as a result of elevated IOP in primate model of glaucoma has been previously shown ex vivo by histology.20,21 Shimazawa et al.21 used a similar monkey glaucoma model to demonstrate ONH change over time using confocal scanning laser ophthalmoscopy (Heidelberg retina tomograph [HRT]). They reported significant cupping and glaucomalike changes in 7 of 8 global HRT ONH parameters. Wollstein et al.22 used OCT to observe glaucoma patients and reported a higher likelihood of progression as detected with OCT in comparison with visual field.
IOP Effects
IOP gradually increased during the first 3 weeks after laser ablation of the trabecular meshwork (Fig. 3). This time lag between laser and IOP elevation has been observed in other studies making use of this model of laser-induced glaucoma. In a similar model, Shimazawa et al.21 observed significant increases in IOP 2 weeks after laser ablation of the trabecular meshwork in monkeys, which persisted for 12 to 16 weeks.
Retinal Nerve Fiber Layer Thickness Effects
Mean RNFL thickness remained relatively unchanged in the control eye throughout the 14 weeks of follow-up, but the response to exposure to elevated IOP in the experimental eyes varied widely throughout the group, with an overall trend of NFL thinning at the rate of 3.77 μm/wk (Figs. 4, 9). This finding is similar to clinical experience with the management of elevated IOP. Specifically, some eyes appeared to be robust in their ability to maintain NFL thickness when challenged by exposure to elevated IOP (Fig. 8; monkeys 4, 9, 10), whereas others experienced rapid degeneration when presented with similar exposure to elevated IOP (monkeys 5, 7, 8).
RNFL thickness appeared to be increased in the first week after laser insult. It is possible that the increase resulted from measurement fluctuation because the increase was also observed in the control eye. It is also possible that inflammation associated with laser ablation resulted in detectable changes in RNFL thickness.
OCT and Histomorphometry
It is paramount to determine whether RNFL measurements acquired by OCT in fact reflect the actual RNFL thickness and whether these measurements correspond to histologic RNFL thickness. This study confirms the accuracy of measurements of RNFL thickness in vivo by OCT compared with histology. We previously reported that OCT RNFL thickness corresponded to the RNFL thickness measured histologically, but this was only in a single postmortem human eye.23 In the present study, we also showed that exposure to elevated IOP (induced by laser to the anterior chamber angle) produced statistically significant thinning of the RNFL observable by OCT.
In our quantitative comparative study, overall mean OCT RNFL thickness was thicker than histomorphometric measurements by 5.69 μm (P = 0.003; Fig. 11). The most pronounced difference between histomorphometric and OCT measurement was observed in the severely glaucomatous monkey (Fig. 11; monkey 3). It should be noted that thicknesses less than 10 μm were recognized as 0 μm by this version of OCT. On the other hand, when RNFL was replaced by glial tissue, the OCT provided a measure as if RNFL was present, but that measure corresponded to the replacement gliosis.
Limitations of the Present Study
The study is limited by the use of an in vivo animal model of ocular hypertension. The application of laser burns in the trabecular meshwork of the study animals had a varying effect on IOP. In some cases, laser treatment had to be repeated for the desired level of ocular hypertension to be obtained. Even if a uniform level of IOP elevation had been achieved, the susceptibility of the RNFL to ocular hypertension would have been expected to vary between different primates, as it does in humans. Although this approach cannot demonstrate the effect of specific levels of IOP elevation on the RNFL under precisely controlled conditions, it is a good model of conditions clinically observed, specifically of a variety of levels of IOP elevation on different eyes. Nevertheless, this limitation is apparent in differences in the graphs of IOP level in the various test animals (Fig. 9). In spite of this limitation and the resultant scatter in the data, RNFL thickness and IOP were stable in the control eyes, and IOP increased and RNFL thickness decreased in the experimental eyes.
A fixed OCT scanning circle size was used for all eyes regardless of refractive error. This introduced some small errors between monkey eyes when matching tissue locations to OCT scans for histomorphometric validation of the OCT scans because of differences in ocular axial length. However, the OCT measurements and histomorphometric RNFL thickness measurements were in good agreement without need of additional correction. It can be expected, therefore, that the use of additional correction may further improve the agreement between the measurements; however, the present study was designed to determine whether RNFL thickness measured by OCT corresponded with histomorphometric RNFL thickness measurements. Although it is highly improbable and not supported by the histology, it cannot be excluded that the thin RNFL measurements by OCT were partially caused by RNFL compression from elevated IOP in addition to pathologic RNFL loss. The lack of longitudinal histomorphometric comparison between healthy and experimentally glaucomatous eyes is a limitation of this study, though our design did allow comparisons of multiple RNFL thicknesses between OCT and histomorphometric measures in one control and four experimentally glaucomatous eyes.
Histomorphometric RNFL thickness measurements were obtained from a single healthy eye. The study was designed for comparison of OCT and histomorphometric measurements, not for comparison of histomorphometric measurements, between healthy and experimentally glaucomatous eyes. Caution should be exercised when comparing our histomorphometric RNFL thickness measurements between healthy and glaucomatous eyes.
We used a “shrinkage factor” to correct for tissue shrinkage during histologic preparation. However, the correction was made only for measurements of RNFL thickness, in the z direction, though shrinkage occurred in all directions. The lack of a correction in the lateral direction is a source of alignment error in the comparison of the histologic sections with the OCT slices. Although the factor used in the z direction is the one recommended in the literature, we cannot verify that this was the optimal setting.
Another potential shortcoming is that these data were collected with a prototype OCT device. However, the axial resolution and the physical properties of the prototype and the commercial devices are similar. Thus, our finding that OCT is capable of accurately measuring and tracking RNFL thickness over time can be expected to be valid with the current iteration of this technology.
Finally, because of logistical difficulties associated with primate studies, not all measurements were obtained at every study session. Nevertheless, the existing data demonstrate the significant effect of IOP elevation on RNFL loss.
In summary, our animal study suggests that OCT is an accurate method to objectively measure RNFL thickness in healthy and glaucomatous primate eyes and that it has the ability to track changes over time.
Figure 6.
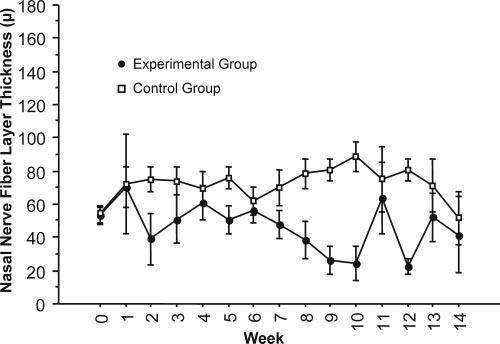
Average nasal RNFL thickness decreased in experimental eyes and was maintained in control eyes after IOP elevation.
Figure 7.
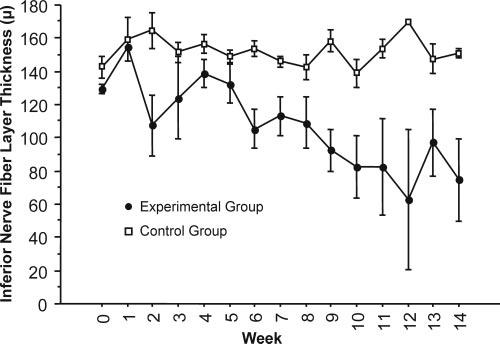
Average inferior RNFL thickness decreased in experimental eyes and was maintained in control eyes after IOP elevation.
Acknowledgments
Supported in part by National Institutes of Health Grants R01-EY013178–6, RO1-EY11289–20, and P30-EY008098; National Science Foundation Grant BES-0522845; Air Force Office of Scientific Research and Medical Free Electron Laser Program Contract FA9550–040-1–0046; unrestricted grants from Research to Prevent Blindness, Inc.; an unrestricted grant from Allergan, Inc.; an unrestricted grant from Carl Zeiss Meditec, Inc.; and the Eye and Ear Foundation (Pittsburgh, PA).
Footnotes
Presented in part at the annual meeting of the Association for Research in Vision and Ophthalmology, Fort Lauderdale, Florida, April 1997, April 1998, and April 2000.
Disclosure: J.S. Schuman, Carl Zeiss Meditec, Inc. (P); T. PedutKloizman, None; H. Pakter, None; N. Wang, None; V. Guedes, None; L. Huang, None; L. Pieroth, None; W. Scott, None; M.R. Hee, None; J.G. Fujimoto, Carl Zeiss Meditec, Inc. (P); H. Ishikawa, None; R.A. Bilonick, None; L. Kagemann, None; G. Wollstein, None
References
- 1.American Academy of Ophthalmology . Preferred Practice Pattern: Primary Open-Angle Glaucoma. American Academy of Ophthalmology; San Francisco: 2003. pp. 1–40. [Google Scholar]
- 2.Bengtsson B, Heijl A. A long-term prospective study of risk factors for glaucomatous visual field loss in patients with ocular hypertension. J Glaucoma. 2005;14:135–138. doi: 10.1097/01.ijg.0000151683.04410.f3. [DOI] [PubMed] [Google Scholar]
- 3.Guo L, Moss SE, Alexander RA, Ali RR, Fitzke FW, Cordeiro MF. Retinal ganglion cell apoptosis in glaucoma is related to intraocular pressure and IOP-induced effects on extracellular matrix. Invest Ophthalmol Vis Sci. 2005;46:175–182. doi: 10.1167/iovs.04-0832. [DOI] [PMC free article] [PubMed] [Google Scholar]
- 4.Morrison JC, Johnson EC, Cepurna W, Jia L. Understanding mechanisms of pressure-induced optic nerve damage. Prog Retin Eye Res. 2005;24:217–240. doi: 10.1016/j.preteyeres.2004.08.003. [DOI] [PubMed] [Google Scholar]
- 5.Schuman JS, Hee MR, Arya AV, et al. Optical coherence tomography: a new tool for glaucoma diagnosis. Curr Opin Ophthalmol. 1995;6:89–95. doi: 10.1097/00055735-199504000-00014. [DOI] [PubMed] [Google Scholar]
- 6.Schuman JS, Pedut-Kloizman T, Hertzmark E, et al. Reproducibility of nerve fiber layer thickness measurements using optical coherence tomography. Ophthalmology. 1996;103:1889–1898. doi: 10.1016/s0161-6420(96)30410-7. [DOI] [PMC free article] [PubMed] [Google Scholar]
- 7.Wang M, Luo R, Liu Y. Optical coherence tomography and its application in ophthalmology. Yan Ke Xue Bao. 1998;14:116–120. 115. [PubMed] [Google Scholar]
- 8.Pieroth L, Schuman JS, Hertzmark E, et al. Evaluation of focal defects of the nerve fiber layer using optical coherence tomography. Ophthalmology. 1999;106:570–579. doi: 10.1016/s0161-6420(99)90118-5. [DOI] [PMC free article] [PubMed] [Google Scholar]
- 9.Leung CK, Chan WM, Yung WH, et al. Comparison of macular and peripapillary measurements for the detection of glaucoma: an optical coherence tomography study. Ophthalmology. 2005;112:391–400. doi: 10.1016/j.ophtha.2004.10.020. [DOI] [PubMed] [Google Scholar]
- 10.Wollstein G, Ishikawa H, Wang J, Beaton SA, Schuman JS. Comparison of three optical coherence tomography scanning areas for detection of glaucomatous damage. Am J Ophthalmol. 2005;139:39–43. doi: 10.1016/j.ajo.2004.08.036. [DOI] [PubMed] [Google Scholar]
- 11.Gaasterland D, Kupfer C. Experimental glaucoma in the rhesus monkey. Invest Ophthalmol. 1974;13:455–457. [PubMed] [Google Scholar]
- 12.Quigley HA, Hohman RM. Laser energy levels for trabecular mesh-work damage in the primate eye. Invest Ophthalmol Vis Sci. 1983;24:1305–1307. [PubMed] [Google Scholar]
- 13.Quigley HA. Experimental glaucoma damage mechanism. Arch Ophthalmol. 1983;101:1301–1302. doi: 10.1001/archopht.1983.01040020303031. [DOI] [PubMed] [Google Scholar]
- 14.Quigley HA, Addicks EM. Quantitative studies of retinal nerve fiber layer defects. Arch Ophthalmol. 1982;100:807–814. doi: 10.1001/archopht.1982.01030030811018. [DOI] [PubMed] [Google Scholar]
- 15.Varma R, Skaf M, Barron E. Retinal nerve fiber layer thickness in normal human eyes. Ophthalmology. 1996;103:2114–2119. doi: 10.1016/s0161-6420(96)30381-3. [DOI] [PubMed] [Google Scholar]
- 16.Bloom G, Friberg U. Shrinkage during fixation and embedding of histological specimens. Acta Morphol Neerl Scand. 1;1:12–20. [PubMed] [Google Scholar]
- 17.Chauhan BC, Pan J, Archibald ML, LeVatte TL, Kelly ME, Tremblay F. Effect of intraocular pressure on optic disc topography, electro-retinography, and axonal loss in a chronic pressure-induced rat model of optic nerve damage. Invest Ophthalmol Vis Sci. 2002;43:2969–2976. [PubMed] [Google Scholar]
- 18.The R Project for Statistical Computing. Lucent Technologies, formerly AT&T; 2006. Available at: http://www.r-project.org/ Last accessed: April 29, 2007. [Google Scholar]
- 19.Bland JM, Altman DG. Statistical methods for assessing agreement between two methods of clinical measurement. Lancet. 1986;1:307–310. [PubMed] [Google Scholar]
- 20.Hayreh SS, Pe'er J, Zimmerman MB. Morphologic changes in chronic high-pressure experimental glaucoma in rhesus monkeys. J Glaucoma. 1999;8:56–71. [PubMed] [Google Scholar]
- 21.Shimazawa M, Tomita G, Taniguchi T, et al. Morphometric evaluation of changes with time in optic disc structure and thickness of retinal nerve fibre layer in chronic ocular hypertensive monkeys. Exp Eye Res. 2006;82:427–440. doi: 10.1016/j.exer.2005.08.001. [DOI] [PubMed] [Google Scholar]
- 22.Wollstein G, Schuman JS, Price LL, et al. Optical coherence tomography longitudinal evaluation of retinal nerve fiber layer thickness in glaucoma. Arch Ophthalmol. 2005;123:464–470. doi: 10.1001/archopht.123.4.464. [DOI] [PMC free article] [PubMed] [Google Scholar]
- 23.Huang D, Swanson EA, Lin CP, et al. Optical coherence tomography. Science. 1991;254:1178–1181. doi: 10.1126/science.1957169. [DOI] [PMC free article] [PubMed] [Google Scholar]