

Abstract
High amphiphilicity is a hallmark of interfacial helices in membrane proteins and membrane-active peptides, such as toxins and antimicrobial peptides. Although there is general agreement that amphiphilicity is important for membrane-interface binding, an unanswered question is its importance relative to simple hydrophobicity-driven partitioning. We have examined this fundamental question using measurements of the interfacial partitioning of a family of seventeen-residue amidated-acetylated peptides into both neutral and anionic lipid vesicles. Composed only of Ala, Leu, and Gln residues, the amino acid sequences of the peptides were varied to change peptide amphiphilicity without changing total hydrophobicity. We found that peptide helicity in water and interface increased linearly with hydrophobic moment, as did the favorable peptide partitioning free energy. This observation provides simple tools for designing amphipathic helical peptides. Finally, our results show that helical amphiphilicity is far more important for interfacial binding than simple hydrophobicity.
Keywords: antimicrobial peptides, toxins, membrane proteins, peptide secondary structure, hydrophobic moment
The amphipathic (or amphiphilic) helix is an important structural motif in proteins. Its most common representation shows polar residues along the length of one-half of a helix surface and non-polar residues along the opposite surface (Figure 1). This polar-nonpolar asymmetry, characterized mathematically by the so-called hydrophobic moment1 (μH), makes the amphipathic helix ideally suited for binding to membrane interfaces with the polar surface facing the aqueous phase and the less polar surface facing the membrane interior. This arrangement is often seen in membrane proteins2,3 where amphipathic helices apparently provide structural stability. But they are also important functionally. For example, amphipathic helices play important functional roles in both ligand-gated4 (Figure 1) and voltage-gated K+ channels5 and in the insertion of disulfide bonds into Escherichia coli periplasmic proteins by the DsbB-DsbA complex6. Because of its tendency to partition into membrane interfaces (Figure 1) and subsequently permeabilize membranes, the amphipathic helix is a common starting motif for designing or re-engineering antimicrobial peptides7–12. Helix amphiphilicity has been widely examined in the context of membrane permeabilization, but little attention has been paid to the relationships between μH, peptide helix-forming ability, and membrane affinity. We present here the results of a systematic investigation of the influence of μH on the folding and partitioning of membrane-active peptides. We show that μH is a far more potent driving force for interfacial partitioning than total peptide hydrophobicity.
Figure 1.
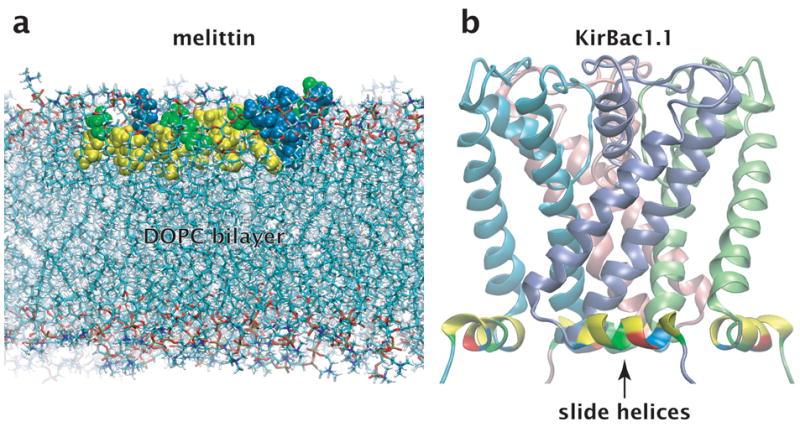
Amphipathic helices at membrane interfaces. Residues are colored according to residue type: yellow, non-polar; green, polar; blue, basic; red, acidic. The non-polar residues generally face the hydrocarbon interior of the bilayer while the polar and charged residues face the aqueous phase. (a) Melittin, an archetypal toxin peptide, embedded in the interface of a dioleoylphosphatidylcholine (DOPC) bilayer. The image was created from a frame taken from a restrained molecular dynamics simulation55. (b) Channel domain of the KirBac1.1 ligand-gated K+-channel in the closed state4, including the interfacial slide helices that mechanically couple the ligand receptor (not shown) to channel opening. Amphipathic helices such as these are common structural features of membrane proteins2,3. Images produced with VMD software56.
Most membrane-active helix-forming peptides have low or moderate helicity in aqueous solution but become highly helical when partitioned into membranes. This is due in part to the potent ability of membranes to promote secondary structure13–16, a process conveniently described as partitioning-folding coupling17,18. A classic example is the partitioning of melittin, a 26-residue peptide that is the principal component of bee venom19. Largely unstructured when free in solution, melittin strongly adopts an amphipathic α-helical conformation when partitioned into membranes20–23. An important driving force for folding arises from the lower energetic cost of partitioning H-bonded peptide bonds compared to free peptide bonds17,18,23. Knowledge of the energetics of this folding process is important for improving the activity of antimicrobial peptides and for understanding the folding and stability of membrane proteins. An essential element of these energetics is the per-residue reduction in free energy, ΔGresidue, that drives secondary structure formation in the membrane interface. This parameter, as we shall show, plays a critical role in the development of an analytical description of peptide folding.
Reported values for ΔGresidue for α-helical peptides range between −0.1 and −0.4 kcal mol−1 per residue. Ladokhin and White23 estimated that ΔGresidue = −0.41(±0.06) kcal mol−1 for melittin partitioning-folding in zwitterionic large unilamellar vesicles (LUV) by measuring the partitioning free energies and helicities of native melittin and of a diastereomeric analog with four D-amino acids (D4, L-melittin)24. At about the same time, Seelig and co-workers25, using a variant of the native/diastereomeric approach, measured the partitioning of the antimicrobial peptide magainin into small unilamellar vesicles (SUV) formed from POPC and anionic palmitoyloleoylphosphatidylglycerol (POPG). They reported a value of only −0.14 kcal mol−1 per residue for ΔGresidue. Subsequently, Li et al.26 published a value of −0.25(±0.05) kcal mol−1 per residue, using model host-guest fusion peptides. We show here that such differences in ΔGresidue can arise in part from differences in μH.
Helical peptides are typically rendered amphipathic by using combinations of charged and hydrophobic residues27. But for the experiments reported here, we wished to avoid charged residues because of the non-additivity of Coulombic and hydrophobic interactions28, and because we wished to examine whether μH effects are affected by surface charge. We therefore used electrically neutral peptides whose designs were inspired by the peptides that Baldwin and colleagues used for studies of α-helix stability in aqueous phases29. As we describe below, we synthesized a family of peptides of the general form Ac-A8Q3L4-GW-NH2 in which we varied the A8Q3L4 sequence to cover a range of μH values. The result was a family of peptides with identical hydrophobicities but different hydrophobic moments. We report below each peptide’s helicity and folding free energy in buffer and in POPC and POPC:POPG LUV. We show that peptide helicity in water and interface increase linearly with μH, as does the magnitude of peptide partitioning free energy.
RESULTS
Thermodynamic Framework
Algorithms for predicting peptide folding and binding to membrane interfaces require an experimentally accessible thermodynamic cycle for analyzing partitioning-folding data30,31 that yields ΔGresidue. Figure 2A shows the thermodynamic cycle that forms the quantitative framework for our data. Its important feature is an experimentally definable unfolded reference state in the aqueous phase, which—as discussed below—is critical for predictions. We consider an equilibrium between four states: unfolded peptide in the aqueous phase (A) and membrane interface (B), partially folded in aqueous phase (C), and folded in the membrane interface (D). As discussed in detail by Hristova and White32, experimental determination of ΔGAB for the A ⇋ B leg of the cycle is problematic, because partitioning-folding coupling causes a great excess of D relative to B. To circumvent this problem, Hristova and White32 developed an experiment-based algorithm for predicting the partitioning of unfolded peptides into POPC interfaces. Based upon an experimental extension of the Wimley-White interfacial hydrophobicity scale17, the Hristova-White algorithm predicts partitioning with high accuracy28. Because ΔGAB can be computed accurately, the experiments described below revolve around systematic experimental determinations of ΔGAC and ΔGCD, from which ΔGBD and ΔGresidue follow. We measured peptide helicity, ΔGAC, and ΔGCD for each member of the Ac-A8Q3L4-GW-NH2 peptide family, as described below. GAC was measured using the alcohol titration method of Hirota et al.33,34 and ΔGCD by circular dichroism and fluorescence titration.
Figure 2.
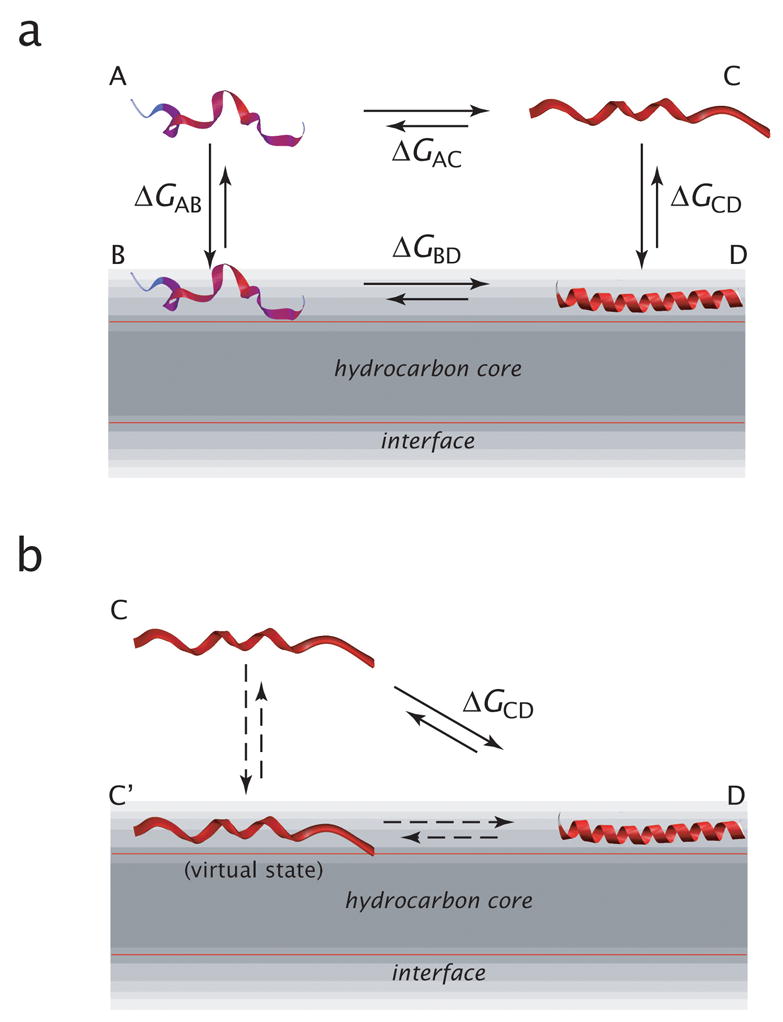
Thermodynamic schemes for peptide partitioning and folding in membrane interfaces. (a) Four-state thermodynamic cycle for describing the partitioning and folding of peptides into bilayer interfaces from water using four states: fully unfolded peptide in the aqueous phase (state A) and in the membrane (state B), partially folded in aqueous phase (state C), and folded in the membrane interface (state D). This scheme takes the fully unfolded peptide in the aqueous phase as the reference state. As we state before, measurements of the partitioning of most biologically interesting peptides yield free energies for the C to D equilibrium, because the B state is much less populated than the D state. Nevertheless, the A to B equilibrium establishes an important reference state. (b) Two-state thermodynamic cycle commonly used for describing peptide partitioning into the membrane interface. Three thermodynamic states are shown: partially folded in water (state C), partially folded in membrane (state C’), and folded in the membrane interface (state D). The C’ state cannot generally be observed experimentally by the usual optical methods because its occupancy is very small compared to state D. This thermodynamic scheme is a very practical one, because the C and D states (and therefore ΔGCD) are readily accessible by circular dichroism and fluorescence measurements. But the difficulty is that each peptide has a different degree of folding in the aqueous and membrane phases, which complicates the per-residue folding free energy in the interface. The scheme in panel a avoids this problem by tying all measures to a common reference state.
The important feature of the thermodynamic cycle is the A ⇋ B equilibrium, which is not accounted for in the traditional thermodynamic analysis of peptide partitioning23,25,31 (Figure 2b). This latter thermodynamic scheme is a very practical one, because the C and D states (and therefore ΔGCD) are readily accessible by circular dichroism (CD)23,25 and fluorescence measurements35. But there is a problem: The conformation of the peptide in state C depends inherently on its sequence and aqueous environment, often in complex ways29,36. The consequence is that each peptide in, say, a host-guest family can have a different extent of folding in the ΔGCD measurement. This can obscure the true per-residue cost of folding, which is an essential element for a successful prediction algorithm. This problem was ameliorated by Ladokhin and White23 through the use of diastereomeric peptides that cause the peptide to have similar conformations in states C and C’. Despite its incompleteness, the thermodynamic scheme of Figure 2b nevertheless leads to useful algorithms for estimating partitioning and folding.
Peptide Design and Helicity
All of the peptides had an acetylated N-terminus and amidated C-terminus in order to avoid Coulombic interactions with charged lipids. We found that a test “Baldwin” peptide29, Ac-(AAQAA)3GY-NH2, partitioned minimally into POPC vesicles with a ΔG ≤ − 2.2 kcal mol−1. This peptide thus served as a zero-binding baseline for engineering partitioning upward through systematic alterations in sequence using Ala-to-Leu substitutions. We replaced the tyrosine residue with tryptophan to facilitate measurements of partitioning free energy by fluorescence titration, and to determine peptide concentration from Trp absorbance at 280 nm (ε280 = 5600 M−1 cm−1). As in the designs of Chakrabartty and Baldwin29, Trp was segregated from the rest of the peptide by a Gly residue to reduce the contribution of the aromatic chromophore to the far-UV circular dichroism (CD) spectrum37.
The peptides synthesized in the course of this study are shown in Table 1, along with their hydrophobic moments μH and their Wimley-White17 hydrophobicity scale free energies of transfer, computed using the Hristova-White32 algorithm that is included in the Totalizer module of MPEx (available on-line at http://blanco.biomol.uci.edu/). Only the peptide A8Q3L4–4.72 (i.e., μH = 4.72) bound significantly to POPC LUV membranes. Therefore, variants of this peptide were synthesized and used for systematic studies of the relationship between μH and the free energies of transfer. The Totalizer results indicated that the free energy of partitioning ΔGTM of Ac-A8Q3L4-GW-NH2 into the membrane from water as a transmembrane helix is unfavorable by +3 kcal mol−1. A similar conclusion was reached using the recently determined biological hydrophobicity scale38 (ΔGTM = +4.6). It is therefore reasonable to assume that all of the peptides partitioned only into the membrane interface.
Table 1.
Amino acid sequences of the A8Q3L4 family of peptides used in this study, including computed hydrophobic moments and partitioning free energies.
| Amino Acid Sequence | Name | Hydrophobic a moment (μH) | bΔGWW (kcal mol−1) |
|---|---|---|---|
| AC-LQALAAQALQAAALA-GW-NH2 | A8Q3L4-0.55 | 0.55 | −3.53 |
| Ac-LAQAAALQLLAAQAA-GW-NH2 | A8Q3L4-2.00 | 2.00 | −3.53 |
| Ac-AQLAALAALQAAQLA-GW-NH2 | A8Q3L4-2.86 | 2.86 | −3.53 |
| Ac-AAAQAAAQLLQALLA-GW-NH2 | A8Q3L4-4.72 | 4.72 | −3.53 |
| Ac-QLAQALAAALAALAQ-GW-NH2 | A8Q3L4-5.51 | 5.51 | −3.53 |
| Ac-QALQALAAALAALAQ-GW-NH2 | A8Q3L4-5.54 | 5.54 | −3.53 |
Hydrophobic moments were computed using the Totalizer module of MPEx, available over the World Wide Web: http://blanco.biomol.uci.edu/mpex
Free energies of transfer from water to bilayer interface based upon the Wimley-White17 experiment-based interfacial hydrophobicity scale. These were also computed using the Totalizer module of MPEx (above).
The CD spectra of the peptides A8Q3L4–5.51, A8Q3L4–2.86, and A8Q3L4–0.55 are shown in Figure 3. The spectra present two minima (≈222 nm and ≈205 nm) and a maximum at ≈190 nm, which correspond to mixtures of helix and random coil. The fractional helix content (fα) is directly proportional to the mean molar ellipticity at 222 nm ([Θ]222 in units of deg cm2 dmol−1) and was calculated as described in Materials and Methods. As shown in Figure 4, the helical content in buffer (▲) increases linearly with hydrophobic moment, ranging from 9% for the peptide with the lowest μH to 40% for the peptide with the maximum μH (see Supplementary Table S1 online).
Figure 3.
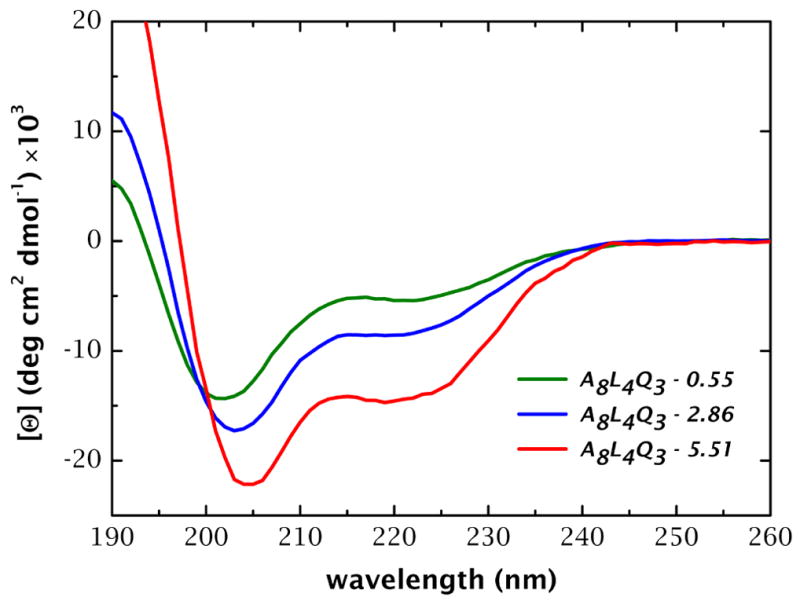
CD spectra of the peptides A8Q3L4-5.51, A8Q3L4-2.86, and A8Q3L4-0.55 at 25 °C in 10 mM phosphate buffer, and 20–30 μM peptide. The spectra were taken in a 1-mm path length cuvette and averaged over 10–20 scans. Increasing the hydrophobic moment increases the helical content in water (measured as molar ellipticity at 222 nm).
Figure 4.
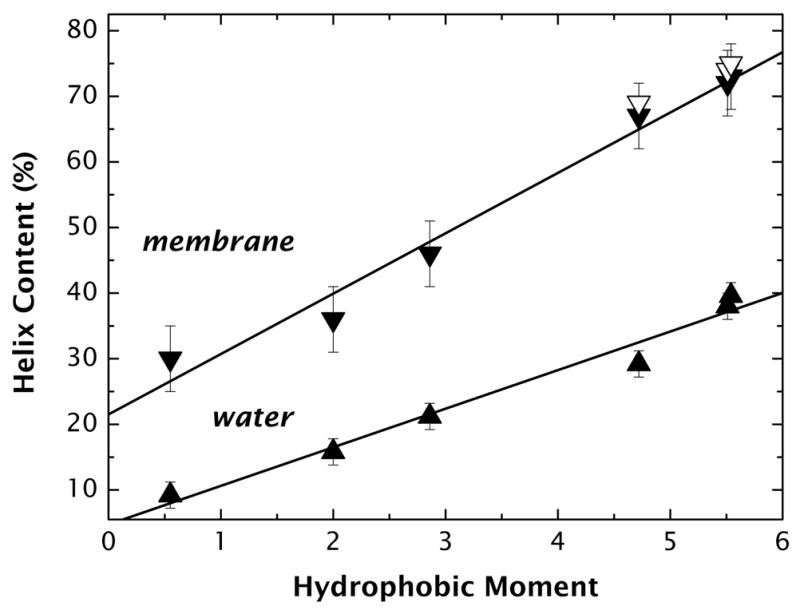
Helicity of the A8Q3L4-family of peptides in water and the membrane interface (POPC solid down-side triangles and POPC:POPG open down-side triangles) as a function of hydrophobic moment. Helicity is a linear function of hydrophobic moment in both media, and it does not depend on the lipid surface charge. Helicity in the membrane interface was determined from [Θmax] computed from binding curves. See Methods and Supplementary Figure S3.
Free Energy of Folding in Buffer: ΔGAC
Because our model peptides were not in a completely unfolded state in water, the free energy difference ΔGAC between the fully unfolded and partially folded states had to be determined. ΔGAC was measured using the alcohol-induced α-helix-formation method of Hirota and colleagues33,34 using both methanol (data not shown) and trifluoroethanol (TFE) to induce folding. The TFE titration data are included in Supplementary Material (Figs. S1 and S2). Helicity was found to increase with alcohol concentration, strictly following a Boltzmann distribution, as expected for a two-state transition. Because the TFE titration curves reached saturation, [Θ]222 values could be established for fully unfolded and fully helical peptides. These values allowed determination of the fractions of helical (fα) and unfolded (fu = 1 – fα) peptides for a particular TFE concentration to be determined, including [TFE] = 0. Values of fα for [TFE] = 0 are shown in Supplementary Table S1 online. The free energy change ΔG0 for folding in the absence of TFE is given by ΔG0 = −RTlnKα ≡ ΔGAC, where Kα = fα/fu. The free energies (Supplementary Table S1 online), ranging from +1.32(±0.06) kcal mol−1 for A8Q3L4–0.55 to +0.27(±0.04) kcal mol−1 for A8Q3L4–5.54, are plotted in Figure 5.
Figure 5.
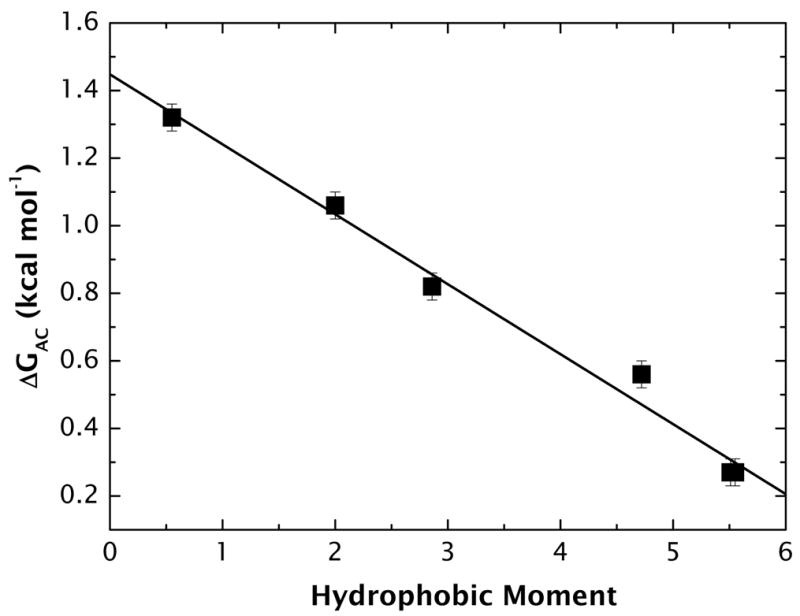
The linear dependence of the free energy of helix formation in water as a function of hydrophobic moment.
Interfacial Partitioning of Partially-Folded Peptides: ΔGCD
Partitioning of the peptides into LUV membranes resulted in the formation of α-helical structure. As in aqueous solution (above), the fractional helicity increased linearly with μH (Figure 4). This means that a simple linear relation must also exist between helicity in water and helicity in bilayer. This provides a simple algorithm for estimating membrane-bound helicity from aqueous helicity (see Discussion).
The free energies of peptide partitioning into LUV formed from POPC and POPC/POPG (1:1) were determined both by CD and fluorescence spectroscopy titration following the procedures of White et al.39 Typical titration data obtained by CD and fluorescence titration are included in Supplementary Material (Figs. S3 and S4). The data for all measurements are included in Supplementary Material (Table S2). Interestingly, the partitioning of the peptides into neutral and negatively charged lipids are very similar. For A8Q3L4-5.54 for example, ΔGCD = −7.0(±0.2) kcal mol−1 for the POPC LUV and −7.1(±0.2) kcal mol−1 for POPC/POPG as determined by CD spectroscopy. Similar values were obtained by fluorescence titration: ΔGCD = −7.4(±0.2) kcal mol−1 for the POPC LUV and −7.2(±0.1) kcal mol−1 for POPC/POPG (Table S2). Overall, the results suggest that bilayer charge is irrelevant for the partitioning of these neutral peptides. The same is true for helicity. For example, fractional helicities fα were computed from the values of [Θ]max (see Methods), and found to be 73% and 75% for POPC and POPC/POPG, respectively (Figure 4) for A8Q3L4-5.54.
Values of ΔGCD for the peptides (see Supplementary Material, Table S2) are plotted against μH in Figure 6, which shows that the magnitudes of the partitioning free energies increase (become more favorable) linearly with μH. These results confirm that, within experimental errors, the partitioning of our neutral peptides is independent of surface charge. A least-squares fit of the data to a linear curve thus yields a simple relationship between partitioning free energy and hydrophobic moment:
| (1) |
Figure 6.
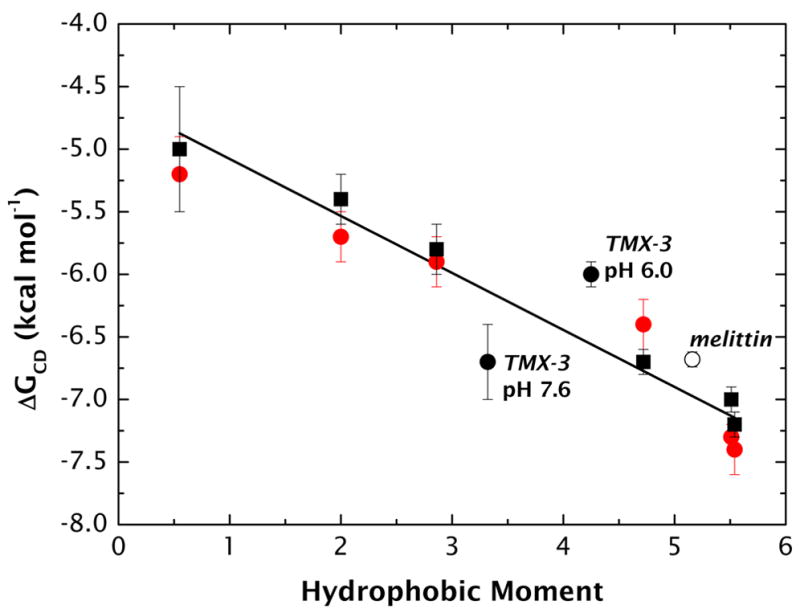
The free energy of partitioning (ΔGCD) the A8Q3L4-family of peptides into POPC (solid red circles) and POPC:POPG (solid black squares) LUV interfaces. The solid line is the best-fit linear curve through all points. Partitioning free energy values for TMX-3 (31-residues: GWAALAAHAAPALAAALAHAAASRSRSR-amide; μH = 3.32 at pH 7.6 and 4.25 at pH 6) and melittin (26 residues: GIGAVLKVLTTGLPALISWIKRKRQQ-amide; μH = 5.18) are included for comparison (closed and open circles, respectively). The TMX-3 and melittin free energies are not described particularly well by the linear curve, which is not surprising given the great differences in sequence and length compared to the A8Q3L4-family. More important, however, is the fact that both TMX-3 and melittin have little tendency to partition into POPC interfaces based upon total hydrophobicity (see text).
We examined the general validity of this equation by comparing the data of Figure 6 with partitioning free energy data for two peptides whose sequences and lengths differ dramatically from our ‘Baldwin’ peptides. The two peptides were the natural peptide melittin (26 residues: GIGAVLKVLTTGLPALISWIKRKRQQ-amide; μH = 5.18) and the designed peptide31 TMX-3 (31 residues: GWAALAAHAAPALAAALAHAAASRSRSR-amide; μH = 3.32 at pH 7.6 and 4.25 at pH 6). The partitioning free energies of melittin35 and TMX-331 are indicated in Figure 6 (open and closed circles, respectively. The agreement of these data with the A8Q3L4-family data seems unimpressive until one considers the expected free energies based solely on total hydrophobicity (ΔGAB): −0.07 kcal mol−1 for melittin; +0.75 kcal mol−1 for TMX-3 at pH 7.6; and +2.83 kcal mol−1 for TMX-3 at pH 6. Were it not for the amphiphilicity of these helical peptides, partitioning would be undetectable based upon simple hydrophobicity alone.
Interfacial Partitioning of Unfolded Peptides: ΔGAB
The unfolded-peptide partitioning free energy ΔGAB is the same for all of the peptides, because they all have the same amino acid composition. As described earlier, Δ GAB is taken as equal to the partitioning free energy ΔGWW calculated from the Wimley-White hydrophobicity scale17 using the algorithm of Hristova and White32 (Table 1). The computed value of ΔGAB is −3.53 kcal mol−1, which is considerably higher than the values of melittin and TMX-3.
Peptide folding in the membrane interface: ΔGBD
The free energies of folding of the peptides in the interface were obtained by simple summation of the other legs of the thermodynamic cycle (summarized in Supplementary Material, Table S3). As shown in Figure 7a, ΔGBD improves linearly with increases in μH, ranging from −0.25(±0.45) kcal mol−1 for A8Q3L4–0.55 to −3.5(±0.07) kcal mol−1 for A8Q3L4–5.54. Included in the figure are the estimated values of ΔGBD for melittin and TMX-3 (pH 7.6). Not surprisingly, the values fall far off the curve for the A8Q3L4 data. A possible explanation for the deviations is that melittin and TMX-3 have much longer sequences (n = 26 residues and 31 residues, respectively) than the A8Q3L4 peptides (n = 17 residues, including the Gly-Trp residues at the C-terminal). This possibility gains credibility when the data are re-plotted using per-residue values of free energy, ΔGresidue = ΔGBD/fαn, where fα is the fractional helicity for fully bound peptides (above).
Figure 7.
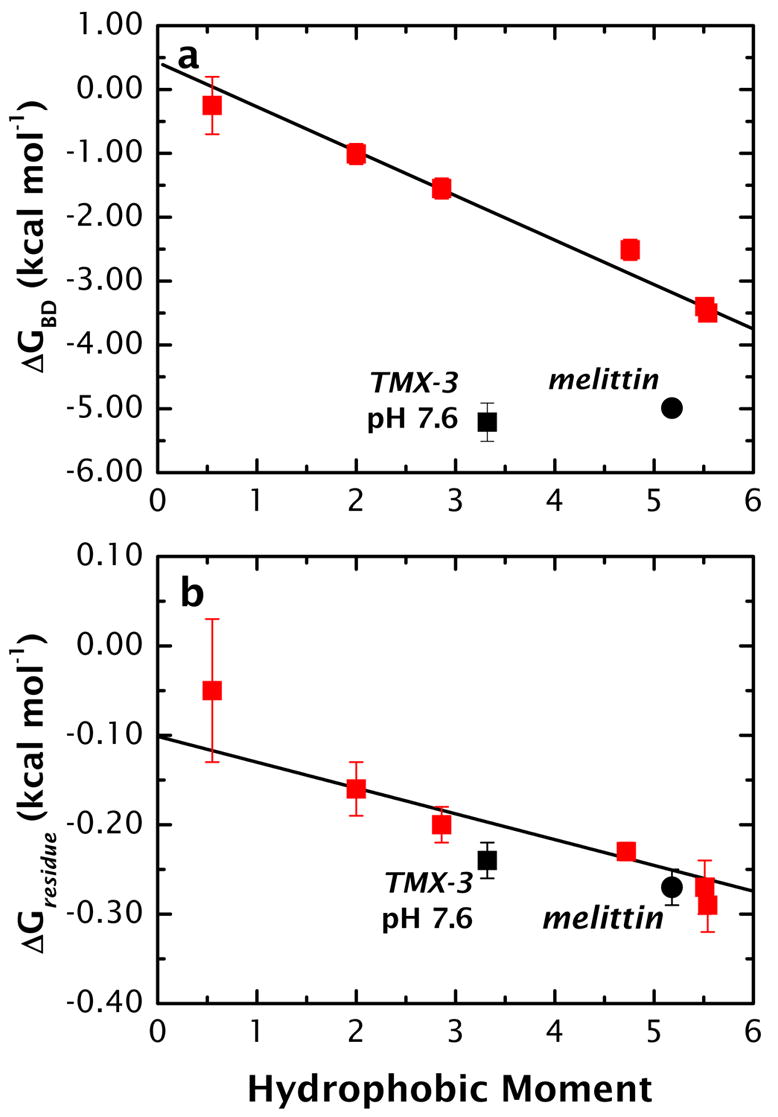
Free energies of folding of the A8Q3L4-family of peptides in the POPC interface. (a) Values of free energy ΔGBD of folding in the POPC interface computed using the thermodynamic scheme of Figure 2a and the computed values for ΔGAB (Table 1, ΔGAB ≡ ΔGWW) and the measured values of ΔGAC and ΔGCD. The corresponding values of melittin and TMX-3 (solid circle and solid square, respectively) fall far off the curve. This appears in large measure to be due to sequence length. (b) The data of panel a re-plotted using per-residue free energies ΔGresidue computed from ΔGresidue = ΔGBD/fαn, where fα is the fractional helicity and n is the number of residues in the sequence. Notice that the TMX-3 and melittin data are described reasonably well by the A8Q3L4 when length is accounted for, computed as follows: Melittin has a 6% helix content in aqueous solution that increases to fα = 0.71 when membrane-bound20,23. We determined experimentally that ΔGAC = 1.62(±0.06) kcal mol−1 (data not shown), and computed from the Hristova-White algorithm32 computed that ΔGAB = −0.07 kcal mol−1. From these values, the value of ΔGCD (see text), and n = 26, ΔGresidue is found to be −0.27(±0.01) kcal mol−1 per residue. TMX-3 has a 22% helix content in aqueous solution, which increases to about 70% when membrane–bound at neutral pH. We determined experimentally (data not shown) that ΔGAC = 0.74(±0.03) kcal mol−1. From these values, the value of ΔGCD (see text), and n = 31, we computed ΔGresidue as −0.24(±0.01) kcal mol−1 for TMX-3 in the deprotonated form. This value is approximate, because ΔGAC was determined only at neutral pH where the amino terminus and the His residues are still partially protonated.
Values of ΔGresidue for melittin, TMX-3, and the A8Q3L4 family are plotted against μH in Figure 7b. The A8Q3L4 data are described well by the linear curve described by
| (2) |
ΔGresidue depends significantly upon μH, achieving a value of about −0.24 kcal mol−1 per residue for μH = 5. ΔGresidue folding free energies for TMX-3 and melittin are described remarkably well by the curve computed from the A8Q3L4 data (Eq. 2).
DISCUSSION
We have examined the folding in water and membranes of a family of uncharged peptides of fixed amino acid composition (Ac-A8Q3L4-GW-NH2), designed to have different amphiphilicities as measured by the hydrophobic moment1 (μH). We have shown that all of the peptides form α-helical secondary structure in both water and membranes. Because all of the peptides have the same hydrophobicity, differences in folding and binding free energies must be due to structural differences described by μH In broad sweep, both helicity and membrane partitioning increased with μH, generally in a linear fashion (Figures 4 and 6). We used both neutral (POPC) and charged (POPC:POPG 1:1) LUV to see if partitioning and folding were affected by surface charge. They were not significantly affected (Figure 6).
As far as we are aware, this is the first examination of the helicity of peptides in buffer as a function of hydrophobic moment. Earlier studies of the contributions of non-polar residues to helix stability bear directly on the question of why the helicities of our peptides apparently depend upon hydrophobic moment. Without the aid of sidechain-sidechain helix-stabilizing interactions, only polyalanine readily forms stable helices in water40. Leucine-leucine (LL) pairs are among the non-polar side chain interactions that can contribute to the helical stability of soluble peptides41, and (i, i + 4) LL pairs comprise the most frequently observed class of pair-wise side chain interactions in protein helices42. Formation of the interacting LL pair is assumed to be driven by non-polar contacts43, probably by burial of non-polar surface area44.
Recent results from Luo and Baldwin45 have demonstrated that the (i, i + 4) LL interaction is substantially stronger than the (i, i + 3), probably because of differences in the solvation of peptide groups in the helix backbone. In their work, they used six different peptides: two as control and four with different side-chain interactions. Their data show that helicity increases with μH (see Supplementary Material, Table S4 and Figure S5). Two of our peptides, A8Q3L4-5.51 and A8Q3L4-5.54, have (i, i +3) and (i, i + 4) interactions, which may explain in part the dependence of helicity on μH.
Our data were collected systematically following the thermodynamic cycle of Figure 2a that uses the fully unfolded peptide state as the reference state. An important goal was to deduce the per-residue folding free energies of the A8Q3L4 peptides in the membrane interface, ΔGBD, by determining the energetics of the other three equilibria (ΔGAB, ΔGAC, and ΔGCD). Because of the near-impossibility of measuring ΔGAB directly32, it was computed using the Wimley-White hydrophobicity scale17 and the algorithm of Hristova and White32. ΔGAC was measured by alcohol titration of peptides in buffer (Supplementary Material, Fig. S1) and found to decrease linearly as μH increased (Figure 5). ΔGCD was determined for each peptide by CD spectroscopy and fluorescence titration methods (Figure 7 and Table 2. See also Supplementary Material, Figs. S3 and S4 and Table S2).
Our results lead to the conclusion that the amphiphilicity of helical peptides is dominant in the binding free energy in neutral membrane interfaces. This is apparent from the data shown in Figure 6. The partitioning free energies ΔGAB, which measure only the hydrophobic affinity of unfolded peptides, vary from somewhat favorable for the A8Q3L4 family (−3.53 kcal mol−1) to barely favorable for melittin (−0.07 kcal mol−1) to unfavorable for TMX-3 (+0.75 and +2.83 kcal mol−1, pH 7.6 and pH 6.0, respectively). The amphiphilicities of the peptides apparently cause all of the peptides, regardless of sequence, to partition very strongly into the membrane interface. This means that the partitioning free energies of helical peptides cannot be predicted accurately based solely upon hydrophobicity. Accurate predictions require that hydrophobic moments be taken into account. Although the linear curve of Figure 6 does not describe the TMX-3 and melittin with great accuracy, it is clear that the best estimates of ΔGCD for peptides will be obtained from hydrophobic moments rather than simple hydrophobicity considerations.
The process of designing new antimicrobial peptides is hindered by the time-consuming efforts required to synthesize, purify, and characterize candidate peptides. An important subsidiary goal of our measurements was therefore to develop methods for designing peptides that will bind to membranes to a desired extent. The data presented here provide two practical approaches that apply to uncharged peptides partitioning into charged or uncharged membranes, or charged peptides partitioning into uncharged membranes. The inclusion of Coulombic interactions (below) adds an additional layer of complexity, but can be managed, in principle, by accounting for the non-additivity of hydrophobic and electrostatic interactions28. This is a subject for future work. The only purpose of the shortcuts outlined below is to minimize the number of rounds of design and experiment. Experimental verification of “predicted” physical parameters remains an essential step.
Designing Amphipathic Helices Using Hydrophobic Moments
As shown in Figure 6, the partitioning free energies decreased (became more favorable) linearly with μH, independent of the surface charge of the lipid. This seems to be a general result, because two peptides completely unrelated to the A8Q3L4 (melittin and TMX-3) peptides are described reasonably well by the linear ΔGCD(μH) curve. However, because both melittin and TMX-3 are charged peptides, the relationship is applicable only to pure POPC bilayers, which is arguably the most widely used zwitterionic lipid. Although further refinements are in order, it appears that, to a reasonable approximation, ΔGCD can be estimated from Eq. (1) given the hydrophobic moment.
Designing Amphipathic Helices Using Peptide Helicity
The linear dependence of helicity on μH (Figure 4) suggests that measured values of helicity can be useful for estimating the free energies of partitioning of peptides into uncharged LUV membranes using the thermodynamic cycle of Figure 2b. This is illustrated in Figure 8 where we have plotted ΔGCD against the change in helicity Δfα that accompanies partitioning of our peptides into POPC LUV. The linear dependence of ΔGCD (kcal mol−1) on Δfα is described mathematically by
Figure 8.
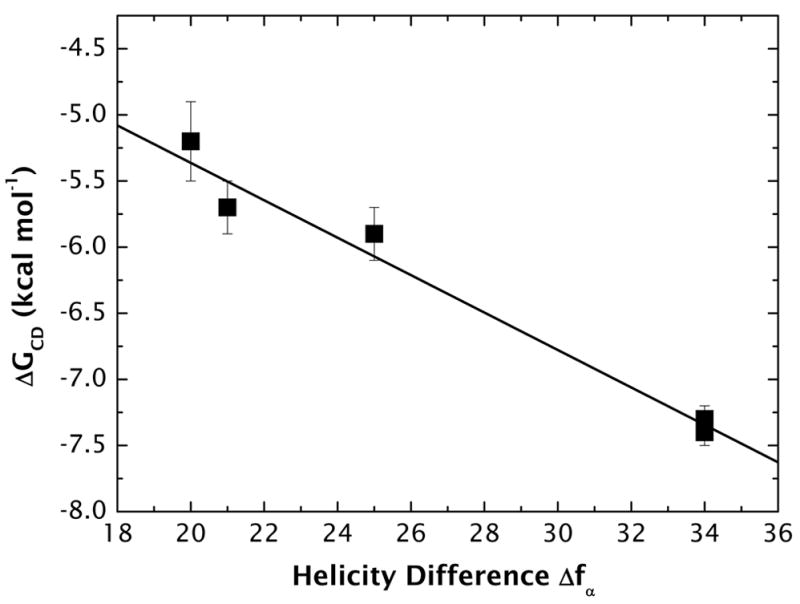
The free energy of partitioning of the A8Q3L4 family of peptides from buffer to the POPC bilayer interface plotted as a function of the difference in helicity (Δfα) of the peptides in the membrane and in water (Figure 4).
| (3) |
where Δfα = fmα − fwα and the subscripts m and w indicate membrane and water helicity values, respectively.
But without any measurements at all, it is possible to estimate helicity in water using the AGADIR algorithm of Muñoz and Serrano46–49, which is based upon helix–coil transition theory and experimental measurements on 1200 peptides. The correlation between our measured values of aqueous helicity and values computed using AGADIR is quite good (see Supplementary Material, Fig. S6). Because of the implicit linear relationship between fmα and fwα shown in Figure 4, one can further estimate fmα from the value of fwα computed using AGADIR. Figure 9 shows the experimentally determined values of fmα plotted against fwα determined experimentally (■) or computed by AGADIR (○). A linear least-squares fit yields a linear relation between fmα from the value of fwα given by
Figure 9.
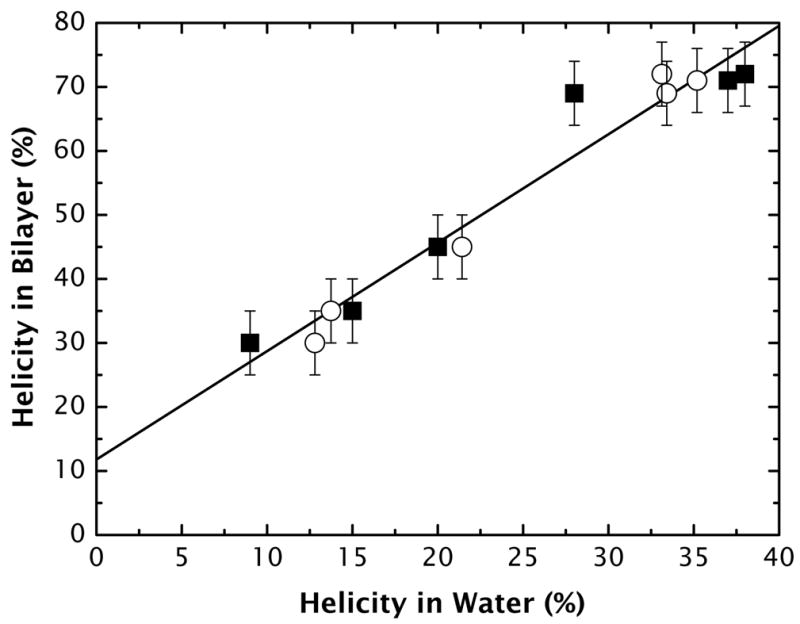
The helicity of the A8Q3L4 family of peptides in membranes fmα plotted against the fractional helicities fwα in buffer. The experimentally determined values of fmα plotted against fwα determined experimentally (■) or computed by AGADIR (○).
| (4) |
Free Energy of Folding in Membrane Interfaces
In addition to establishing a practical general approach to peptide design, another goal of our experiments was to explore quantitatively the energetics of peptide folding in membrane interfaces. The free energy of folding of an unfolded peptide in the POPC bilayer interface, ΔGBD, followed immediately from the sums of the other legs of the thermodynamic cycle of Figure 2a. ΔGBD decreased linearly with increasing hydrophobic moment (Figure 7a). The resulting linear function, Eq. (2), does not appear to be generally useful, because ΔGBD for melittin and for TMX3 fall well off of the curve in Figure 7a. This is not surprising, because melittin has 26 residues and TMX3 31 residues, while the Ac-A8Q3L4-GW-NH2 family has only 17. However, when peptide length is accounted for by calculating the per-residue free energy of folding using the equation ΔGresidue = ΔGBD/fαn, both melittin and TMX-3 are described reasonably well by the ΔGresidue curve for the Ac-A8Q3L4-GW-NH2 family (Figure 7b). This suggests that Eq. (2) may be a general result useful for any peptide partitioning into neutral POPC interfaces. Unfortunately, there are very few partitioning free energy data available in the literature for testing this possibility. Future efforts to design peptides using the equations presented here should resolve the question.
Although the primary driving force for partitioning-folding coupling arises from the free energy reduction associated with peptide-bond hydrogen bonding, the dependence of ΔGresidue on μH indicates that other interactions must be important as well. These include as a minimum the effects of assembly entropy, sidechain packing, relative exposure of sidechains to membrane and water, and the depth of membrane penetration by secondary structure units. This is apparent from the Li et al. study of the binding of fusion peptides to vesicle membranes26.
The values of ΔGresidue for melittin found from direct measurements (Fig. 7b) or from Eq. (2) are −0.27(±0.01) and −0.29(±0.01) kcal mol−1 per residue, respectively, which are smaller than the value of −0.41(±0.06) kcal mol−1 determined by Ladokhin and White23 from measurements of the partitioning of melittin and a diastereomeric melittin analog. There are two likely reasons for the difference: first, the diastereomer was not completely unfolded in the interface (fα ≈ 0.23); second, Ladokhin and White assumed that ΔGAC ≈ 0, which is contrary to our finding here that ΔGAC ≈ 1.6 kcal mol−1 (see Supplementary Material, Table S1). This emphasizes the importance of using the thermodynamic cycle shown in Figure 2a. Interestingly, the revised value for melittin compares quite favorably with the value of −0.25(±0.05) kcal mol−1 per residue determined by Li et al.26 for the partitioning of charged model host-guest fusion peptides partitioning into SUV formed from POPC:POPG (4:1). Because of the differences in experimental conditions, particularly charged peptides binding to charged SUV, the agreement is likely fortuitous. Similarly, the relatively small value of ΔGresidue of −0.14 kcal mol−1 per residue determined by Wieprecht and Seelig25 for diastereomeric magainins is not easily compared directly with our results, because the binding free energies of the magainins to POPC:POPG also had a significant Coulombic component. In addition, they assumed hydrophobic and Coulombic free energies to be additive, which we now know to be an incorrect assumption28. Both the Li et al. and the Wieprecht and Seelig results involved extracting intrinsic (non-electrostatic) partition coefficients from the dependence of partitioning on surface potentials computed using the Gouy-Chapman equation50. This points out the need for extending studies of the μH-dependence of the partitioning of charged peptides into charged membranes.
MATERIALS AND METHODS
Materials
POPC and POPG were purchased from Avanti Polar Lipids (Alabaster, AL). Fmoc amino acids and resins for peptide synthesis were obtained from NovaBiochem (EMD Biosciences, San Diego, CA). All chemicals were of analytical reagent grade. A 10 mM potassium phosphate buffer solution (pH 7.0) was used to reduce the UV absorbance in CD experiments.
Peptide syntheses and purification
Peptides were synthesized on a 433A Applied Biosystems automatic synthesizer by step-wise solid-phase procedures51 using fluorenylmethoxycarbonyl (F-moc) chemistry and TFA cleavage. Syntheses were performed on a 0.1 mmol scale starting with Fmoc-Rink amide MBHA resin. F-moc-protected amino acids were used for all coupling reactions. The crude peptides were purified by reverse-phase HPLC on a preparative C18 reverse-phase column using gradients of acetonitrile in 0.1% trifluoroacetic acid. Peptide identities were confirmed by matrix-assisted laser desorption ionization (MALDI) mass spectrometry (Chemistry Department, University of California, Irvine).
Peptide aggregation
Aqueous peptide concentrations of the peptides were typically 10–30 μM. We established by fluorescence and CD spectroscopy that the peptides were monomeric under the conditions of our experiments (data not shown). Specifically, CD spectra for all peptides were independent of concentration between ~15 and ~100 μM. Over the same concentration range, the wavelength of maximum fluorescence for Trp was found to be constant and equal to about 350 nm, as expected for aqueous solutions of monomeric peptides.
Preparation of vesicles
A defined amount of lipid in chloroform was first dried under nitrogen and then overnight under high vacuum. Typically, 1–2 mL of buffer was added to the lipid and the dispersion vortexed extensively. Large unilamellar vesicles (LUV, diameter ~ 0.1 μm) were formed under nitrogen by extrusion through Nucleopore polycarbonate membranes (ten times through two stacked 0.1-μm filters), using the method of Mayer et al.52
Circular Dichroism and Optical Absorbance
CD measurements were performed using an upgraded Jasco-720 spectropolarimeter (Japan Spectroscopic Company, Tokyo). Normally, 10 to 30 scans were recorded between 190 and 260 nm at ambient temperature (~25°C), using a 1 mm optical path. All spectra were corrected for background scattering by subtracting a vesicle-only spectrum measured with an appropriate concentration of vesicles in buffer, without the peptide. Measured values of ellipticity (Θ) were converted into the ellipticity per amino acid residue [Θ] using
| (5) |
where l is the optical path-length of the cell, c the peptide concentration, and MWR the average mass per amino acid residue of the peptide used.
The fractional helical content fαestimated using the formula
| (6) |
where Θ observed ellipticity, ΘRC the limiting value for a completely random coil, and ΘH the limiting value for a completely helical conformation. We determined from titrations of our peptides with 2,2,2-trifluoroethanol (TFE) that [Θ]222 for 100% and 0% helicity have been estimated as −33,050 deg cm2 dmol−1 and −1,500 deg cm2 dmol−1, respectively (see Supplementary Material, Fig. S2). The value determined for ΘH is satisfyingly close to the theoretically expected value of -33,529 computed from data and analysis of Chen et al.53. CD spectra and absorbance were measured in the same cuvette in order to minimize errors in determination of molar ellipticity. UV absorbance was measured with a Cary 3E spectrophotometer (Varian Analytical Instruments, Sugar Land, TX). Molar concentrations were determined using a molar extinction coefficient of ε280nm = 5600 M−1 cm−1 for tryptophan. Peptide concentrations were typically between 10 and 30 μM in phosphate buffer.
Fluorescence measurements
Fluorescence was measured using an OLIS-modified SLM-Aminco 8100 steady-state fluorescence spectrometer (Jobin Yvon, Edison, NJ, formerly SLM/Aminco, Urbana, IL) equipped with double-grating excitation and single-grating emission monochromators. All measurements were made in 2 × 10 mm cuvettes in a room thermostated to 25°C. Cross-orientation of polarizers was used (excitation polarization set to horizontal, emission polarization set to vertical) to minimize the scattering contributions from vesicles and to eliminate spectral polarization effects in monochromator transmittance. Peptide concentrations ranged from 10 to 15 μM.
Data analysis
Hydrophobic moments (μH) were determined using the Totalizer module of Membrane Protein Explorer (MPEx) available online at http://blanco.biomol.uci.edu/mpex. Totalizer computes μH using the formula54
| (7) |
where N is the number of residues in the sequence segment, Hn is the numerical value of hydrophobicity of the nth amino acid residue from the Wimley-White interfacial hydrophobicity scale17, δ= 2π/m, and m is the number of residues per turn. We assume an α-helix with m = 3.6 residues per turn, which yields δ = 100°.
Free energies of transfer ΔG of the peptides were determined from mole-fraction partition coefficients Kx using ΔG = −RTlnKx, where Kx is given by
| (8) |
in which [P]bil and [P]water are the bulk molar concentrations of peptide attributable to peptide in the bilayer and water phases, respectively. [L] and [W] are the molar concentrations of lipid and water (55.3M). Given that [P]total = [P]bil + [P]water, one can easily show that
| (9) |
where fp is the fraction of peptide bound. Kx was determined by least-squares fitting of eq. 8 to plots of fp against [L] using the Origin 7.0 software package (OriginLab, Inc., Northampton, MA).
The fraction of peptide bound was determined by titration measurements using both CD and fluorescence measurements. These methods have been described in detail by White et al.39 For CD measurements we used
| (10) |
where Θnorm is the normalized molar ellipticity of the peptide and Θm is the maximum normalized molar ellipticity of the peptide in the membrane.
For fluorescence titrations, Kx was determined from fluorescence intensities (I) that were fitted35,39 by standard non-linear least-squares methods to
| (11) |
where I is the normalized fluorescence intensity of the peptide at the chosen wavelength and I∝ is the maximum normalized intensity of the peptide in the membrane.
Supplementary Material
Supplementary Data
Supplementary data associated with this article can be found in the online version.
Acknowledgments
We thank Michael Myers for his editorial assistance and Drs. Hirsh Nanda and Ryan Benz for providing coordinates from the simulation of melittin in a bilayer. Research supported by the National Institute of General Medical Sciences, US National Institutes of Health.
Footnotes
Publisher's Disclaimer: This is a PDF file of an unedited manuscript that has been accepted for publication. As a service to our customers we are providing this early version of the manuscript. The manuscript will undergo copyediting, typesetting, and review of the resulting proof before it is published in its final citable form. Please note that during the production process errors may be discovered which could affect the content, and all legal disclaimers that apply to the journal pertain.
References
- 1.Eisenberg D, Weiss RM, Terwilliger TC. The helical hydrophobic moment: A measure of the amphiphilicity of a helix. Nature. 1982;299:371–374. doi: 10.1038/299371a0. [DOI] [PubMed] [Google Scholar]
- 2.Rees DC, De Antonio L, Eisenberg D. Hydrophobic organization of membrane proteins. Science. 1989;245:510–513. doi: 10.1126/science.2667138. [DOI] [PubMed] [Google Scholar]
- 3.Granseth E, von Heijne G, Elofsson A. A study of the membrane-water interface region of membrane proteins. J Mol Biol. 2005;346:377–385. doi: 10.1016/j.jmb.2004.11.036. [DOI] [PubMed] [Google Scholar]
- 4.Kuo A, Gulbis JM, Antcliff JF, Rahman T, Lowe ED, Zimmer J, Cuthbertson J, Ashcroft FM, Ezaki T, Doyle DA. Crystal structure of the potassium channel KirBac1.1 in the closed state. Science. 2003;300:1922–1926. doi: 10.1126/science.1085028. [DOI] [PubMed] [Google Scholar]
- 5.Long SB, Campbell EB, MacKinnon R. Voltage sensor of Kv1.2: Structural basis of electromechanical coupling. Science. 2005;309:903–908. doi: 10.1126/science.1116270. [DOI] [PubMed] [Google Scholar]
- 6.Inaba K, Murakami S, Suzuki M, Nakagawa A, Yamashita E, Okada K, Ito K. Crystal structure of the DsbB-DsbA complex reveals a mechanism of disulfide bond generation. Cell. 2006;127:789–801. doi: 10.1016/j.cell.2006.10.034. [DOI] [PubMed] [Google Scholar]
- 7.Zhong L, Putnam RJ, Johnson WC, Jr, Rao AG. Design and synthesis of amphipathic antimicrobial peptides. Int J Pept Protein Res. 1995;45:337–347. doi: 10.1111/j.1399-3011.1995.tb01047.x. [DOI] [PubMed] [Google Scholar]
- 8.Dathe M, Wieprecht T, Nikolenko H, Handel L, Maloy WL, MacDonald DL, Beyermann M, Bienert M. Hydrophobicity, hydrophobic moment and angle subtended by charged residues modulate antibacterial and haemolytic activity of amphipathic helical peptides. FEBS Lett. 1997;403:208–212. doi: 10.1016/s0014-5793(97)00055-0. [DOI] [PubMed] [Google Scholar]
- 9.Tossi A, Tarantino C, Romeo D. Design of synthetic antimicrobial peptides based on sequence analogy and amphipathicity. Eur J Biochem. 1997;250:549–558. doi: 10.1111/j.1432-1033.1997.0549a.x. [DOI] [PubMed] [Google Scholar]
- 10.Wieprecht T, Dathe M, Krause E, Beyermann M, Maloy WL, MacDonald DL, Bienert M. Modulation of membrane activity of amphipathic, antibacterial peptides by slight modifications of the hydrophobic moment. FEBS Lett. 1997;417:135–140. doi: 10.1016/s0014-5793(97)01266-0. [DOI] [PubMed] [Google Scholar]
- 11.Dathe M, Wieprecht T. Structural features of helical antimicrobial peptides: Their potential to modulate activity on model membranes and biological cells. Biochim Biophys Acta. 1999;1462:71–87. doi: 10.1016/s0005-2736(99)00201-1. [DOI] [PubMed] [Google Scholar]
- 12.Tossi A, Sandri L, Giangaspero A. Amphipathic, α-helical antimicrobial peptides. Biopolymers (Pept Sci) 2000;55:4–30. doi: 10.1002/1097-0282(2000)55:1<4::AID-BIP30>3.0.CO;2-M. [DOI] [PubMed] [Google Scholar]
- 13.Kaiser ET, Kézdy FJ. Secondary structures of proteins and peptides in amphiphilic environments (A review) Proc Natl Acad Sci USA. 1983;80:1137–1143. doi: 10.1073/pnas.80.4.1137. [DOI] [PMC free article] [PubMed] [Google Scholar]
- 14.Kaiser ET, Kézdy FJ. Amphiphilic secondary structure: Design of peptide hormones. Science. 1984;223:249–255. doi: 10.1126/science.6322295. [DOI] [PubMed] [Google Scholar]
- 15.Sargent DF, Bean JW, Schwyzer R. Conformation and orientation of regulatory peptides on lipid membranes Key to the molecular mechanish of receptor selection. Biophys Chem. 1988;31:183–193. doi: 10.1016/0301-4622(88)80024-3. [DOI] [PubMed] [Google Scholar]
- 16.Maloy WL, Kari UP. Structure-activity studies on magainins and other host defense peptides. Biopolymers. 1995;37:105–122. doi: 10.1002/bip.360370206. [DOI] [PubMed] [Google Scholar]
- 17.Wimley WC, White SH. Experimentally determined hydrophobicity scale for proteins at membrane interfaces. Nat Struct Biol. 1996;3:842–848. doi: 10.1038/nsb1096-842. [DOI] [PubMed] [Google Scholar]
- 18.Wimley WC, Hristova K, Ladokhin AS, Silvestro L, Axelsen PH, White SH. Folding of β-sheet membrane proteins: A hydrophobic hexapeptide model. J Mol Biol. 1998;277:1091–1110. doi: 10.1006/jmbi.1998.1640. [DOI] [PubMed] [Google Scholar]
- 19.Habermann E. Bee and wasp venoms. Science. 1972;177:314–322. doi: 10.1126/science.177.4046.314. [DOI] [PubMed] [Google Scholar]
- 20.Vogel H. Incorporation of melittin into phosphatidylcholine bilayers: Study of binding and conformational changes. FEBS Lett. 1981;134:37–42. doi: 10.1016/0014-5793(81)80545-5. [DOI] [PubMed] [Google Scholar]
- 21.Kuchinka E, Seelig J. Interaction of melittin with phosphatidylcholine membranes. Binding isotherm and lipid head-group conformation. Biochemistry. 1989;28 :4216–4221. doi: 10.1021/bi00436a014. [DOI] [PubMed] [Google Scholar]
- 22.Beschiaschvili G, Baeuerle HD. Effective charge of melittin upon interaction with POPC vesicles. Biochim Biophys Acta. 1991;1068:195–200. doi: 10.1016/0005-2736(91)90210-y. [DOI] [PubMed] [Google Scholar]
- 23.Ladokhin AS, White SH. Folding of amphipathic α-helices on membranes: Energetics of helix formation by melittin. J Mol Biol. 1999;285:1363–1369. doi: 10.1006/jmbi.1998.2346. [DOI] [PubMed] [Google Scholar]
- 24.Oren Z, Shai Y. Selective lysis of bacteria but not mammalian cells by diastereomers of melittin: Structure-function study. Biochemistry. 1997;36:1826–1835. doi: 10.1021/bi962507l. [DOI] [PubMed] [Google Scholar]
- 25.Wieprecht T, Apostolov O, Beyermann M, Seelig J. Thermodynamics of the α-helix-coil transition of amphipathic peptides in a membrane environment: Implications for the peptide-membrane binding equilibrium. J Mol Biol. 1999;294:785–794. doi: 10.1006/jmbi.1999.3268. [DOI] [PubMed] [Google Scholar]
- 26.Li Y, Han X, Tamm LK. Thermodynamics of fusion peptide-membrane interactions. Biochemistry. 2003;42:7245–7251. doi: 10.1021/bi0341760. [DOI] [PubMed] [Google Scholar]
- 27.Dathe M, Schümann M, Wieprecht T, Winkler A, Beyermann M, Krause E, Matsuzaki K, Murase O, Bienert M. Peptide helicity and membrane surface charge modulate the balance of electrostatic and hydrophobic interactions with lipid bilayers and biological membranes. Biochemistry. 1996;35:12612–12622. doi: 10.1021/bi960835f. [DOI] [PubMed] [Google Scholar]
- 28.Ladokhin AS, White SH. Protein chemistry at membrane interfaces: Non-additivity of electrostatic and hydrophobic interactions. J Mol Biol. 2001;309:543–552. doi: 10.1006/jmbi.2001.4684. [DOI] [PubMed] [Google Scholar]
- 29.Chakrabartty A, Baldwin RL. Stability of α-helices. Adv Protein Chem. 1995;46:141–176. [PubMed] [Google Scholar]
- 30.White SH, Wimley WC. Membrane protein folding and stability: Physical principles. Annu Rev Biophys Biomol Struc. 1999;28:319–365. doi: 10.1146/annurev.biophys.28.1.319. [DOI] [PubMed] [Google Scholar]
- 31.Ladokhin AS, White SH. Interfacial folding and membrane insertion of a designed helical peptide. Biochemistry. 2004;43:5782–5791. doi: 10.1021/bi0361259. [DOI] [PubMed] [Google Scholar]
- 32.Hristova K, White SH. An experiment-based algorithm for predicting the partitioning of unfolded peptides into phosphatidylcholine bilayer interfaces. Biochemistry. 2005;44:12614–12619. doi: 10.1021/bi051193b. [DOI] [PubMed] [Google Scholar]
- 33.Hirota N, Mizuno K, Goto Y. Cooperative α-helix formation of β-lactoglobulin and melittin induced by hexafluoroisopropanol. Protein Sci. 1997;6:416–421. doi: 10.1002/pro.5560060218. [DOI] [PMC free article] [PubMed] [Google Scholar]
- 34.Hirota N, Mizuno K, Goto Y. Group additive contributions to the alcohol-induced α-helix formation of melittin: Implication for the mechanism of the alcohol effects on proteins. J Mol Biol. 1998;275:365–378. doi: 10.1006/jmbi.1997.1468. [DOI] [PubMed] [Google Scholar]
- 35.Ladokhin AS, Jayasinghe S, White SH. How to measure and analyze tryptophan fluorescence in membranes properly, and why bother? Anal Biochem. 2000;285:235–245. doi: 10.1006/abio.2000.4773. [DOI] [PubMed] [Google Scholar]
- 36.Serrano L. The relationship between sequence and structure in elementary folding units. Adv Protein Chem. 2000;53:49–85. doi: 10.1016/s0065-3233(00)53002-2. [DOI] [PubMed] [Google Scholar]
- 37.Chakrabartty A, Kortemme T, Padmanabhan S, Baldwin RL. Aromatic side-chain contribution to the far-ultraviolet circular dichroism of helical peptides and its effect on measurement of helix propensities. Biochemistry. 1993;32:5560–5565. doi: 10.1021/bi00072a010. [DOI] [PubMed] [Google Scholar]
- 38.Hessa T, Kim H, Bihlmaier K, Lundin C, Boekel J, Andersson H, Nilsson IM, White SH, von Heijne G. Recognition of transmembrane helices by the endoplasmic reticulum translocon. Nature. 2005;433:377–381. doi: 10.1038/nature03216. [DOI] [PubMed] [Google Scholar]
- 39.White SH, Wimley WC, Ladokhin AS, Hristova K. Protein folding in membranes: Determining the energetics of peptide-bilayer interactions. Meth Enzymol. 1998;295:62–87. doi: 10.1016/s0076-6879(98)95035-2. [DOI] [PubMed] [Google Scholar]
- 40.Rohl CA, Chakrabartty A, Baldwin RL. Helix propagation and N-cap propensities of the amino acids measured in alanine-based peptides in 40 volume percent trifluoroethanol. Protein Sci. 1996;5:2623–2637. doi: 10.1002/pro.5560051225. [DOI] [PMC free article] [PubMed] [Google Scholar]
- 41.Padmanabhan S, Baldwin RL. Tests for helix-stabilizing interactions between various nonpolar side chains in alanine-based peptides. Protein Sci. 1994;3:1992–1997. doi: 10.1002/pro.5560031111. [DOI] [PMC free article] [PubMed] [Google Scholar]
- 42.Klingler TM, Brutlag DL. Discovering structural correlations in α-helices. Protein Sci. 1994;3:1847–1857. doi: 10.1002/pro.5560031024. [DOI] [PMC free article] [PubMed] [Google Scholar]
- 43.Creamer TP, Rose GD. Interactions between hydrophobic side chains within α-helices. Protein Sci. 1995;4:1305–1314. doi: 10.1002/pro.5560040706. [DOI] [PMC free article] [PubMed] [Google Scholar]
- 44.Avbelj F, Fele L. Role of main-chain electrostatics, hydrophobic effect and side-chain conformational entropy in determining the secondary structure of proteins. J Mol Biol. 1998;279:665–684. doi: 10.1006/jmbi.1998.1792. [DOI] [PubMed] [Google Scholar]
- 45.Luo P, Baldwin RL. Origin of the different strengths of the (i,i+4) and (i,i+3) leucine pair interactions in helices. Biophys Chem. 2002;96:103–108. doi: 10.1016/s0301-4622(02)00010-8. [DOI] [PubMed] [Google Scholar]
- 46.Muñoz V, Serrano L. Elucidating the folding problem of helical peptides using empirical parameters. II. Helix macrodipole effects and rational modification of the helical content of natural peptides. J Mol Biol. 1995;245:275–296. doi: 10.1006/jmbi.1994.0023. [DOI] [PubMed] [Google Scholar]
- 47.Muñoz V, Serrano L. Elucidating the folding problem of helical peptides using empirical parameters. III. Temperature and pH dependence. J Mol Biol. 1995;245:297–308. doi: 10.1006/jmbi.1994.0024. [DOI] [PubMed] [Google Scholar]
- 48.Muñoz V, Serrano L. Development of the multiple sequence approximation within the AGADIR model of α-helix formation: Comparison with Zimm-Bragg and Lifson-Roig formalisms. Biopolymers. 1997;41:495–509. doi: 10.1002/(SICI)1097-0282(19970415)41:5<495::AID-BIP2>3.0.CO;2-H. [DOI] [PubMed] [Google Scholar]
- 49.Lacroix E, Viguera AR, Serrano L. Elucidating the folding problem of α-helices: Local motifs, long-range electrostatics, ionic-strength dependence and prediction of NMR parameters. J Mol Biol. 1998;284:173–191. doi: 10.1006/jmbi.1998.2145. [DOI] [PubMed] [Google Scholar]
- 50.McLaughlin S. The electrostatic properties of membranes. Ann Rev Biophys Biophys Chem. 1989;18:113–136. doi: 10.1146/annurev.bb.18.060189.000553. [DOI] [PubMed] [Google Scholar]
- 51.Stewart JM, Young JD. Solid Phase Peptide Synthesis. Pierce; Rockford, IL: 1984. [Google Scholar]
- 52.Mayer LD, Hope MJ, Cullis PR. Vesicles of variable sizes produced by a rapid extrusion procedure. Biochim Biophys Acta. 1986;858:161–168. doi: 10.1016/0005-2736(86)90302-0. [DOI] [PubMed] [Google Scholar]
- 53.Chen YH, Yang JT, Chau KH. Determination of the helix and β form of proteins in aqueous solution by circular dichroism. Biochemistry. 1974;13:3350–3359. doi: 10.1021/bi00713a027. [DOI] [PubMed] [Google Scholar]
- 54.Eisenberg D, Weiss RM, Terwilliger TC. The hydrophobic moment detects periodicity in protein hydrophobicity. Proc Natl Acad Sci USA. 1984;81:140–144. doi: 10.1073/pnas.81.1.140. [DOI] [PMC free article] [PubMed] [Google Scholar]
- 55.Benz RW, Nanda H, Castro-Román F, White SH, Tobias DJ. Diffraction-based density restraints for membrane and membrane/protein molecular dynamics simulations. Biophys J. 2006;91:3617–3629. doi: 10.1529/biophysj.106.084483. [DOI] [PMC free article] [PubMed] [Google Scholar]
- 56.Humphrey W, Dalke W, Schulten K. VMD: Visual molecular dynamics. J Mol Graph. 1996;14:33–38. doi: 10.1016/0263-7855(96)00018-5. [DOI] [PubMed] [Google Scholar]
Associated Data
This section collects any data citations, data availability statements, or supplementary materials included in this article.
Supplementary Materials
Supplementary Data
Supplementary data associated with this article can be found in the online version.