

Abstract
The ability to react rapidly and efficiently to adverse stimuli is crucial for survival. Neuroscience and behavioral studies have converged to show that visual information associated with aversive content is processed quickly and accurately and is associated with rapid amplification of the neural responses. In particular, unpleasant visual information has repeatedly been shown to evoke increased cortical activity during early visual processing between 60 and 120 milliseconds following the onset of a stimulus. However, the nature of these early responses is not well understood. Using neutral versus unpleasant colored pictures, the current report examines the time course of short-term changes in the human visual cortex when a subject is repeatedly exposed to simple grating stimuli in a classical conditioning paradigm. We analyzed changes in amplitude and synchrony of large-scale oscillatory activity across two days of testing, which included baseline measurements, 2 conditioning sessions, and a final extinction session. We found a gradual increase in amplitude and synchrony of very early cortical oscillations in the 20–35 Hz range across conditioning sessions, specifically for conditioned stimuli predicting aversive visual events. This increase for conditioned stimuli affected stimulus-locked cortical oscillations at a latency of around 60–90 ms and disappeared during extinction. Our findings suggest that reorganization of neural connectivity on the level of the visual cortex acts to optimize early perception of specific features indicative of emotional relevance.
Keywords: Electroencephalography, Classical Conditioning, Emotion, Perception, Large-Scale Brain Oscillations, Adaptation
Introduction
The rapid allocation of perceptual resources to unpleasant stimuli has been a robust finding in experimental psychology as well as the cognitive neurosciences (Vuilleumier, 2005). Recently, electrophysiological studies in humans have converged to suggest that amplitude enhancement of visual evoked potentials in response to unpleasant stimuli can be observed on a low level in the visual cortex with differential responses being seen as early as 60–100 ms after stimulus onset (Pourtois et al., 2004; Stolarova et al., 2006). In addition, intracranial recordings from humans have indicated that unpleasant information differentially activates the amygdala (Oya et al., 2002) and the prefrontal cortex (Kawasaki et al., 2001) at intervals between 100 and 200 milliseconds post-stimulus, lending support to notions of early discrimination of aversive stimuli. Given the relatively slow speed of classical pathways described for fine-grained visual analysis (Riesenhuber and Poggio, 1999), the question arises as to the neural mechanisms mediating such rapid discrimination. In particular, extensive analysis of stimulus features in the ventral visual stream is time-consuming, and thus at variance with the rapid detection and identification of aversive stimuli. Several studies have discussed the potential role of deep structures, particularly the amygdaloid complex, in the rapid detection of threat (Morris et al., 1999). Support for this notion has come from studies showing that amygdala-lesioned patients do not benefit from unpleasant stimulus content in rapid identification paradigms (Anderson and Phelps, 2001). Furthermore, cortically blind patients show sensitivity to visual cues predicting aversive electric shock (Hamm et al., 2003), which has been attributed to non-lemniscal pathways as shown in the animal model (Shi and Davis, 2001).
Alternative explanations may draw from recent discussions of short-term adaptation of visual cortical networks to environmental contingencies (Tolias et al., 2005). Such mechanisms may act to enhance emotional perception in a similar manner as hypothesized in the case of attention or perceptual learning, employing changes in network connectivity, synaptic weights, or neuronal gains, among others (e.g., Schwabe and Obermayer, 2005). In recent animal studies, context and experience have been shown to affect initial responses on the level of the primary visual cortex of the monkey (Li et al., 2004), which parallels findings in the auditory (Weinberger, 2004) and somatosensory (Blake et al., 2005) system in human and non-human subjects. Importantly, changing the predictive value of a simple visual stimulus for food outcome in rats affected the way V1 neurons responded to that stimulus (Shuler and Bear, 2006). While the processes mediating such adaptation in visual cortex are largely unknown, there is increasing evidence that changes in neural connectivity at microscopic (Fox and Wong, 2005) and macroscopic levels (Büchel et al., 1999) play an important role. The present study examines the time course of changes in oscillatory activity and phase synchrony on the macroscopic level of human visual cortex in a classical delayed conditioning procedure. By investigating modulation of early visual oscillatory responses within a controlled learning paradigm, we aimed to examine experience-dependent adaptation in the human visual cortex on a macroscopic level. As opposed to a previous study with the same experimental design (Stolarova et al., 2006), we focused on changes of very early electrocortical processes across learning blocks. We expected that the cortical representation of simple features predicting aversive consequences would be strengthened as a function of exposure to contingencies and that this process would be accompanied by increased amplitude and phase synchrony on the level of visual cortex. To examine this hypothesis, participants were presented with a differential delayed classical conditioning paradigm within the visual modality, pairing neutral visual stimuli (black and white gratings) with pictures from the International Affective Picture System (Bradley et al., 2005).
Materials and Methods
Participants
Twenty-one right-handed volunteers consented to participate in this experiment and received either course credit or a financial incentive of 20 €. One subject withdrew from the study. Four data sets were excluded from further processing due to insufficient numbers of trials (< 50 trials) in one or more experimental conditions, because this would render time-frequency analyses unreliable. The data from 16 participants with normal or corrected-to-normal vision (9 male, age range 21–29 years, mean age 25.4) were included in the final analysis. A subset of the present sample (n = 11 participants) was contained in a previous study (Stolarova et al., 2006), which used the same paradigm, but focused on Event-Related Potentials as a dependent variable (see Introduction).
Stimuli
120 pictures were selected from the International Affective Picture System (IAPS) based on their valence and arousal ratings. The 60 unpleasant pictures showed mutilated persons, attack scenes and disgusting objects (mean valence: 2.2, SD = 0.6; mean arousal: 6.1, SD = 0.8), the 60 neutral photographs depicted landscapes, people, objects and abstract patterns (mean valence: 5.9, SD = 0.7; mean arousal: 3.8, SD = 0.9). These two categories were designed to maximally differ in terms of both emotional valence and arousal, because only highly aversive pictures (in contrast with neural and/or slightly pleasant pictures) were expected to result in reliable conditioning. Further, 8-by-8 checkerboards of four different colors (black and bright red, black and dark red, black and bright green, and black and dark green) were designed such that they matched the affective pictures in size. The affective pictures and the checkerboard patterns were presented centrally on a 19 inch computer monitor with a refresh rate of 70 Hz and subtended a visual angle of 7.2° horizontally.
Two small black and white squares (visual angle horizontally: 2.2°) differing only in grating orientation (45° or 135°) were used as CS+ and CS−. They had a spatial frequency of 2.3 candela per degree, and the contrast was 100%. The gratings were flashed in the upper left or right visual field (eccentricity: 3.58°).
Procedure
The experimental design replicated the approach used by Stolarova and colleagues (2006), which consisted of four recording blocks: a baseline block, two consecutive conditioning blocks and an extinction block. During the conditioning blocks the grating pattern randomly designated as CS+ was presented together with the unpleasant and highly arousing photographs, used here as unconditioned stimuli (UCS). The other grating pattern (CS−) was shown along with the neutral, low arousing pictures, the presentation order was randomized. During the baseline and the extinction blocks the affective pictures were replaced by the checkerboard patterns described above. They were presented without any systematic relationship between grating pattern and checkerboard color, timing and presentation parameters of the affective pictures and the checkerboards were otherwise identical (see Figure 1 A).
Figure 1.
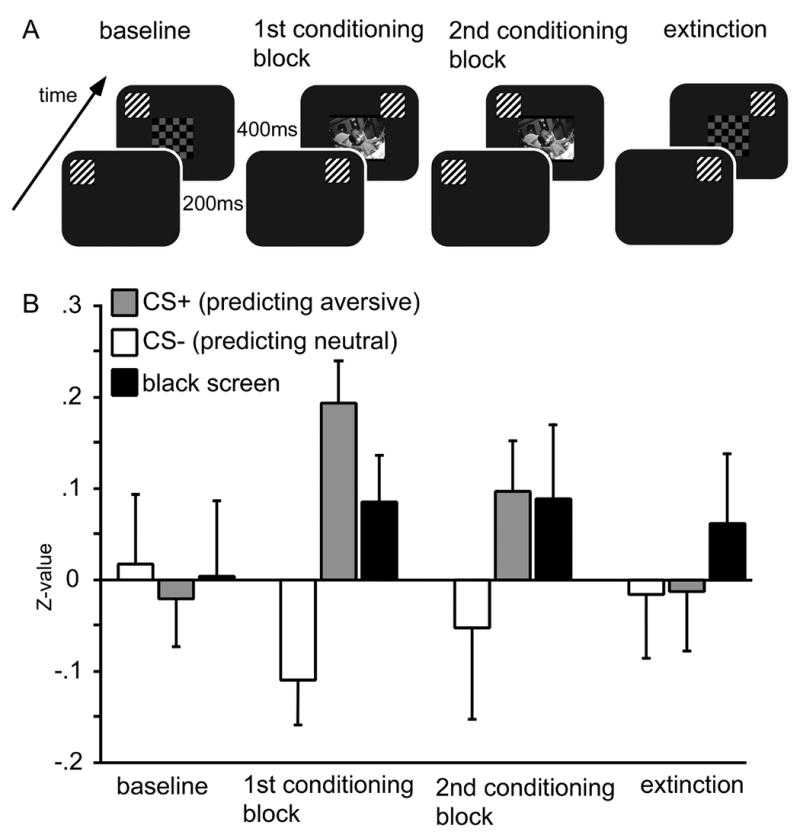
A: Design used for the four experimental blocks. During baseline and extinction blocks, grating stimuli having 45° or 135° degrees of orientation were paired with colored checkerboards after being presented alone for 200 ms. During two subsequent conditioning blocks, gratings were differentially paired with neutral or highly unpleasant affective pictures, thus serving as conditioned stimuli. B: Magnitude of the eye blink startle reflex as a function of experimental block, expressed as z-values. The magnitude of this defensive reflex increased specifically during viewing of gratings predicting aversive content in the two acquisition blocks. Startle was measured in specific trials with longer duration (i.e. 1500 ms) of grating stimuli. An average across 15 participants is shown, as startle data of one participant were lost because of equipment problems.
A total of 480 standard trials (grating followed by a checkerboard during baseline and extinction and by an IAPS-stimulus during conditioning) were presented in each of the four recording blocks, resulting in 120 trials per condition: grating orientation (45° or 135°) and visual hemifield (left or right) combination. In order to maintain attentiveness during the first and the last recording blocks, additional 60 target trials were included, during which participants were required to respond with a speeded button press to a checkerboard of a certain color in a go/no-go fashion. Thus, they were asked to respond manually (key press) to a bright red (green, counterbalanced across participants) checkerboard, and withhold manual responses in the remaining trials. Target stimuli appeared in 12.5 percent of trials. Subjects sat at a distance of 80 cm from the computer screen, they were asked to maintain fixation of a small white cross in the middle of the screen present at all times throughout recording. A chin rest was used to ensure consistency and to minimize head movements.
In both the standard and the target trials, the grating patterns (CS+ and CS−) were shown for a total of 600 ms. 200 ms after grating onset, an affective picture or a checkerboard appeared in the middle of the screen, the grating square remained attached to the upper left or right corner of the centrally presented stimulus for the rest of the trial (400 ms). The inter-trial interval (ITI) varied randomly between 400 ms and 1400 ms. The 120 affective pictures (60 unpleasant, 60 neutral) were repeated randomly 8 times across the two conditioning blocks, allowing for a total of 240 trials per affective category and conditioning block.
To measure the effects of conditioning on hedonic valence associated with viewing the gratings, 54 startle trials per block were included in the experiment (Lang et al., 1990). 18 startle probes were presented during randomly selected ITIs, 36 were delivered along with the conditioned stimuli in specific startle trials with prolonged stimulus duration (see below; 18 startles during the CS+ and 18 during the CS−) at varying times after grating onset (700, 800 or 900 ms). During the startle trials the gratings were shown for a total of 1500 ms and were followed by a prolonged variable ITI (650–1850 ms). To prevent learning of an association between the acoustic startle and the longer grating presentations, 60 trials with prolonged grating presentation (1500 ms) but without a startle probe were intermixed in each recording block.
The experiment was conducted in two sessions on two consecutive days at the same time of the day with each participant. On day one, informed consent was obtained, subjects filled out handedness questionnaires and their EEG and startle responses during the baseline block were recorded. On day 2 the conditioning blocks as well as the extinction block were recorded. Breaks were available between the different blocks, as well as in the middle of the extinction block, approximately every 15 to 20 min. In addition, during the break between the second conditioning block and the extinction block, subjects were asked to rate four grating patterns on a scale from 1 (most unpleasant) to 4 (most pleasant). Two of the grating patterns were identical with the ones used as CS+ and CS− (45° and 135° grating orientation), the other two were novel in the context of this experiment, and they had horizontal (180°) and vertical (90°) orientations. At the end of the extinction block participants were asked if they were aware of seeing two different grating patterns and if they had noticed any connection between the pictures and the gratings they saw. Finally, all participants viewed the 120 affective pictures used in the experiment in pseudo-randomized order and rated them on the dimensions affective valence and arousal, using a paper and pencil version of the Self-Assessment Manikin (SAM; Lang, 1980).
Electrophysiological data collection, data reduction and analyses
The EEG was recorded using an EGI 128-channel system, the vertex (Cz) was chosen as recording reference. The sampling rate was 250 Hz and impedances were kept below 50 k as recommended by the manufacturer. Data recording was constrained by 0.1 Hz high-pass and 100 Hz low-pass online filters. Artifact-free epochs (350 ms pre- and 500 ms post-stimulus onset) were obtained using the SCADS-procedure suggested by Junghöfer and colleagues (2000). The mean number of artifact free trials per condition was 84 for block 1, 86 for block 2, 87 for block 3 and 86 for block 4.
The artifact free epochs were projected to an estimated source space using the minimum norm (MN) method proposed by Hauk and collaborators (Hauk, 2004; Hauk et al., 2002). For this method, we used a 3D source space consisting of four concentric spheres, on which the dipoles were placed equidistantly to approximate the brain volume. This source space contained 655 source locations (i.e. the model sources). At each model source location, currents were modeled for three spatial orientations (2 radial, one tangential with respect to the scalp surface; orientations were orthogonal relative to each other). This was done to capture voltage gradients in all possible directions (Hauk, 2004). The four shells had the radii 0.8, 0.6, 0.4, and 0.2 relative to the electrode radius of 1, respectively. For regularization, we used the Tikhonov-Philips approach, which is optimized to suppress uncorrelated noise (Hauk, 2004). We selected the shell at 0.6 of the radius from our 3D source space in the MN analysis, as it represents a compromise between depth sensitivity and spatial resolution (Hauk et al., 2002). The amount of data was further reduced by selecting 129 model source locations, which were closest to the electrode positions. Wavelet analysis (see below) was run for each single epoch, for three source orientations at the 129 selected model source positions separately.
Wavelet analysis
Estimation of the time-varying spectrum by means of Morlet wavelets has been proposed by Bertrand and coworkers (Bertrand et al., 1994) and is described in detail elsewhere (Tallon-Baudry and Bertrand, 1999; Tallon-Baudry et al., 1998). Here, complex Morlet wavelets g were generated in the time domain for different analysis frequencies f0:
| (1) |
with A′ depending on the parameter σf, specifying the width of the wavelet in the frequency domain, the analysis frequency f0 and the user-selected ratio m:
| (2) |
with
| (3) |
A constant m = f0/σf = 7 was selected to achieve good time and frequency resolution in the frequency range of interest, which was 20 to 80 Hz in our study. It should be noted that time and frequency resolution for oscillations below 20 Hz is sub-optimum with the wavelet family employed here, and thus these frequencies are not reported in this study. Wavelets were normalized to have equal amounts of energy. After convolution with the source-space projected signal at 129 sites on the estimated cortical surface, two different procedures followed, to (i) obtain the evolutionary spectrum and (ii) measures of inter-site phase locking.
(i) Time-frequency distribution of spectral power
For each artifact-free epoch, time-varying energy in a given frequency band was obtained as the squared absolute value of the convolution of the cosine-square-tapered MNE signal with the wavelet. This was done separately for the three orientations of the MNE at each dipole site. Single trial time-by-frequency (TF) matrices were averaged in order to obtain the evolutionary spectrum for each source location, orientation, and experimental condition. After averaging, the model source orientations at each source location were combined as the Euclidean distance. An epoch from 280 to 100 ms prior to stimulus onset was used as an estimate of general noise. The mean of this baseline epoch was divided from TF matrices for each frequency and time point for each electrode, respectively. These change values were expressed as per cent change by subtracting one and multiplying by 100.
(ii) inter-site phase-locking
For each artifact-free epoch, the complex instantaneous phase was obtained by convolution of the source-space projected signal with the wavelet. Three adjacent (distance < 1 cm) source locations on the estimated brain surface, located at the occipital pole of the source space were selected as reference sites and were averaged to increase the signal-to-noise ratio. For each epoch, the difference between this regional mean and all other dipole sites for each frequency and time point was calculated, and the differences were averaged across trials to obtain a measure of inter-trial and inter-site phase stability, as described in (Lachaux et al., 1999). The values representing three dipole orientations at each site were combined by Fisher-z-transform and averaging. Subsequently, the mean of the baseline segment was divided from every frequency and time point, resulting in time by frequency maps for each site on the source space, which reflected the amount of phase locking between the site itself and the regional mean located in visual cortex. For amplitude and phase synchrony measures, we conducted repeated measures ANOVA with factors of block (baseline, acquisition 1, acquisition 2, extinction) and condition (CS+, CS−).
Startle Response
White noise bursts (50 ms; 90 dB) were used as acoustic startle probes and were delivered binaurally through headphones.
The startle responses were extracted from the vertical EOG-recordings of the right eye by subtracting the data recorded at the upper-eye electrode from the lower-eye electrode. The 54 startle trials recorded in each block were edited individually for each participant, artifact contaminated trials were omitted. The complete data sets of one participant were excluded due to absence of reliable startle responses. The startle magnitude was obtained by subtracting the peak amplitude within a 20–120 ms post-stimulus window from the mean of a 100 ms pre-stimulus baseline; the absolute values were then standardized within subjects to decrease inter-individual variability, and expressed as z-scores. Subsequently, we conducted repeated measures ANOVA with factors of block and condition to evaluate differences in the magnitude of the startle response.
Awareness and grating ratings
When asked at the end of the EEG recordings, 13 out of 16 participants were not aware of any systematic relationship between the gratings and the pictures they saw during the conditioning blocks, 10 participants reported not to have realized that two different kinds of gratings (45° and 135°) were shown. Nevertheless, 13 participants rated the stimulus used as CS+ as less pleasant than the one used as CS−, and no differences were found in any of the other comparisons, which included two stimuli not shown during the recordings (90° and 180° gratings). 16 age- and gender- matched controls were recruited to assess if any a priori differences in the affective valence of the four gratings existed. The analyses revealed no differences between the two grating patterns used here as CS+ and CS−. In terms of distractors, control participants rated the two distractor-gratings (90° and 180) as less pleasant (p < .05) than the 135° grating.
Results
Rating data
As expected, all participants rated unpleasant pictures as less pleasant (mean pleasure = 3.52, SD = 0.70) than the neutral exemplars (mean = 6.45, SD = 0.84; F(1,15) = 127.3, p < .001). Categories differed also with respect to self-rated arousal, which was higher for unpleasant pictures (mean = 6.45, SD = 1.09) than for neutral pictures (mean = 2.92, SD = 1.01; F(1,15) = 90.4, p < .001). Paralleling pleasure ratings, each participant indicated lower arousal for neutral pictures.
Startle response
To evaluate the effectiveness of classical conditioning, startle blink responses (elicited by a 90 dB auditory white noise) were recorded in each block using ocular electrodes. The startle response is a reliable measure of hedonic valence of foreground stimuli, which increases with unpleasant content and decreases with pleasantness (Lang, 1995). As expected, a reliable startle blink enhancement was found in response to the grating specifically predicting aversive scenes during and after learning (Block X Condition: F(6,90) = 2.6, p < .05; see Fig. 1 B). This specific enhancement for the grating predicting unpleasant content (i.e. the CS+) over the startle evoked during the CS− and ITI was most pronounced in the first conditioning block and was still present in the second conditioning block (F(2,30) = 3.2, p < .05), demonstrating that the participants associated the gratings with the neutral and unpleasant content, respectively.
Early oscillatory activity
A reliable early (60–90 ms following the onset of the conditioned stimulus) stimulus-locked oscillatory response in the frequency range between 18 and 35 Hz indicated initial oscillatory activity in visual cortex (see Figure 2 A). In addition to timing, the distribution of source densities suggested that this response was generated in the visual cortex (see Figure 2 B). This early cortical response was specifically enhanced for the CS+ stimuli during conditioning blocks, compared to baseline and extinction (Block X Condition: F(3, 45) = 4.1, p < .05; see Fig. 2 C). Importantly, this difference was greater in conditioning block 2 compared to block 1, indicating increased sensory amplification as a function of ongoing learning of the experimental contingencies (post-hoc ANOVA: F(1, 15) = 4.6, p < .05). No such effect was observed for the grating predicting neutral pictures. Likewise, other frequency ranges did not show differential amplitude increase in any of the conditions. Hemispheres did not differ regarding their sensitivity to blocks or conditions (all Fs < 1.5).
Figure 2.
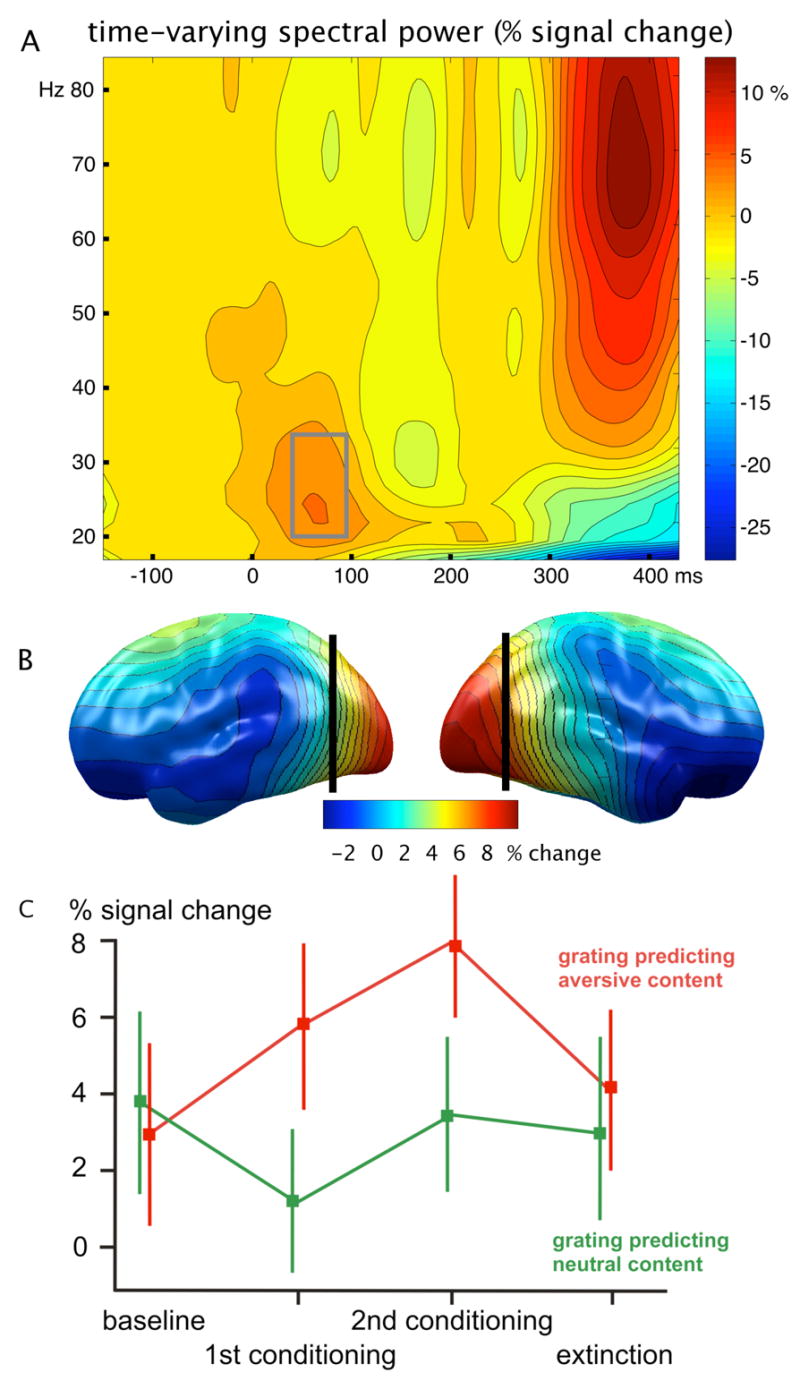
A: Baseline-corrected time-frequency representation of the visual oscillatory response recorded at posterior EEG sensors, across the four experimental blocks (baseline, 1st conditioning block, 2nd conditioning block, extinction). Power enhancement at frequencies between 18 and 35 Hz is visible at around 60–90 ms post-stimulus, reflecting early visual processing. B: Distribution of the early evoked oscillatory response, projected to a standard brain surface. Sites posterior to the vertical black lines entered the statistical analysis of time-varying spectral power and phase synchrony as a function of block and experimental condition. C: Power changes as a function of condition and block for this early response. An increase in oscillatory activity across time is shown for the response to gratings predicting aversive pictures, indicating that primary visual response is increasingly modulated as a function of aversive arousal. Bars indicate the standard error of the mean.
To measure changes in large-scale neural connectivity as a function of learning, we also examined inter-site phase synchrony between occipital areas and the remaining brain sites, in the same time-frequency range as described above. Synchrony between brain areas was determined by first calculating phase differences between brain regions in the frequency range of interest. These values were averaged across trials, yielding a measure of stability of phase differences between regions, as suggested by earlier work (Lachaux et al., 1999). Oscillatory activity originating from sources in medial visual cortex was used as a reference and synchrony at all other sites was measured relative to these (see above). Changes of inter-site synchrony with respect to a pre-stimulus baseline were expressed as percent change and entered statistical analysis. The resulting phase synchrony maps are shown in figure 3, suggesting specific enhancement of early cross-site synchrony within the extended visual cortex for the CS+ stimulus condition specifically. Paralleling results with the power measure, phase synchrony within visual regions increased across learning blocks, specifically for the grating stimulus predicting aversive scenes (F(3, 45) = 3.7, p < .05), and this difference was most pronounced in the second, compared to the first conditioning block, with both conditioning blocks showing greater synchrony than baseline and extinction (quadratic contrast, F(1,15) = 9.8, p < .01). No such effect was observed for gratings predicting neutral pictures (see figure 3). Again, cerebral hemispheres did not differ regarding their sensitivity to blocks or conditions (all Fs < 1.9).
Figure 3.
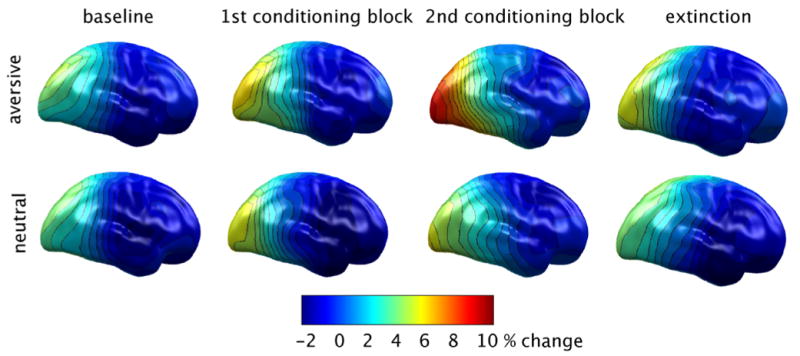
Phase synchrony maps showing the relative changes of synchrony between reference sites in visual cortex and the other regions examined here with respect to a pre-stimulus baseline. Areas of high synchrony with visual cortex are shown in red. Data reflect an average across 16 participants.
Late induced gamma activity
As can be seen in figure 1, there was a pronounced induced (i.e. non-phase-locked) gamma band modulation following the onset of the affective pictures by 150–250 ms. Paralleling the procedure for the early evoked oscillatory response, we evaluated the mean signal change in the respective time-frequency window (55–80 Hz; 350–420 ms post-CS) by means of ANOVA. Paralleling previous work with affective pictures presented to the visual hemifields (Keil et al., 2001) there was no evidence for affective modulation of the induced gamma activity in this time-frequency range. We observed however a significant effect of experimental block (F(3, 45) = 8.5, p < .01), which was due to an increase from baseline to the first acquisition and a subsequent decrease across the subsequent blocks (quadratic contrast, F(1,15) = 11.2, p < .01).
Discussion
The topic of rapidly directing perceptual resources to relevant features in the field of view has been a concern of recent studies examining Event-Related Potential (ERP) correlates of emotional perception. For instance, Pourtois and colleagues (Pourtois et al., 2004) employed a visual hemifield paradigm with covert orienting to emotional faces. For fearful compared to happy faces, these authors reported enhancement of the first detectable visual ERP deflection at 90 ms after stimulus onset, possibly originating in the striate cortex. They concluded that the emotional relevance of the stimuli might be associated with increased activation in the primary visual cortex, possibly due to an interaction with sub-cortical structures. Modulations of very early perceptual processing by affective scenes or faces are typically difficult to interpret because affective stimulus properties may be confounded with physical characteristics. Therefore, studies using conditioning approaches have been used to examine early affective perception and have suggested differential sensitivity to the CS+ and CS− at early and very early stages of visual analysis (Pizzagalli et al., 2003). Following on such findings, Stolarova and co-workers (2006) studied the temporal development of such early modulations across conditioning blocks. They presented grating patterns to the hemifields, paired with unpleasant or neutral pictures in a delayed classical conditioning paradigm, a procedure that was also used in the present study. This approach allows to control for the physical stimulus features of conditioned stimuli (i.e., grating patterns) and to explore the development of perceptual facilitation across blocks of trials, as a function of learning. As a main result, this study suggested greater amplitude of the visual ERP for CS+ stimuli versus CS− stimuli, occurring as early as 65 to 90 ms following stimulus onset. This difference between CS+ and CS−, although more widespread in the course of learning, did (i) not gradually increase in amplitude over blocks and (ii) is not indicative of differential synchrony as are measures of oscillatory activity. The present study therefore aimed to complement the ERP findings by examining the time course of large-scale oscillations during differential classical conditioning.
The present study focused on an early evoked oscillatory brain response in the upper beta/lower gamma range, which shows a high degree of phase consistency across trials and in the visual system tends to occur very early after onset of a stimulus (Tallon et al., 1995). As compared to the so-called induced gamma band response, this early phase-locked response has been associated with somewhat lower peak frequencies, often lying in the 20 to 40 Hz range (e.g., Herrmann et al., 2004; Tallon-Baudry et al., 1997). Because it peaks around 70–100 ms after onset of a stimulus, this measure is suited to examine low-level responses of the human visual cortex. Even in this early time range, however, caution is warranted in terms of the interpretation of the neural origin of this early response. ERP work in combination with current source estimations has suggested that in time segments after 70–75 ms, there is evidence for extra-striate sources contributing to the measured signal (Foxe and Simpson, 2002), which is in line with macaque data suggesting very rapid involvement of parietal and ventral cortex. As a consequence, modulations in the 70 to 90 ms range may reflect local network activity and re-entrant (i.e. top-down) modulation on a small scale, involving higher-order cortices to some degree as well. A related topic concerns the frequency range of this early phase-locked response as observed in our study. Most studies capitalizing on wavelet analysis of EEG epochs obtained in visual paradigms have reported somewhat higher peak frequencies (e.g., Herrmann et al., 1999). Data on evoked oscillations in humans with hemi- or quarter-field stimulation are scarce however, and future work may address in more depth the role of different frequencies in early large-scale visual cortical processing. A previous study with affective pictures presented to the visual hemifields found early evoked oscillations in a frequency range similar to the present one (Keil et al., 2001). Most interestingly, Axmacher and colleagues have recently suggested that synchronization at different frequencies may be related to different aspects of neuroplastic changes associated with memory formation (Axmacher et al., 2006). It is thus conceivable that the modulations observed in the present study may not only reflect altered perceptual processing but also the mechanism underlying the reorganization occurring as a consequence of learning the contingencies.
In the domain of auditory classical conditioning, research has shown learning induced plasticity in the receptive fields of the primary auditory areas in animals (Diamond and Weinberger, 1984; Weinberger, 2004) and humans (Morris et al., 1998). As a possible underlying mechanism for such fast experience dependent cortical reorganization, an increase in dopamine or acetylcholine release has been proposed, possibly leading to long-term potentiation and the strengthening of neural connectivity. A variety of studies (Li et al., 2004) implicate plasticity of visual cortex in perceptual learning and that changes in phase synchrony are typically related to changes in perception (Elbert and Keil, 2000). Adaptive changes of visual receptive fields, which are similar to the learning induced cortical adaptation in primary auditory areas, have repeatedly been reported (Gilbert et al., 2000; 2001), but the relevance of these findings for rapid emotional perception has been unclear. As compared to other studies of stimulus repetition in the visual system, which typically report repetition suppression across blocks (see e.g., Grill-Spector et al., 2006), we found increased amplitude and synchrony for the CS+ condition specifically, as long as the conditioning regime was maintained. This could be taken as evidence that networks involved in CS-processing quickly come to include additional sub-networks, a process similar to the one observed by Gruber and colleagues during rapid perceptual learning (Gruber et al., 2002) or during repeated presentation of unfamiliar objects (Gruber and Müller, 2005) Thus, learning to quickly respond to a stimulus associated with affective relevance may gradually increase the number of neurons in visual cortex that are coherently active in the presence of that stimulus. Caution is however warranted when interpreting synchrony maps derived from surface EEG. Although amplitude and phase are mathematically independent, it is conceivably that synchrony is more pronounced between source regions showing good signal-to-noise, i.e., high amplitude. Thus synchrony maps would nodd greatly add to amplitude data and would not indicate specific changes in synchrony. In the present data, there is however a pronounced difference between power and synchrony maps, which made us report synchrony findings in the present study. As can be seen in figure 2, power maps show a small but still clear frontal maximum throughout conditions, which is not at all present in the synchrony maps. It is thus unlikely that synchrony just mirrors amplitude
When comparing the time course of startle modulation and spectral changes, there is a gradual enhancement for the CS+ evoked oscillatory response, but a decrease in the overall startle amplitude, which might suggest lack of differential affective responding in the second acquisition block. As an alternative explanation, startle data tend to habituate relatively quickly (Bradley et al., 1993) and it is likely that after 54 startle trials in the first conditioning block, the startle amplitude decreased and differential affective responding between stimulus categories was not obvious in startle recording during the second conditioning block. Self-report data (preference rankings for CS stimuli) solicited by each participant at the end of the second conditioning block showed highly significant dislike for the CS+ in almost all participants however, even in the absence of awareness for the experimental contingencies. This latter finding corroborates the assumption that differential conditioning was achieved across blocks, and was accompanied by selective increase of amplitude and synchrony.
The present work demonstrates that the initial sensory response in the human visual cortex is sensitive to simple features associated with emotionality and that the amplification of this response increases as a function of experience. This finding is associated with a specific enhancement in large-scale synchrony within the extended visual cortex. Based on previous experience and based on knowledge about context properties, the emotional brain may thus constantly adapt to key features of relevant stimuli. Continuous adaptation and optimization of the visual system may thus enable observers to efficiently react to potential threat stimuli at the earliest stages possible.
Acknowledgments
This research was supported by grants from the Deutsche For schungsgemeinschaft to AK. The authors would like to thank Sabine Heim for helpful advice on an earlier version of the manuscript.
Footnotes
Previous work with real EEG and simulated data suggested that the Minimum Norm Estimate (MNE) represent an adequate means to avoid misinterpretation of topographical distributions derived from time-frequency data (Hauk et al., 2002). Specifically, simulations showed that multiple topographical maxima of amplitude/power maps may reflect tangential source configuration. For instance, a posterior dipolar source may project to posterior an anterior electrode sites, with amplitude being enhanced at both sites, but phase being reversed (Hauk et al., 2002). The MNE helped to reduce distortions due to this common problem and yielded near-optimum spatial representations of the simulated signal. Here, we conducted all analyses in MNE space, because signal space analyses of the present data showed strong frontal maxima in the time-frequency windows of interest. When testing for phase differences across scalp sites, these frontal maxima were not statistically different (Rayleigh test; e.g., Keil et al., 2005) from posterior phase shifted by 180°. Thus, we felt that the MNE representation is less prone to misinterpretation of the spatial distribution of time-frequency data.
Publisher's Disclaimer: This is a PDF file of an unedited manuscript that has been accepted for publication. As a service to our customers we are providing this early version of the manuscript. The manuscript will undergo copyediting, typesetting, and review of the resulting proof before it is published in its final citable form. Please note that during the production process errors may be discovered which could affect the content, and all legal disclaimers that apply to the journal pertain.
References
- Anderson AK, Phelps EA. Lesions of the human amygdala impair enhanced perception of emotionally salient events. Nature. 2001;411:305–309. doi: 10.1038/35077083. [DOI] [PubMed] [Google Scholar]
- Axmacher N, Mormann F, Fernandez G, Elger CE, Fell J. Memory formation by neuronal synchronization. Brain Res Brain Res Rev. 2006;52:170–182. doi: 10.1016/j.brainresrev.2006.01.007. [DOI] [PubMed] [Google Scholar]
- Bertrand O, Bohorquez J, Pernier J. Time-frequency digital filtering based on an invertible wavelet transform: an application to evoked potentials. IEEE Trans Biomed Eng. 1994;41:77–88. doi: 10.1109/10.277274. [DOI] [PubMed] [Google Scholar]
- Blake DT, Strata F, Kempter R, Merzenich MM. Experience-dependent plasticity in S1 caused by noncoincident inputs. J Neurophysiol. 2005;94:2239–2250. doi: 10.1152/jn.00172.2005. [DOI] [PMC free article] [PubMed] [Google Scholar]
- Bradley MM, Cuthbert BN, Lang PJ. International Affective Picture System: Technical Manual and Affective Ratings. NIMH Center for the Study of Emotion and Attention; Gainesville, FL: 2005. [Google Scholar]
- Bradley MM, Lang PJ, Cuthbert BN. Emotion, novelty, and the startle reflex: habituation in humans. Behavioral Neuroscience. 1993;107:970–980. doi: 10.1037//0735-7044.107.6.970. [DOI] [PubMed] [Google Scholar]
- Büchel C, Coull JT, Friston KJ. The predictive value of changes in effective connectivity for human learning. Science. 1999;283:1538–1541. doi: 10.1126/science.283.5407.1538. [DOI] [PubMed] [Google Scholar]
- Diamond DM, Weinberger NM. Physiological plasticity of single neurons in auditory cortex of the cat during acquisition of the pupillary conditioned response: II. Secondary field (AII) Behav Neurosci. 1984;98:189–210. [PubMed] [Google Scholar]
- Elbert T, Keil A. Imaging in the fourth dimension. Nature. 2000;404:29–31. doi: 10.1038/35003682. [DOI] [PubMed] [Google Scholar]
- Fox K, Wong RO. A comparison of experience-dependent plasticity in the visual and somatosensory systems. Neuron. 2005;48:465–477. doi: 10.1016/j.neuron.2005.10.013. [DOI] [PubMed] [Google Scholar]
- Foxe JJ, Simpson GV. Flow of activation from V1 to frontal cortex in humans: a framework for defining “early” visual processing. Experimental Brain Research. 2002;142:139–150. doi: 10.1007/s00221-001-0906-7. [DOI] [PubMed] [Google Scholar]
- Gilbert C, Ito M, Kapadia M, Westheimer G. Interactions between attention, context and learning in primary visual cortex. Vision Res. 2000;40:1217–1226. doi: 10.1016/s0042-6989(99)00234-5. [DOI] [PubMed] [Google Scholar]
- Gilbert CD, Sigman M, Crist RE. The neural basis of perceptual learning. Neuron. 2001;31:681–697. doi: 10.1016/s0896-6273(01)00424-x. [DOI] [PubMed] [Google Scholar]
- Grill-Spector K, Henson R, Martin A. Repetition and the brain: neural models of stimulus-specific effects. Trends Cogn Sci. 2006;10:14–23. doi: 10.1016/j.tics.2005.11.006. [DOI] [PubMed] [Google Scholar]
- Gruber T, Muller MM. Oscillatory brain activity dissociates between associative stimulus content in a repetition priming task in the human EEG. Cereb Cortex. 2005;15:109–116. doi: 10.1093/cercor/bhh113. [DOI] [PubMed] [Google Scholar]
- Gruber T, Muller MM, Keil A. Modulation of induced gamma band responses in a perceptual learning task in the human EEG. J Cogn Neurosci. 2002;14:732–744. doi: 10.1162/08989290260138636. [DOI] [PubMed] [Google Scholar]
- Hamm AO, Weike AI, Schupp HT, Treig T, Dressel A, Kessler C. Affective blindsight: intact fear conditioning to a visual cue in a cortically blind patient. Brain. 2003;126:267–275. doi: 10.1093/brain/awg037. [DOI] [PubMed] [Google Scholar]
- Hauk O. Keep it simple: a case for using classical minimum norm estimation in the analysis of EEG and MEG data. Neuroimage. 2004;21:1612–1621. doi: 10.1016/j.neuroimage.2003.12.018. [DOI] [PubMed] [Google Scholar]
- Hauk O, Keil A, Elbert T, Muller MM. Comparison of data transformation procedures to enhance topographical accuracy in time-series analysis of the human EEG. J Neurosci Methods. 2002;113:111–122. doi: 10.1016/s0165-0270(01)00484-8. [DOI] [PubMed] [Google Scholar]
- Herrmann CS, Lenz D, Junge S, Busch NA, Maess B. Memory-matches evoke human gamma-responses. BMC Neurosci. 2004;5:13. doi: 10.1186/1471-2202-5-13. [DOI] [PMC free article] [PubMed] [Google Scholar]
- Herrmann CS, Mecklinger A, Pfeifer E. Gamma responses and ERPs in a visual classification task. Clin Neurophysiol. 1999;110:636–642. doi: 10.1016/s1388-2457(99)00002-4. [DOI] [PubMed] [Google Scholar]
- Junghöfer M, Elbert T, Tucker DM, Rockstroh B. Statistical control of artifacts in dense array EEG/MEG studies. Psychophysiology. 2000;37:523–532. [PubMed] [Google Scholar]
- Kawasaki H, Kaufman O, Damasio H, Damasio AR, Granner M, Bakken H, Hori T, Howard MA, 3rd, Adolphs R. Single-neuron responses to emotional visual stimuli recorded in human ventral prefrontal cortex. Nat Neurosci. 2001;4:15–16. doi: 10.1038/82850. [DOI] [PubMed] [Google Scholar]
- Keil A, Moratti S, Sabatinelli D, Bradley MM, Lang PJ. Additive effects of emotional content and spatial selective attention on electrocortical facilitation. Cereb Cortex. 2005;15:1187–1197. doi: 10.1093/cercor/bhi001. [DOI] [PubMed] [Google Scholar]
- Keil A, Muller MM, Gruber T, Wienbruch C, Stolarova M, Elbert T. Effects of emotional arousal in the cerebral hemispheres: a study of oscillatory brain activity and event-related potentials. Clin Neurophysiol. 2001;112:2057–2068. doi: 10.1016/s1388-2457(01)00654-x. [DOI] [PubMed] [Google Scholar]
- Lachaux JP, Rodriguez E, Martinerie J, Varela FJ. Measuring phase synchrony in brain signals. Hum Brain Mapp. 1999;8:194–208. doi: 10.1002/(SICI)1097-0193(1999)8:4<194::AID-HBM4>3.0.CO;2-C. [DOI] [PMC free article] [PubMed] [Google Scholar]
- Lang PJ. Behavioral treatment and bio-behavioral assessment: Computer applications. In: Sidowski JB, Johnson JH, William TA, editors. Technology in mental health care delivery systems. Ablex; Norwood, NJ: 1980. pp. 119–137. [Google Scholar]
- Lang PJ. The emotion probe: Studies of motivation and attention. 102nd Annual Convention of the American Psychological Association Distinguished Scientific Contributions Award Address (1994, Los Angeles, California) American Psychologist. 1995;50:372–385. doi: 10.1037//0003-066x.50.5.372. [DOI] [PubMed] [Google Scholar]
- Lang PJ, Bradley MM, Cuthbert BN. Emotion, attention, and the startle reflex. Psychological Review. 1990;97:377–395. [PubMed] [Google Scholar]
- Li W, Piech V, Gilbert CD. Perceptual learning and top-down influences in primary visual cortex. Nat Neurosci. 2004;7:651–657. doi: 10.1038/nn1255. [DOI] [PMC free article] [PubMed] [Google Scholar]
- Morris JS, Friston KJ, Dolan RJ. Experience-dependent modulation of tonotopic neural responses in human auditory cortex. Proc Biol Sci. 1998;265:649–657. doi: 10.1098/rspb.1998.0343. [DOI] [PMC free article] [PubMed] [Google Scholar]
- Morris JS, Ohman A, Dolan RJ. A subcortical pathway to the right amygdala mediating “unseen” fear. Proc Natl Acad Sci U S A. 1999;96:1680–1685. doi: 10.1073/pnas.96.4.1680. [DOI] [PMC free article] [PubMed] [Google Scholar]
- Oya H, Kawasaki H, Howard MA, 3rd, Adolphs R. Electrophysiological responses in the human amygdala discriminate emotion categories of complex visual stimuli. J Neurosci. 2002;22:9502–9512. doi: 10.1523/JNEUROSCI.22-21-09502.2002. [DOI] [PMC free article] [PubMed] [Google Scholar]
- Pizzagalli DA, Greischar LL, Davidson RJ. Spatio-temporal dynamics of brain mechanisms in aversive classical conditioning: high-density event-related potential and brain electrical tomography analyses. Neuropsychologia. 2003;41:184–194. doi: 10.1016/s0028-3932(02)00148-3. [DOI] [PubMed] [Google Scholar]
- Pourtois G, Grandjean D, Sander D, Vuilleumier P. Electrophysiological correlates of rapid spatial orienting towards fearful faces. Cereb Cortex. 2004;14:619–633. doi: 10.1093/cercor/bhh023. [DOI] [PubMed] [Google Scholar]
- Riesenhuber M, Poggio T. Hierarchical models of object recognition in cortex. Nat Neurosci. 1999;2:1019–1025. doi: 10.1038/14819. [DOI] [PubMed] [Google Scholar]
- Schwabe L, Obermayer K. Adaptivity of tuning functions in a generic recurrent network model of a cortical hypercolumn. J Neurosci. 2005;25:3323–3332. doi: 10.1523/JNEUROSCI.4493-04.2005. [DOI] [PMC free article] [PubMed] [Google Scholar]
- Shi C, Davis M. Visual pathways involved in fear conditioning measured with fear-potentiated startle: behavioral and anatomic studies. J Neurosci. 2001;21:9844–9855. doi: 10.1523/JNEUROSCI.21-24-09844.2001. [DOI] [PMC free article] [PubMed] [Google Scholar]
- Shuler MG, Bear MF. Reward timing in the primary visual cortex. Science. 2006;311:1606–1609. doi: 10.1126/science.1123513. [DOI] [PubMed] [Google Scholar]
- Stolarova M, Keil A, Moratti S. Modulation of the C1 Visual Event-related Component by Conditioned Stimuli: Evidence for Sensory Plasticity in Early Affective Perception. Cereb Cortex. 2006;16:876–887. doi: 10.1093/cercor/bhj031. [DOI] [PubMed] [Google Scholar]
- Tallon C, Bertrand O, Bouchet P, Pernier J. Gamma-range activity evoked by coherent visual stimuli in humans. European Journal of Neuroscience. 1995;7:1285–1291. doi: 10.1111/j.1460-9568.1995.tb01118.x. [DOI] [PubMed] [Google Scholar]
- Tallon-Baudry C, Bertrand O. Oscillatory gamma activity in humans and its role in object representation. Trends in Cognitive Sciences. 1999;3:151–162. doi: 10.1016/s1364-6613(99)01299-1. [DOI] [PubMed] [Google Scholar]
- Tallon-Baudry C, Bertrand O, Delpuech C, Pernier J. Oscillatory gamma-band (30–70 Hz) activity induced by a visual search task in humans. Journal of Neuroscience. 1997;17:722–734. doi: 10.1523/JNEUROSCI.17-02-00722.1997. [DOI] [PMC free article] [PubMed] [Google Scholar]
- Tallon-Baudry C, Bertrand O, Peronnet F, Pernier J. Induced gamma-band activity during the delay of a visual short-term memory task in humans. Journal of Neuroscience. 1998;18:4244–4254. doi: 10.1523/JNEUROSCI.18-11-04244.1998. [DOI] [PMC free article] [PubMed] [Google Scholar]
- Tolias AS, Keliris GA, Smirnakis SM, Logothetis NK. Neurons in macaque area V4 acquire directional tuning after adaptation to motion stimuli. Nat Neurosci. 2005;8:591–593. doi: 10.1038/nn1446. [DOI] [PubMed] [Google Scholar]
- Vuilleumier P. How brains beware: neural mechanisms of emotional attention. Trends Cogn Sci. 2005;9:585–594. doi: 10.1016/j.tics.2005.10.011. [DOI] [PubMed] [Google Scholar]
- Weinberger NM. Specific long-term memory traces in primary auditory cortex. Nat Rev Neurosci. 2004;5:279–290. doi: 10.1038/nrn1366. [DOI] [PMC free article] [PubMed] [Google Scholar]