

Abstract
For many decades it has been thought that oxygen analogs (oxons) of organophosphorus insecticides phosphylate the catalytic site of acetylcholinesterase by a mechanism that follows simple Michaelis-Menten kinetics. More recently, the interactions of at least some oxons have been shown to be far more complex, and likely involve binding of oxons to a second site on acetylcholinesterase that modulates the inhibitory capacity of other oxon molecules at the catalytic site. The current study has investigated the interactions of chlorpyrifos oxon and methyl paraoxon with human recombinant acetylcholinesterase. Both chlorpyrifos oxon and methyl paraoxon were found to have ki’s that change as a function of oxon concentration. Furthermore, 10 nM chlorpyrifos oxon resulted in a transient increase in acetylthiocholine hydrolysis, followed by inhibition. Moreover, in the presence of 100 nM chlorpyrifos oxon, acetylthiocholine was found to influence both the Kd (binding affinity) and k2 (phosphorylation constant) of this oxon. Collectively, these results demonstrate that the interactions of chlorpyrifos oxon and methyl paraoxon with acetylcholinesterase cannot be described by simple Michaelis-Menten kinetics, but instead support the hypothesis that these oxons bind to a secondary site on acetylcholinesterase, leading to activation/inhibition of the catalytic site, depending on the nature of the substrate and inhibitor. Additionally, these data raise questions regarding the adequacy of estimating risk of low levels of insecticide exposure from direct extrapolation of insecticide dose-response curves since the capacity of individual oxon molecules at low oxon levels could be greater than individual oxon molecules in vivo associated with the dose response curve.
Keywords: organophosphorus insecticides, chlorpyrifos oxon, methyl paraoxon, acetylcholinesterase
Introduction
The interactions of acetylcholinesterase (EC 3.1.1.7) with acetylcholine and the surrogate substrate acetylthiocholine are complex, and have been shown to involve binding of substrate to the catalytic site as well as a secondary binding site known as the peripheral anionic site (Taylor and Radić, 1994, and Bourne et al, 2003). The catalytic triad (Ser-203, His-447, and Glu-334)(all numbers refer to the amino acid position of human acetylcholinesterase) has been shown to be located at the base of an active site gorge, with the peripheral anionic site on the rim of this gorge, including residues Tyr-72, Tyr-124, Trp-286, Tyr-341, and Asp-74 (Sussman et al, 1991; Barak et al, 1995; and Bourne et al, 2003). Interestingly, these two sites have been described as working in tandem, where occupation of the peripheral anionic site can decrease or increase activity at the catalytic site (Johnson et al, 2003). For example, at high concentrations both acetylcholine and acetylthiocholine have been shown to bind to the peripheral anionic site, leading to substrate inhibition as a result of reduced substrate hydrolysis through steric blockade and/or conformation changes in Trp-86 and Tyr-133 residues within the active site gorge (Taylor and Radić, 1994; Barak et al, 1995; and Bourne et al, 2003). Conversely, Szegletes et al 1999 have reported that cationic substrates can form a low affinity complex at the peripheral anionic site that accelerates hydrolysis at low substrate concentrations, but results in substrate inhibition at high concentrations (Mallender et al, 2000). Occupation of the peripheral anionic site of Drosophila acetylcholinesterase by D-tubocurarine has been shown to increase methanesulfonylation of the active site (Golicnik et al, 2002), whereas occupation of the peripheral anionic site of Drosophila acetylcholinesterase by Triton X-100 has been reported to increase and decrease inhibition brought about by certain organophosphates and carbamates (Marcel et al, 2000).
Given the obvious complexities involved in the interactions of acetylcholinesterase with various substrates and peripheral anionic site ligands, it should not be surprising that the inhibition of acetylcholinesterase by the active metabolites (called oxons or oxygen analogs) of at least some organophosphorus insecticides is not as simple as was originally thought. For many decades it was believed that oxons phosphylated Ser-203 of the active site, according to the simplest scheme in Figure 1.
Figure 1.
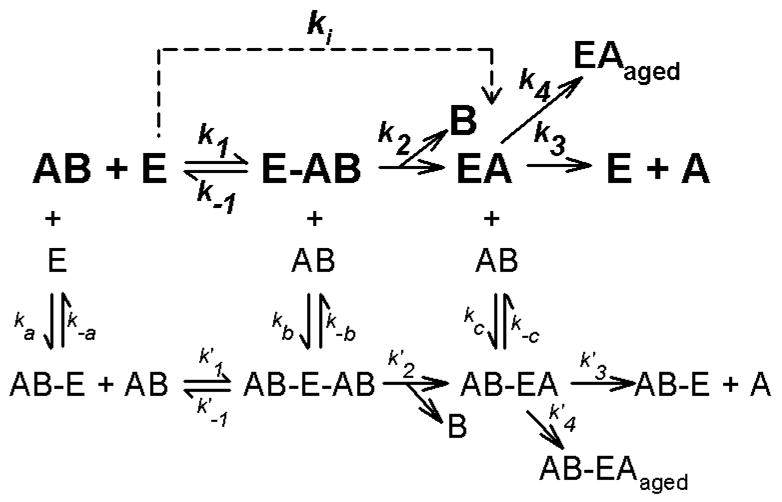
Kinetic schemes descriptive of the interactions of acetylthiocholine, acetylcholine, or organophosphorus insecticide oxons with acetylcholinesterase. In this scheme, E represents free acetylcholinesterase, while AB represents substrate or inhibitor. Ligand bound to a secondary site is indicated by AB–E, whereas the Michaelis complex is denoted by E-AB. EA represents acetylated or phosphorylated enzyme, and B depicts the leaving groups. EAaged designates aged, enzyme-inhibitor complex. The pathway in bold depicts the simplest kinetic scheme, utilized by Main (1964), where binding only occurs at the active site. Aging and reactivation are often ignored when k3 and k4 are small. The ki represents k2/Kd under pseudo first order conditions (Main, 1964). The additional, non-bold pathways show a much more complex kinetic scheme that includes reversible binding to a secondary site. In the case of acetylthiocholine (and acetylcholine) this secondary site is the peripheral anionic site. In the case of organophosphates no such secondary site has been identified, but is suggested on the basis of kinetic data.
Based on this scheme, Main (1964) introduced the inhibitory constant ki, which is defined as follows:
| Equation (1) |
where
| Equation (2) |
The rate constants k1, k−1, and k2 are the same as those shown in Figure 1. With this scheme, the value of ki is specific for each oxon, and correlates directly with the inhibitory capacity of an oxon. Additionally, this scheme dictates that a ki must be of constant value for any particular oxon. However, more recent studies have reported that under certain conditions, the kis of certain oxons change as a function of the oxon concentrations, indicating that the inhibitory capacities of these oxons change as a function of oxon concentration (Kardos and Sultatos, 2000, Kousba et al, 2004, and Rosenfeld and Sultatos, 2006). These reports have suggested that certain oxons might also reversibly bind to a secondary site on acetylcholinesterase, thereby reducing the capacity of additional oxon molecules from interacting with the active site, although it must be noted that no evidence has yet been presented that they bind to the peripheral anionic site.
The characterization of those factors that affect the capacity of oxons to inhibit acetylcholinesterase is an important step in understanding the risks posed to public health by organophosphorus insecticides since cholinergic crisis observed after exposure to these chemicals is mediated through inhibition of acetylcholinesterase (Mileson et al, 1998). The current report investigates concentration-dependent interactions of human recombinant acetylcholinesterase with chlorpyrifos oxon and methyl paraoxon, and investigates how the presence of substrate might influence the capacity of chlorpyrifos oxon to inhibit this important enzyme.
Materials and Methods
Chemicals
Chlorpyrifos oxon (O,O–diethyl O–(3,5,6-trichloro-2-pyridyl) phosphate) and methyl paraoxon (OO, -dimethyl O-(4-nitrophenyl) phosphate) were purchased from Chem Services (West Chester, PA). Human recombinant acetylcholinesterase, bovine serum albumin, and all other chemicals used were purchased from Sigma Chemical Company (St. Louis, MO).
Determination of ki by the ki model
Except where noted, each ki was determined as described by Rosenfeld and Sultatos (2006). All studies were done with 100 mM sodium phosphate buffer (pH 7.4) containing bovine serum albumin at a concentration of 1 mg/ml (Rosenfeld and Sultatos, 2006). With this approach, acetylcholinesterase was incubated with a specified concentration of inhibitor for specified periods of time. At each indicated time the reaction was stopped by dilution with a large volume containing 0.44 mM acetylthiocholine, and the Ellman reaction (Ellman et al, 1961) was monitored at 405 nm in a plate reader (BIO-TEK Instruments., Winoski, VT) in order to quantify uninhibited acetylcholinesterase activity (see Rosenfeld and Sultatos, 2006 for details of this methodology). The empirical data (uninhibited acetylcholinesterase active site concentration over time) were fitted with the software ACSL (Advanced Continuous Simulation Language, Aegis, Huntsville, AL) to the following equations, which were slightly modified from Rosenfeld and Sultatos (2006) in order to reflect the spontaneous breakdown of chlorpyrifos oxon and methyl paraoxon:
| Equation (3) |
| Equation (4) |
| Equation (5) |
| Equation (6) |
| Equation (7) |
As shown by Rosenfeld and Sultatos (2006), ET represents the initial active site concentration (determined as described by Rosenfeld and Sultatos, 2006), while ABT represents the initial chlorpyrifos oxon or methyl paraoxon concentrations. In addition k5 represents the first order rate constant for spontaneous decomposition of chlorpyrifos oxon or methyl paraoxon, and [ABsp] represents the concentration of oxon that has undergone spontaneous (non-enzymatic) decomposition. All other parameters used in equations 3–7 have the same meaning as those in Figure 1. The rate constants for activation (k3) and aging (k4) were taken from the literature, and were 0.005379 h−1 and 0.001575 h−1, respectively, for chlorpyrifos oxon (Masson et al, 2000), and 0.7 h−1 and 3.7 h−1, respectively, for methyl paraoxon (Worek et al, 2000). Some kis were also calculated by the traditional method of Main (1964), as described by Rosenfeld and Sultatos (2006).
Determination of the Kd and k2 for chlorpyrifos oxon
The determinations of Kd and k2 were accomplished by a technique termed the zero-time method (Gray and Duggleby, 1989), originally developed by Hart and O’Brien (1973). As described by Gray and Duggleby (1989), this approach determines these kinetic parameters by monitoring the hydrolysis of a single substrate (acetylthiocholine) concentration in the absence and presence of a single concentration of inhibitor (chlorpyrifos oxon). The Kd is determined from the following equation:
| Equation (8) |
Where vc is the control velocity (absence of inhibitor) and vo is the initial velocity in the presence of inhibitor. The vo was determined by first fitting thiocholine production with time to:
| Equation (9) |
where [P] and [P]∞ are concentrations of product (thiocholine) at any time t, and at t = ∞, respectively (Liu and Tsou, 1986, and Gray and Duggleby, 1989). The constant “A” represents the apparent rate constant for the formation of inhibited enzyme. The continually changing slopes of this progressive inhibition curve were obtained by cubic spline analysis of the fitted curve from Equation (9)(Barak et al, 1995). As described by Hart and O’Brien (1973), and Barak et al 1995, semilogarithmic plots of these slopes against time yielded straight lines, where the intercepts equal vo in Equation (8).
The Km for the breakdown of acetylthiocholine by acetylcholinesterase was determined as previously described (Rosenfeld et al, 2001) with the Haldane equation, since acetylthiocholine is known to display substrate inhibition (Radić et al, 1993). For Km determinations, hydrolysis of acetylthiocholine at 37° was followed in the presence of 0.1 mM 5,5′-dithio-bis(2-nitrobenzoic acid)(DTNB) in a Shimadzu MPS 2000 UV-Vis spectrophotometer (Shimadzu Scientific Instruments, Inc., Columbia, MD), set at a wavelength of 412 for acetylthiocholine. All co-incubations of chlorpyrifos oxon and acetylthiocholine were carried out at 24° or 37° in a SX20 stopped-flow spectophotometer (Applied Photophysics Limited, Leatherhead, United Kingdom). The instrument had a 20 μl flow cell with the light path set to 10 mm. The wavelength was set to 412 nm, with monochromator slit width openings of 5 mm. All solutions were prepared in 100 mM sodium phosphate buffer (pH 7.4) containing 1mg/ml bovine serum albumin (Rosenfeld and Sultatos, 2006). DTNB, which was included with the indicated acetylthiocholine concentrations, was added to give a final concentration in the flow cell of 1 mM. The concentrations of acetylthiocholine were selected so as not to exceed the Km of this substrate, thereby maintaining pseudo first order conditions (Hart and O’Brien, 1973). Additionally, hydrolysis of acetylthiocholine over time in all control incubations was linear.
Following determination of Kd, k2 was calculated from:
| Equation (10) |
where Δ(lnv)/Δt is the slope obtained from the semilogarithmic plot of the continually changing slopes of the progressive inhibition curve (Hart and O’Brien, 1973, and Barak et al, 1995), and where:
| Equation (11) |
Modeling and statistical analyses
All modeling studies for ki were carried out on a laptop or desktop computer using ACSL 11.8 (Advanced Continuous Simulation Language Aegis, Huntsville, AL). Statistical analyses and regression analyses were carried out with Sigmastat and Sigmaplot (SPSS Science Inc., Chicago, IL).
Results
Chlorpyrifos oxon or methyl paraoxon in buffer were incubated at 24° or 37° in the absence of enzyme for varying lengths of time. The chlorpyrifos oxon and methyl paraoxon levels were monitored by quantifying the capacity of a sample of the incubation to inhibit human recombinant acetylcholinesterase. Both oxons underwent non-enzymatic breakdown, as evidenced by the reduction in inhibitory capacity of samples from the incubations (Figure 2). These rates of breakdown could be described by first order rate constants (Figure 2), which were incorporated into the ki model in order to account for all oxon during incubations in the presence of enzyme.
Figure 2.
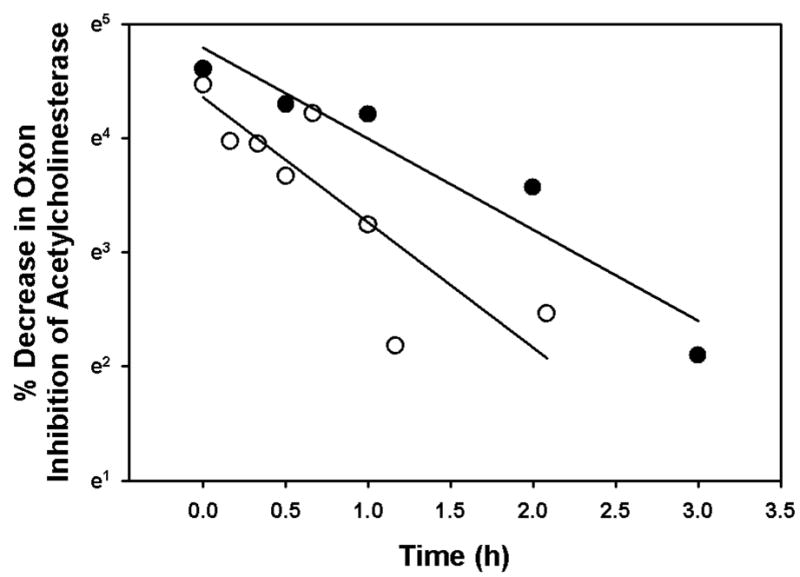
Spontaneous decomposition of chlorpyrifos oxon (filled circles) and methyl paraoxon (open circles) in the absence of enzyme at 37°. The levels of oxon within incubations were evaluated by measuring the capacity of a sample of the incubation to inhibit 75–80 pM acetylcholinesterase by the Ellman reaction (Ellman et al, 1961). The slopes represent first order rate constants that are added to the ki model to account for loss of each oxon as a result of spontaneous breakdown. This first order rate constant for chlorpyrifos oxon was 0.7967 h−1, while that for methyl paraoxon was 1.0975 h−1.
Incubation of human recombinant acetylcholinesterase with different concentrations of chlorpyrifos oxon or methyl paraoxon at 24° or 37° for various periods of time gave inhibition profiles that could be optimized with the ki model in order to determine the ki for each oxon (see Figure 3 for representative examples). A temperature of 24° was used because many previous ki determinations have been done at this temperature, while 37° was utilized because of its physiological significance. When the kis were determined in this manner with oxon concentrations ranging from about 2nM – 100 nM, it was found that the ki for each oxon varied as a function of oxon concentration (Figures 3 and 4). Note that a larger ki corresponds to a greater capacity to inhibit acetylcholinesterase. With both chlorpyrifos oxon and methyl paraoxon, at both 24° and 37°, the relationship between oxon concentration and ki was described by a rectangular hyberbola. The asymptotes obtained at the higher oxon concentrations corresponded well with the kis calculated by the traditional method of Main (1964)(Rosenfeld and Sultatos, 2006)(Figures 4 and 5).
Figure 3.
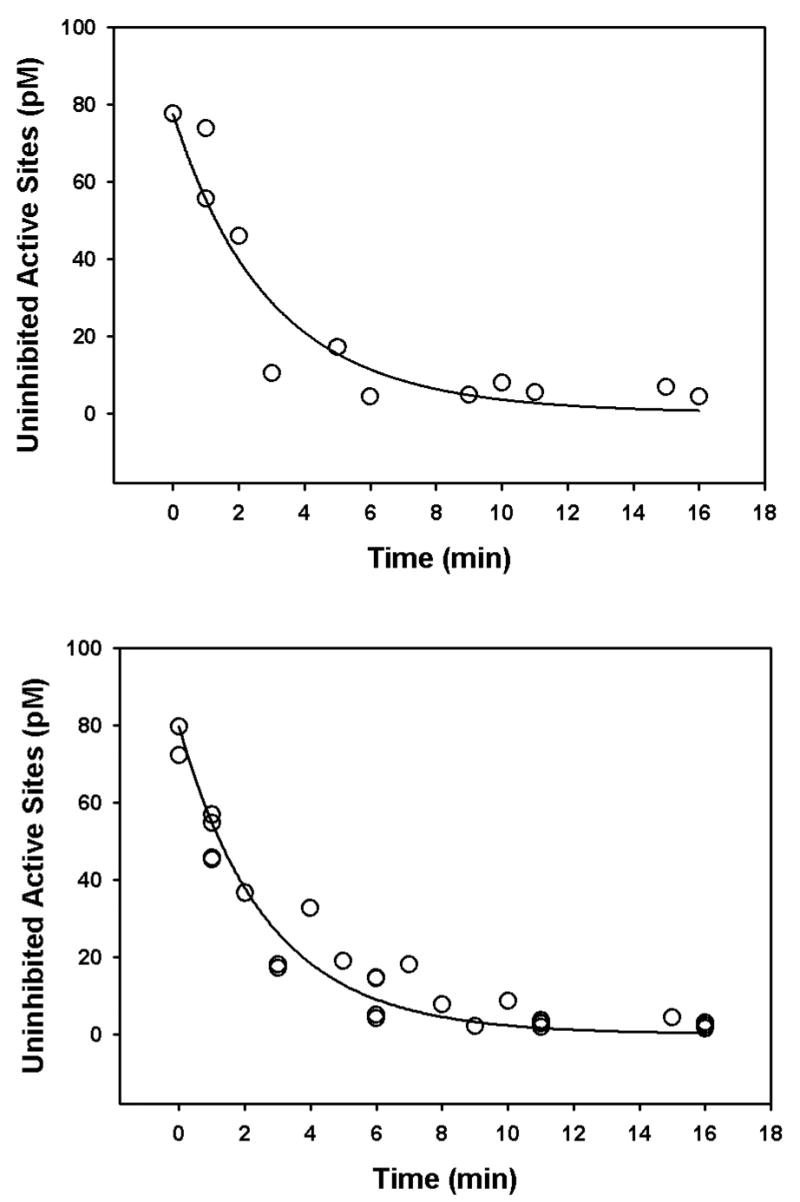
Representative examples of ki determinations with the ki model. The upper panel shows a ki determination for 2.5 nM methyl paraoxon at 37°, while the lower panel shows the ki determination for 2.5 nM chlorpyrifos oxon at 24°. The open circles represent the empirical data while the solid lines represent the best-fit for the ki model. The ki for methyl paraoxon was found to be 8.24 nM−1 h−1, whereas the ki for chlorpyrifos oxon was 9.08 nM−1 h−1.
Figure 4.
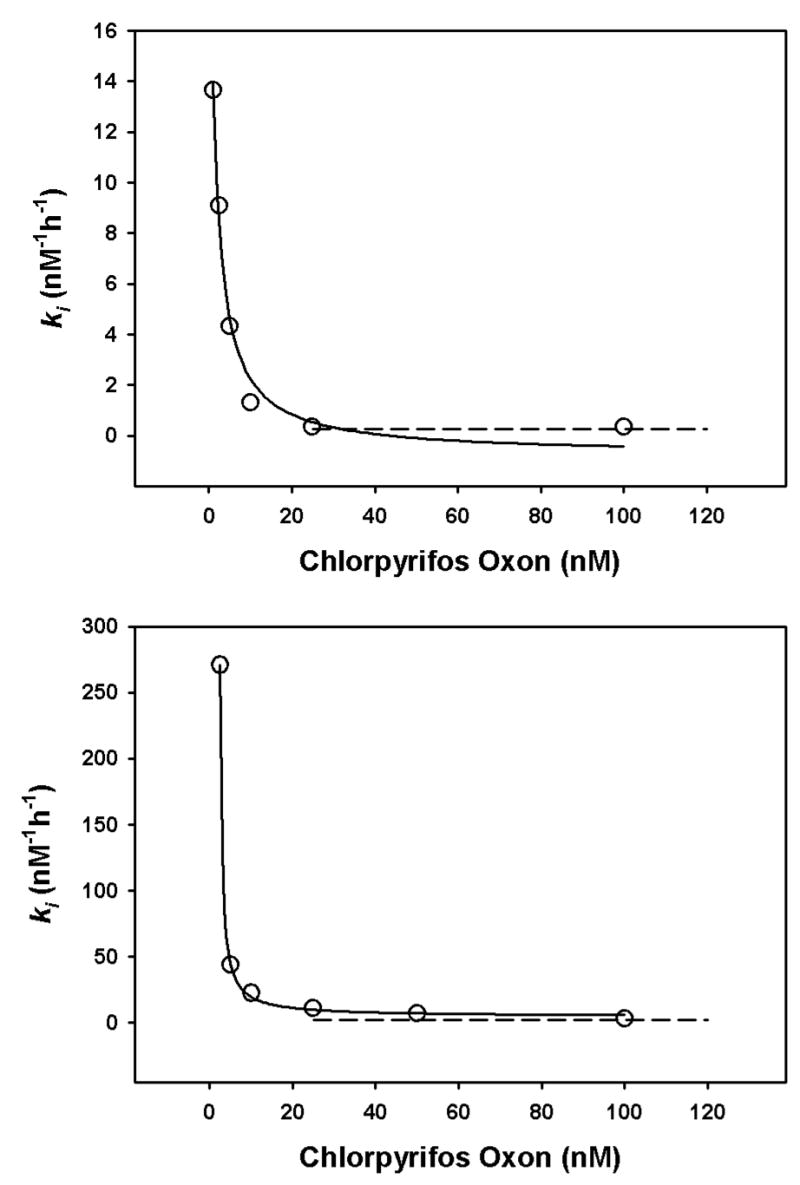
Relationship of ki and chlorpyrifos oxon concentration at 24° (upper panel, and 37° (lower panel). Each open circles depicts a ki determined from inhibition profiles containing at least 10 data points (such as in Figures 4), and the solid line is the best-fit line from the equation y=a/(x+b)+c. At 24°, a=33.97, b=1.13, and c=0.74, whereas at 37° a=118.81, b=2.05, and c=4.48. The dashed lines depict the kis determined by the traditional method of Main (1964), utilizing oxon concentrations greater than 20 nM.
Figure 5.
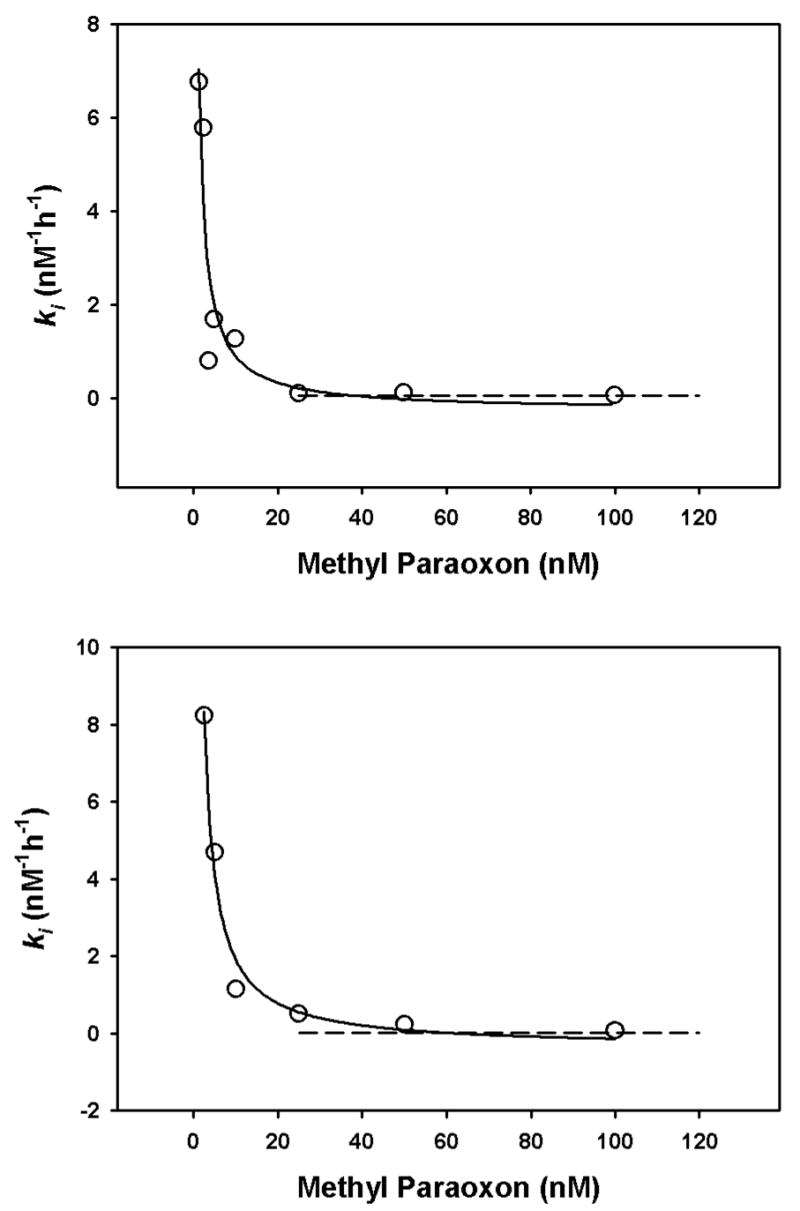
Relationship of ki and methyl paraoxon concentration at 24° (upper panel, and 37° (lower panel). Each open circles depicts a ki determined from inhibition profiles containing at least 10 data points (such as in Figures 4), and the solid line is the best-fit line from the equation y=a/(x+b)+c. At 24°, a=23.17, b=0.16, and c=−0.3651, whereas at 37° a=33.97, b=1.13, and c=0.74. The dashed lines depict the kis determined by the traditional method of Main (1964), utilizing oxon concentrations greater than 20 nM.
As described by Gray and Duggleby (1989), the zero-time method can be used to determine the Kd and k2 of an oxon towards acetylcholinesterase with a profile of acetylthiocholine hydrolysis at a single substrate and single inhibitor concentration (Hart and O’Brien, 1973). This approach requires knowledge of the Km for hydrolysis of acetylthiocholine by acetylcholinesterase (Equation 8), which was determined to be 0.1044 mM at 37° (Figure 6). The substrate inhibition observed at the higher concentrations of acetylthiocholine (Figure 6) has been previously reported, and involves binding of this surrogate substrate to the peripheral anionic site of acetylcholinesterase (Radić et al, 1993).
Figure 6.
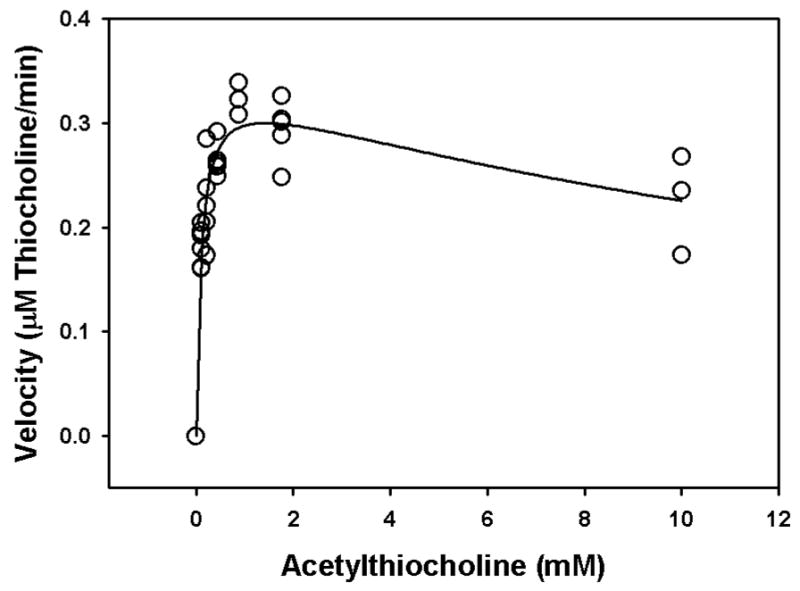
Determination of the Km for hydrolysis of acetylthiocholine by acetylcholinesterase. Each open circle is a single observation, whereas the solid line represents the best-fit of the Haldane equation (Radić et al, 1993). The Km = 0.1044 mM, Vmax = 0.3440 mM/min, and Kss = 19.4820 mM.
Hydrolysis of three different concentrations of acetylthiocholine in the presence of 100 nM chlorpyrifos oxon was quantified by stopped-flow spectrophotometry in order to minimize the error associated with the zero-time method (Gray and Duggleby, 1989). Figure 7 shows the product profiles with time, as well as the secondary plots from which the intercepts and slopes were taken for equations 8 and 10. Surprisingly, the appKd, appk2, and appki for chlorpyrifos oxon changed as a function of the acetylthiocholine concentration (Fig. 8). The lowest acetylthiocholine concentration utilized (0.01375 mM) yielded the highest appKd, appk2, and the lowest appki (Figure 8). With an acetylthiocholine concentration of 0.01375 mM, addition of 10 nM chlorpyrifos oxon unexpectedly, transiently elevated the velocity of acetylthiocholine hydrolysis (Figure 9). In this regard, for a period of time (51–81 s) following initiation of the incubation, acetylthiocholine hydrolysis rates in the presence of 10 nM chlorpyrifos oxon exceeded that of controls (without chlorpyrifos oxon)(Figure 9). This enhanced activity was reflected in the greater initial velocity, determined from the y intercepts in the lower panel of Figure 9, in the presence of 10 nM chlorpyrifos oxon (Figure 10).
Figure 7.
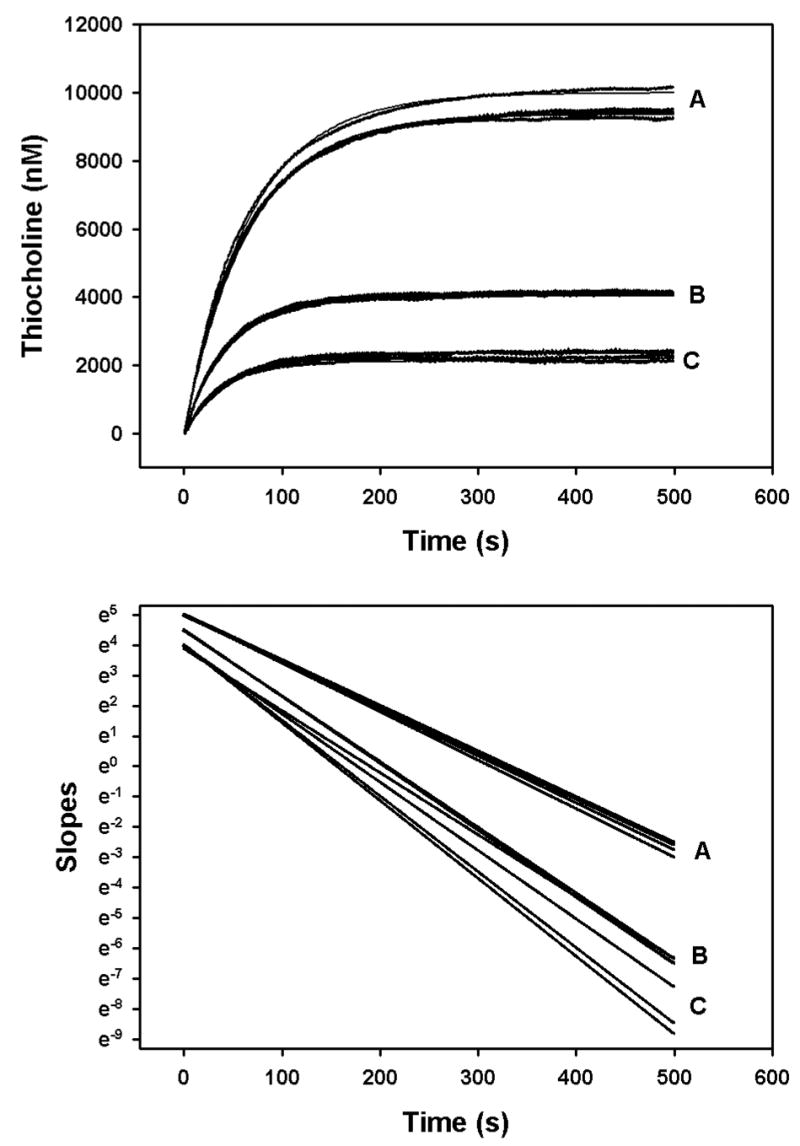
Primary plot (upper panel) and secondary plot (lower panel) for determination of Kd and k2 for 100 nM chlorpyrifos oxon by the zero-time method at 24°. The filled circles in the upper panel show the data generated by the stopped flow spectrophotometer, and the solid lines are the best-fit line as described under “Methods”. The acetylcholinesterase active site concentrations ranged from 13 – 15 pM within the mixing chamber. The concentrations of acetylthiocholine used were: 0.055 mM (designated as A); 0.0275 mM (designated as B); and 0.01375 mM (designated as C). The lines in the lower panel are the slopes of the fitted lines from the upper panel, determined by analysis with cubic splines (Barak et al, 1995). The slopes and intercepts of the lines in the lower panel were determined by linear regression analyses, and were used in Equations 8 and 10 to calculate Kd and k2.
Figure 8.
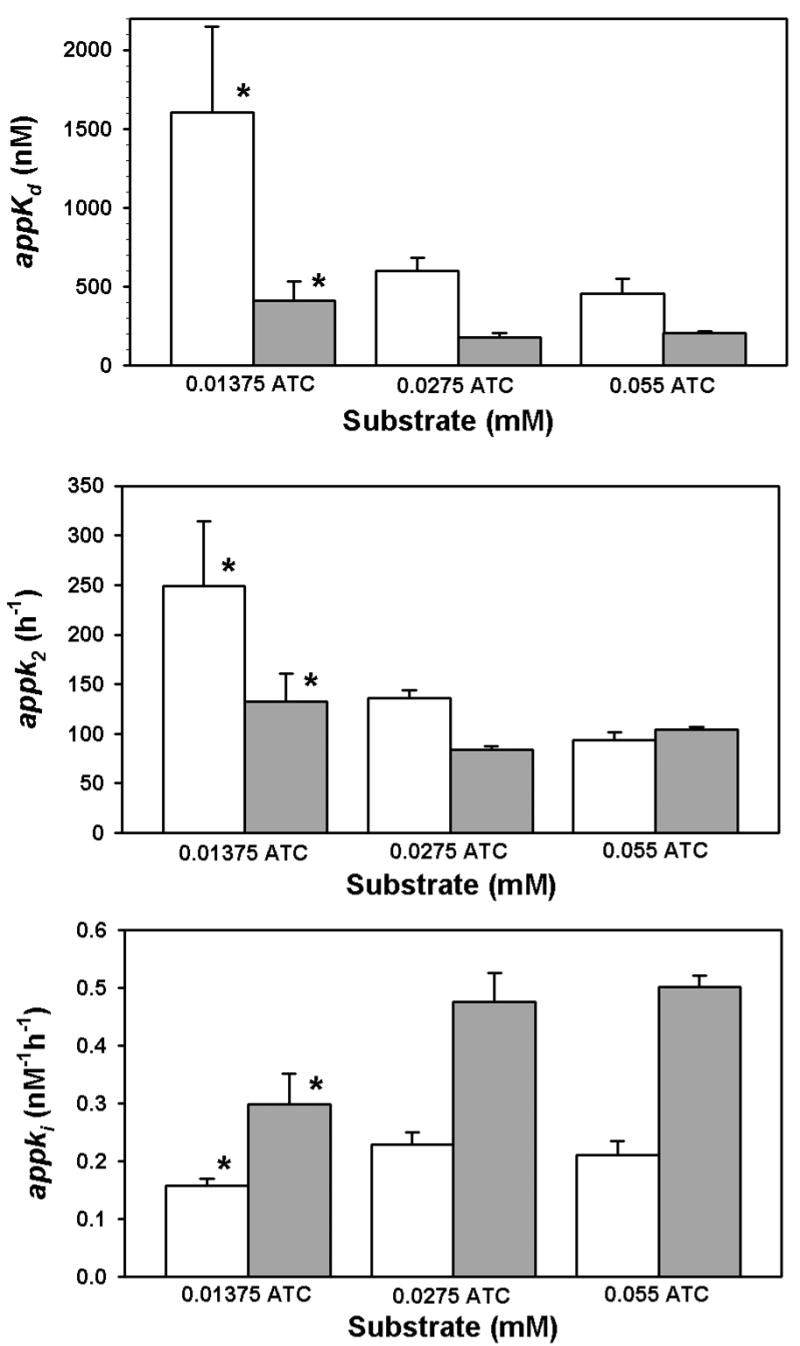
Relationship between acetylthiocholine concentration and appk2, appKd, and appki for 100 nM chlorpyrifos oxon at 24° (open bars) and 37° (filled bars). Each bar represents the mean ± standard deviation of at least three determinations as described in Figure 7. In the upper and middle panels, the asterisk indicates a significant difference (p<0.05) from the other groups at the same temperature by a Kruskal-Wallis one way analysis of variance on ranks, followed by multiple comparisons with Dunn’s Method. In the lower panel the asterisk indicates a significant difference (p<0.05) from the other two groups at the same temperature by a one way analysis of variance followed by multiple comparisons with the Student-Newman-Keuls method.
Figure 9.
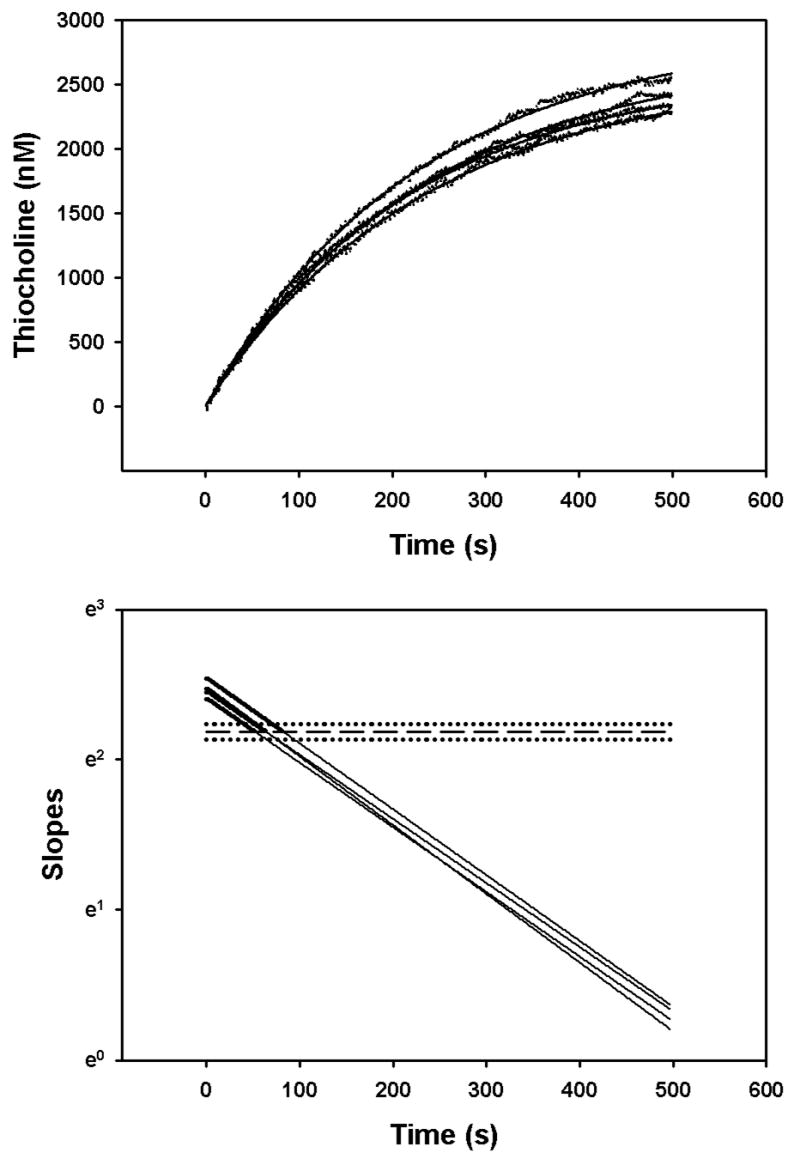
Determination of initial velocities of 0.0275 mM acetylthiocholine hydrolysis in the presence of 10 nM chlorpyrifos oxon. The upper panel shows the empirical data (filled circles) fitted by equation (9) (solid lines). The acetylcholinesterase active site concentrations were 0.9 – 1 pM in the mixing chamber of the stopped flow spectrophotometer. The solid lines in the lower panel show the slopes of the fitted curves from the upper panel. The slopes were determined as described in “Methods”. The bold portions of the curves indicate velocities greater than control velocities (without chorlpyrifos oxon). The control velocity mean (designated by the dashed line in the lower panel) and standard deviation (designated as the dotted lines) for an n=4 was 8.9059 ± 0.4813 nM/s.
Figure 10.
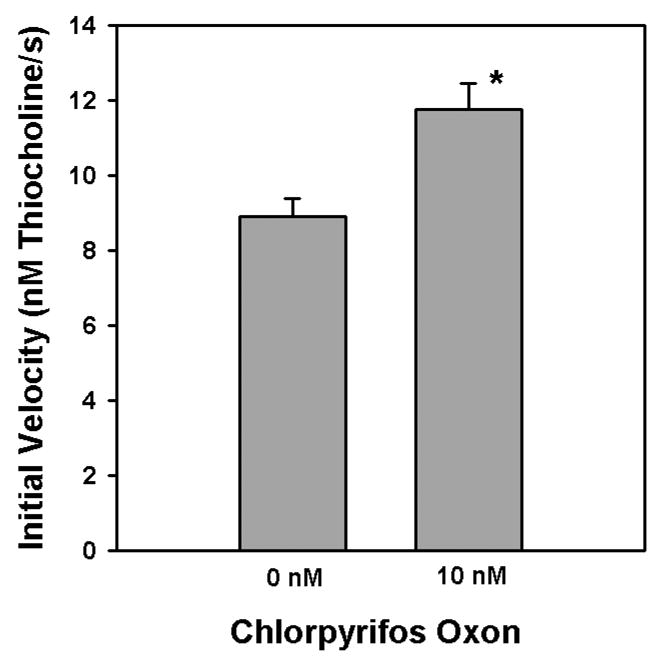
Comparison of initial velocities of 0.0275 mM acetylthiocholine hydrolysis by acetylcholinesterase in the presence and absence of 10 nM chlorpyrifos oxon. The initial velocities were obtained by stopped-flow spectrophotometry, as described in “Methods”. The asterisk indicates a significant difference (p<0.05) from controls by a t-test.
Discussion
Two observations in the present report document that chlorpyrifos oxon and methyl paraoxon cannot interact with acetylcholinesterase in a manner consistent with the simple Michaelis-Menten kinetics on which the ki model was derived (Main, 1964). The first is the changing kis as a function of oxon concentration (Figures 4 and 5). An accurate description of the interactions of these oxons with acetylcholinesterase must include a mechanism whereby oxon molecules reduce the capacity of other, subsequent oxon molecules to inhibit the catalytic site. The second observation demonstrating non-Michaelis-Menten kinetics is the acceleration of acetythiocholine hydrolysis followed by inhibition, resulting from 10 nM chlorpyrifos oxon (Figures 9 and 10). The inhibition obviously reflects the phosphorylation of Ser-203. However, early within the incubation, before significant phosphorylation has occurred, the accelerated hydrolysis of acetylthiocholine had to result from some presently unknown interaction of chlorpyrifos oxon and enzyme separate from the phosphorylation event.
Complex kinetics have been documented for many substrates and inhibitors of acetylcholinesterase, probably as a result of interactions between the peripheral anionic and catalytic sites. For example, Johnson et al 2003 have proposed that the peripheral anionic site, which is located at the rim of the active site gorge (Bourne et al (2003) transiently binds substrate for human acetylcholinesterase on the way to the catalytic site. Their modeling studies have suggested that the peripheral anionic site can accelerate events at the catalytic site with certain substrates/ligands at low concentrations, while inhibiting those same events at high ligand concentrations, perhaps due to the blockage of product dissociation from the catalytic site (Mallender et al, 2000, and Johnson et al, 2003). Similarly, Stojan et al 1998, using Drosophila melanogaster acetylcholinesterase, have proposed that initial binding to the peripheral anionic site increases the probability of a molecule entering the active site gorge, while continued occupation of the peripheral anionic site decreases the rate of entrance of subsequent molecules into the active site gorge. In addition they have proposed that occupation of the catalytic site lowers the affinity of the peripheral anionic site for substrate (Stojan et al, 1998). Thus their model was able to account for apparent enzyme activation at low substrate concentration, and enzyme inhibition at high substrate concentration (Stojan et al, 1998). Likewise, Masson et al 2000 have proposed that substrate inhibition and activation of acetylcholinesterase are linked features of a common allosteric conformational process triggered by substrate binding to the peripheral anionic site. Given the similarities in the actions of chlorpyrifos oxon and methyl paraoxon in modulating their own inhibitory capacities (Figures 4 and 5) to those of previously reported substrates/ligands for acetylcholinesterase (see above discussion), it seems likely that these oxons are binding to a secondary site on acetylcholinesterase separate from the catalytic site (Figure 1), as was suggested in previous studies (Kardos and Sultatos, 2000; Kousba et al, 2005; and Rosenfeld and Sultatos, 2006). However, it must be noted that such a putative site has not yet been identified for these oxons.
Co-incubation of three different concentrations of acetylthiocholine with 10 nM chlorpyrifos oxon and acetylcholinesterase revealed that acetylthiocholine can alter the inhibitory capacity of chlorpyrifos oxon (Figure 8). Increasing the acetylthiocholine concentration from 0.01375 mM to 0.0275 mM appeared to increase the binding affinity of chlorpyrifos oxon (as evidenced by a decreased Kd), yet reduce the oxon’s capacity to phosphorylate Ser-203 (as evidenced by a reduced k2)(Figure 8). The net effect of these alterations was to increase ki, the inhibitory capacity, by about 59 % (Figure 8). Other peripheral site ligands such as propidium, gallamine, and d-tubocurarine, have been preiously reported to accelerate the inhibition of recombinant mouse acetylcholinesterase by paraoxon and other neutral organophosphates (Radić and Taylor, 1999, and Radić and Taylor, 2001). Radić and Taylor (2001) concluded that ligands binding to the peripheral anionic site altered the conformation of those amino acids lining the choline binding site, thereby providing a more efficient fit of the leaving groups of uncharged organophosphates. Since acetylthiocholine (as well as acetylcholine) is also a peripheral site ligand, one can reasonably conclude a similar action towards chlorpyrifos oxon in the current study, particularly in view of the observed reduction in Kd brought by acetylthiocholine (Figure 8). Additionally, the current report demonstrated an effect on k2 also resulting from acetylthiocholine (Figure 8). However, it must be remembered that the actions of acetylthiocholine documented in Figure 8 are occurring in the presence of 100 nM chlorpyrifos oxon, which by itself caused a striking reduction in its own ki (Figure 4). It should be noted that physiological concentrations of acetylcholine, although highly variable, have been reported to reach the millimolar range in narrow synaptic clefts following evoked release (Van Der Kloot and Molg (1994). Consequently, transient occupation of the peripheral anionic site by acetylcholine in vivo likely occurs.
Although the details of the interactions of these oxons with acetylcholinesterase other than the phosphorylation of Ser-203 are not known with certainty at the present time, the non-Michaelis-Menten kinetics documented in the current report and elsewhere (Kardos and Sultatos, 2000; Kousba et al, 2005; and Rosenfeld and Sultatos, 2006) could have possible implications for the risk assessment of chlorpyrifos and related insecticides. When addressing this issue, however, the relationship between oxon levels that might exist in vivo following exposure to insecticides, versus the oxon concentrations that are associated with a changing ki in vitro should be considered. Due to the enormous difficulties in quantification of oxon levels in vivo following exposure to organophosphorus insecticides, only one study has systematically provided adequate pharmacokinetic information describing the blood levels of parent insecticide (chlorpyrifos) and corresponding oxon (chlorpyrifos oxon). Timchalk et al 2002, utilizing GC-Mass Spec to measure chlorpyrifos oxon concentrations in the rat following oral administration of chlorpyrifos, found that 10 mg/kg chlorpyrifos produced very slight inhibition of brain acetylcholinesterase, with corresponding blood oxon levels of 2–7 nM. Consequently, at least in the rat, dose response curves generated with measurable brain acetylcholinesterase inhibition represent inhibition occurring at chlorpyrifos oxon blood levels higher than 2–7 nM. As shown in Figure 4, with human recombinant acetylcholinesterase the chlorpyrifos oxon ki is markedly reduced at oxon concentrations higher than about 10 nM. Therefore, extrapolation of such a dose response curve to low insecticide levels could result in an under-estimation of insecticide risk because the capacity of individual chlorpyrifos oxon molecules to inhibit acetylcholinesterase at very low oxon levels could be greater than those individual oxon molecules in vivo associated with the dose response curve. Thus, concentration-dependent interactions of certain oxons with acetylcholinesterase might contribute, along with toxicokinetic factors and factors linking acetylcholinesterase inhibition with cholinergic dysfunction, to non-linear dose response relationships.
Acknowledgments
This study was supported by Grant ES012648 from NIEHS.
Footnotes
CONFLICT OF INTEREST STATEMENTS FOR AUTHORS
There are no conflicts of interest on the part of the authors that could inappropriately influence the work contained within this manuscript.
Publisher's Disclaimer: This is a PDF file of an unedited manuscript that has been accepted for publication. As a service to our customers we are providing this early version of the manuscript. The manuscript will undergo copyediting, typesetting, and review of the resulting proof before it is published in its final citable form. Please note that during the production process errors may be discovered which could affect the content, and all legal disclaimers that apply to the journal pertain.
Bibliography
- Barak D, Ordentlich A, Bromberg A, Kronman C, Marcus D, Lazar A, Ariel N, Velam B, Shafferman A. Allosteric modulation of acetylcholinesterase activity by peripheral ligands involves a conformational transition of the anionic subsite. Biochemistry. 1995;34:15444–15452. doi: 10.1021/bi00047a008. [DOI] [PubMed] [Google Scholar]
- Bourne Y, Taylor P, Radić ZA, Marchot P. Structural insights into ligand interactions at the acetylcholinesterase peripheral anionic site. EMBO. 2003;22:1–12. doi: 10.1093/emboj/cdg005. [DOI] [PMC free article] [PubMed] [Google Scholar]
- Ellman GL, Courtney D, Valentino A, Featherstone RM. A new and rapid colorimetric determination of acetylcholinesterase activity. Biochem Pharmacol. 1961;7:88–95. doi: 10.1016/0006-2952(61)90145-9. [DOI] [PubMed] [Google Scholar]
- Golicnik MD, Fournier D, Stojan J. Acceleration of Drosophila melangaster acetylcholinesterase methanesulfonyulation: peripheral ligand D-tubocurarine enhances the affinity for small methanesulfonylfluoride. Chem Biol Interact. 2002;139:145–157. doi: 10.1016/s0009-2797(01)00294-0. [DOI] [PubMed] [Google Scholar]
- Gray PJ, Duggleby RG. Analysis of kinetic data for irreversible enzyme inhibition. Biochem J. 1989;257(2):419–424. doi: 10.1042/bj2570419. [DOI] [PMC free article] [PubMed] [Google Scholar]
- Hart GJ, O’Brien RD. Recording spectrophotometric method for determination of dissociation and phosphorylation constants for the inhibition of acetylcholinesterase by organophosphates in the presence of substrate. Biochemistry. 1973;12(15):2940–2945. doi: 10.1021/bi00739a026. [DOI] [PubMed] [Google Scholar]
- Johnson JL, Cusack B, Davies MP, Fauq A, Rosenberry TL. Unmasking tandem site interaction in human acetylcholinesterase. Substrate activation with cationic acetanilide substrate. Biochemistry. 2003;42:5438–5452. doi: 10.1021/bi027065u. [DOI] [PubMed] [Google Scholar]
- Kardos SA, Sultatos LG. Interactions of the organophosphates paraoxon and methyl paraoxon with mouse brain acetylcholinesterase. Toxicol Sci. 2000;58:118–126. doi: 10.1093/toxsci/58.1.118. [DOI] [PubMed] [Google Scholar]
- Kousba SA, Sultatos LG, Poet TS, Timchalk C. Comparison of chlorpyrifos-oxon and paraoxon acetylcholinesterase inhibition dynamics: Potential role of a peripheral binding site. Toxicol Sci. 2004;80:239–248. doi: 10.1093/toxsci/kfh163. [DOI] [PubMed] [Google Scholar]
- Lin W, Tsou CL. Determination of rate constants for the irreversible inhibition of acetylcholine esterase by continuously monitoring the substrate reaction in the presence of the inhibitor. Biochim Biophys Acta. 1986;870:185–190. doi: 10.1016/0167-4838(86)90220-7. [DOI] [PubMed] [Google Scholar]
- Main AR. Affinity and phosphorylation constants for the inhibition of esterases by organophosphates. Sci. 1964;144:992–993. doi: 10.1126/science.144.3621.992. [DOI] [PubMed] [Google Scholar]
- Mallender WD, Szegletes T, Rosenberry TL. Acetylthiocholine binds to Asp74 at the peripheral site of human acetylcholinesterase as the first step in the catalytic pathway. Biochemistry. 2000;39(26):7753–7763. doi: 10.1021/bi000210o. [DOI] [PubMed] [Google Scholar]
- Marcel VS, Estrada-Mondaca S, Magne F, Stojan J, Klaebe A, Fournier D. Exploration of the Drosophila acetylcholinesterase substrate activation site using a reversible inhibitor (Triton X-100) and mutated enzymes. J Biol Chem. 2000;275:11603–11609. doi: 10.1074/jbc.275.16.11603. [DOI] [PubMed] [Google Scholar]
- Masson HJ, Sains C, Stevenson AJ, Rawbone R. Rates of spontaneous reactivation and aging of acetylcholinesterase in human erythrocytes after inhibition by organophosphorus pesticides. Hum Exp Toxicol. 2000;19:511–516. doi: 10.1191/096032700667340089. [DOI] [PubMed] [Google Scholar]
- Mileson BE, Chambers JE, Chen WL, Dettburn W, Ehrich M, Eldefrawi AT, Gaylor DW, Hamernik K, Hodgson E, Karczmar AG, et al. Common mechanism of toxicity: A case study of organophosphorus pesticides. Toxicol Sci. 1998;41:8–20. doi: 10.1006/toxs.1997.2431. [DOI] [PubMed] [Google Scholar]
- Radić Z, Pickering NA, Vellom DC, Camp S, Taylor P. Three distinct domains in the cholinesterase molecules confer selectivity for acetyl- and butyrylcholinesterase inhibitors. Biochemistry. 1993;32:12074–12084. doi: 10.1021/bi00096a018. [DOI] [PubMed] [Google Scholar]
- Radić Z, Taylor P. The influence of peripheral site ligands on the reaction of symmetric and chiral organophosphates with wildtype and mutant acetylcholinesterases. Chem Biol Interact. 1999:119–120. 111–117. doi: 10.1016/s0009-2797(99)00019-8. [DOI] [PubMed] [Google Scholar]
- Radić Z, Taylor P. Peripheral site ligands accelerate inhibition of acetylcholinesterase by neutal organophosphates. J Appl Toxicol. 2001;21:S13–S14. doi: 10.1002/jat.790. [DOI] [PubMed] [Google Scholar]
- Rosenfeld C, Kousba A, Sultatos LG. Interactions of rat brain acetylcholinesterase with the detergent Trition X-100 and the organophosphate paraoxon. Toxicol Sci. 2001;63:208–213. doi: 10.1093/toxsci/63.2.208. [DOI] [PubMed] [Google Scholar]
- Rosenfeld CA, Sultatos LG. Concentration-dependent kinetics of acetylcholinesterase inhibition by the organophosphate paraoxon. Toxicol Sci. 2006;90(2):460–469. doi: 10.1093/toxsci/kfj094. [DOI] [PubMed] [Google Scholar]
- Stojan J, Marcel V, Estrada-Mondaca S, Klaebe A, Masson P, Fournier D. A putative kinetic model for substrate metabolisation by Drosophila acetylcholinesterase. FEBS Let. 1998;440:85–88. doi: 10.1016/s0014-5793(98)01434-3. [DOI] [PubMed] [Google Scholar]
- Sussman JL, Harel M, Frolow F, Oefner C, Goldman A, Toker L, Silman I. Atomic structure of acetylcholinesterase from Torpedo californica: A prototypic acetylcholine-binding protein. Science. 1991;253:872–879. doi: 10.1126/science.1678899. [DOI] [PubMed] [Google Scholar]
- Szegletes T, Mallender WD, Thomas PJ, Rosenberry TL. Substrate binding to the peripheral site of acetylcholinesterase initiates enzymatic catalysis. Substrate inhibition arises as a secondary effect. Biochemistry. 1999;38:122–133. doi: 10.1021/bi9813577. [DOI] [PubMed] [Google Scholar]
- Taylor P, Radić Z. The cholinesterases: From genes to proteins. Annu Rev Pharmacol Toxicol. 1994;34:281–320. doi: 10.1146/annurev.pa.34.040194.001433. [DOI] [PubMed] [Google Scholar]
- Timchalk C, Nolan RJ, Mendrala AL, Dittenber DA, Brzak KA, Mattsson JL. A physiologically based pharmacokinetic and pharmacodynamic (PBPK/PD) model for the organophosphate insecticide chlorpyrifos in rats and humans. Toxicol Sci. 2002;66(1):34–53. doi: 10.1093/toxsci/66.1.34. [DOI] [PubMed] [Google Scholar]
- Van Der Kloot W, Molgó J. Quantal acetylcholine release at the vertebrate neuromuscular junction. Physiol Rev. 1994;74:899–991. doi: 10.1152/physrev.1994.74.4.899. [DOI] [PubMed] [Google Scholar]
- Worek F, Diepold C, Eyer P. Dimethylphosphoryl-inhibited human cholinesterases: Inhibition, reactivation, and aging kinetics. Arch Toxicol. 1999;73:7–14. doi: 10.1007/s002040050580. [DOI] [PubMed] [Google Scholar]