Abstract
Introduction
In previous studies, we established methodology for reconstructing endocardial potential maps, electrograms, and isochrones from a noncontact intracavitary catheter during a single beat. Recently, we evaluated this approach using a 9-French (3-mm) spiral catheter in a normal heart preparation. Here we extend the approach to hearts with structural disease and examine its ability to detect and characterize abnormal electrophysiologic (EP) substrates and to map ventricular arrhythmias on a beat-by-beat basis.
Methods and Results
Reconstruction of endocardial potentials from cavity potentials measured with 82 electrodes mounted on a 9-French spiral catheter was performed in an isolated canine left ventricle (LV). Endocardial potentials were recorded with 91 intramural needles, providing a gold standard for evaluating the noncontact reconstruction. Studies were performed in a normal LV (control) and the same LV 3 hours after left anterior descending coronary artery occlusion and ethanol injection to create an infarct. Abnormal EP characteristics over the infarct were faithfully reconstructed, including (1) low potentials and electrogram derivatives; (2) fractionated electrograms; (3) small deflections on electrograms reflecting local activation; and (4) slow discontinuous conduction transverse to fibers. During arrhythmia, beat-to-beat dynamic shifts of initiation site and activation pattern were captured by the reconstruction.
Conclusion
Noncontact, nonexpendable catheter mapping can locate and characterize abnormal EP substrates and can capture the endocardial sequence of an arrhythmia during a single beat.
Keywords: electrophysiologic mapping, electrophysiologic study, catheter, infarction, arrhythmias
Introduction
Myocardial infarction (MI) and the associated tissue remodeling create an electrophysiologically (EP) abnormal substrate that is highly arrhythmogenic.1 Most ventricular tachycardias (VT) associated with ischemic heart disease originate near the endocardium or involve subendocardial activity. It is therefore important to obtain accurate endocardial EP maps so that the arrhythmogenic substrate can be detected and located, the site of VT origin can be determined, and the sequence of arrhythmic activation visualized. Common catheter mapping techniques in the clinical EP laboratory rely on a roving-probe approach that records endocardial electrograms sequentially and requires data collection from many heartbeats to compile an endocardial EP map.2,3 This approach prolongs the mapping procedure and cannot be applied to map nonsustained and hemodynamically unstable arrhythmias or polymorphic arrhythmias that vary from beat to beat.
Myocardial electrical activity generates potentials inside the blood cavity that can be measured with an intracavitary probe.4 In a series of publications, we developed and validated methodology for noncontact catheter mapping where EP maps are computed from such potentials over the entire endocardial surface during a single beat.5–9 In this approach, endocardial potentials, electrograms, and isochrones are reconstructed mathematically from cavity potentials measured with a multielectrode catheter that floats in the blood cavity and is not required to make contact with the endocardium. The most recent study used an isolated canine left ventricle (LV) preparation and demonstrated that noncontact mapping can be performed accurately using a spiral-shaped 9-French (3-mm) catheter that does not require expansion or inflation inside the cavity.9 A spiral catheter design is realizable; in fact, spiral-shaped catheters have been developed for other clinical EP applications.10 Other multielectrode catheters for simultaneous mapping require opening a multispoke basket that must make contact with the endocardium11 or inflating a balloon that carries the catheter electrodes.12
To date, we have tested successfully the spiral catheter concept in a normal heart, in the absence of structural disease9 or arrhythmias. The aim of this study was to evaluate its ability to detect, locate, and characterize abnormal EP substrates associated with MI. In addition, we examined the ability to map dynamically changing activation sequences during polymorphic arrhythmias. Such information cannot be obtained using the common roving-probe techniques. The ability to do so on a beat-by-beat basis could be helpful for diagnosing arrhythmias and guiding therapeutic interventions such as pacing and ablation.
Methods
Experimental Methods
The experiment was performed in the isolated canine LV preparation described previously.6,7,9 Briefly, endocardial potentials were measured by the tip electrodes of 91 intramural multielectrode needles inserted into the ventricular walls of the isolated LV from all directions, including the septum. Cavity potentials were measured by 82 electrodes mounted on a spiral-shaped rigid catheter9 that was inserted into the LV through a pursestring in the left atrial appendage (Fig. 1A). Endocardial and cavity potentials were recorded simultaneously using a 512-channel recording system at 1 k-Hz sampling rate. The reference electrode was located in the lump of dead tissue near the root of the aorta. Positions of endocardial electrodes and of catheter electrodes inside the LV cavity were determined as previously described.9 Endocardial potentials measured by the tip needle electrodes served as the gold standard for evaluating reconstructed endocardial potentials, computed from the cavity potentials measured by the noncontact catheter electrodes. Potentials were recorded during right atrial and LV pacing from several sites. Following control recordings, 5 mL of 50% ethanol was injected into the left anterior descending coronary artery (LAD) just below the first diagonal branch and the artery was ligated. Lack of perfusion and ethanol induced necrosis created a region of infarcted/necrotic tissue. A region in which ST segment elevation was observed after the injection is delineated by the dashed border in Figure 1B and provides an estimate of the infarcted area. Three hours after ethanol injection, the pacing protocols were repeated. Programmed stimulation (from a site marked by the asterisk in Fig. 1B) with a basic cycle length of 330 msec followed by two or three premature stimuli was attempted at the end of the experiment. Multiple monomorphic and polymorphic arrhythmic beats were successfully induced. Reconstructions were performed and evaluated during these beats.
Figure 1.
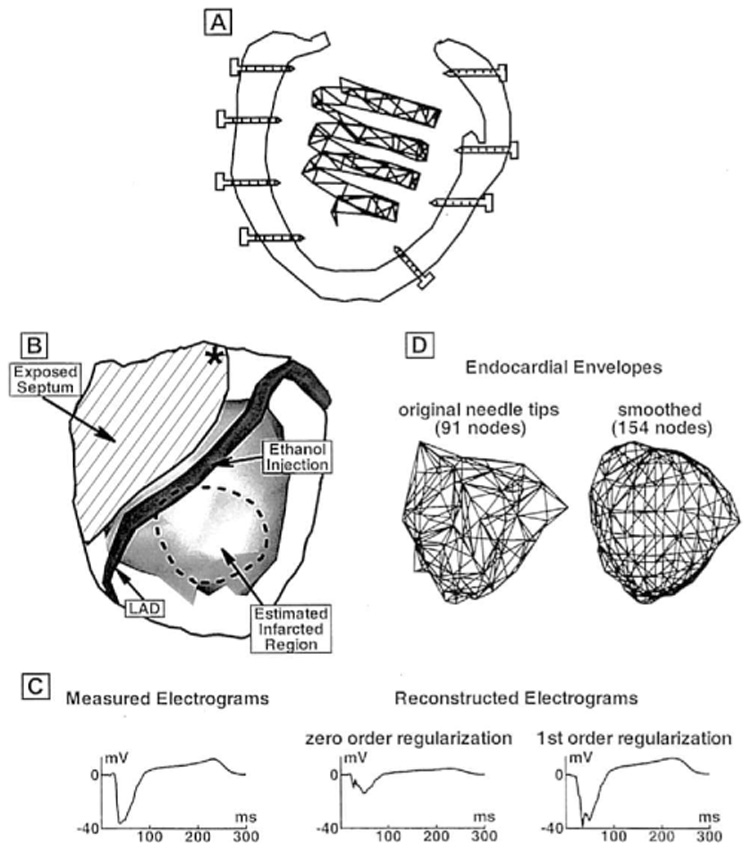
(A) Schematic diagram of the noncontact spiral catheter inside the isolated left ventricle (LV). Several of the intramural needles whose tip electrodes are used to directly measure endocardial potentials also are shown. (B) Schematic illustration of experimental preparation. LV epicardium is transparent and delineated by a solid border. The LV endocardium, as seen from the epicardium, is shown as a shaded (gray) surface. Left anterior descending coronary artery (LAD) is shown on the epicardium. The estimated infarcted region is delineated by the dashed border. To the left of the LAD, the right ventricle was surgically removed and the exposed septum is indicated. Asterisk marks the site of programmed stimulation. (C) Example of electrogram reconstruction that is greatly improved using first-order regularization (right column) compared with zero-order regularization (middle column). Measured electrogram is shown on the left for comparison. (D) Schematic diagram of the two endocardial envelopes on which endocardial potentials are reconstructed. Left panel shows the endocardial envelope constructed by connecting the endocardial tips of the electrode needles. Right panel shows the smoothed endocardial envelope with evenly distributed nodes and uniform elements.
Computational Methods
Details of the mathematical methodology were described previously.6,7,9,13 Briefly, reconstruction of endocardial potentials from noncontact catheter potentials requires solving Laplace’s equation in the cavity volume between the endocardial surface and the catheter surface. The boundary element method (BEM) is used to discretize the surfaces, resulting in the following linear matrix equation:
| (1) |
where Vc is a vector of catheter potentials, Ve is a vector of endocardial potentials, and A is a matrix of geometrical coefficients relating the two surfaces. Due to the ill-posed nature of this mathematical formulation, endocardial potentials (Ve) cannot be obtained by simply inverting the matrix relationship of Equation 1. Either Tikhonov zero-order or first-order regularization is used to stabilize the solution in this study. Zero-order regularization constrains potential amplitudes, whereas first-order regularization constrains potential gradients.14 Use of the first-order scheme improves the reconstruction of potential amplitudes (amplitudes are less attenuated than in the zero-order scheme) (Fig. 1C). However, it may compromise the ability to capture very local electrical events because of greater influences from nearby locations (gradient constraint). In contrast, the zero-order scheme is better suited for reconstructing localized events without major influences from neighboring sites through the regularization procedure. In this study, both regularization procedures are performed and the reconstruction that better approximates the measured endocardial data is displayed.
Endocardial potential maps are reconstructed at 1-msec intervals during the entire cardiac cycle. From these potentials, endocardial electrograms, activation times, and isochrones are reconstructed as previously described.9 Endocardial potentials are computed at 91 positions, where the endocardial needle electrodes are located, allowing a direct comparison of the reconstructed potential maps, electrograms, and isochrones with their measured counterparts. In the experiment, the spatial distribution of the 91 recording needles was not uniform. As a result, the endocardial envelope obtained by connecting the needle tips is irregular and generates triangular elements (for BEM computations) that are very nonuniform in size and shape. It has been reported that inverse solutions are improved by smoothing the endocardial surface onto which potentials are computed.15 Therefore, in addition to the reconstructions at the exact 91 needle tip locations (for validation purposes), a smooth endocardial envelope was generated by surface fitting using MATLAB griddata function (triangle-based linear interpolation) and reconstructions were performed to this envelope. An important advantage of our approach is that the mapping resolution is not limited by the number of catheter electrodes (a limitation of contact mapping with a multispoke basket or a balloon). Reconstruction can be performed to an endocardial envelope that contains as many points as desired. We choose to have 154 nodes on the smoothed endocardial envelope in order to extract as much information as possible from the noncontact catheter data. Figure 1D shows the original endocardial envelope defined by the 91 needle-tip positions (left) and its smoothed version using 154 nodes (right). As mentioned, potential reconstructions were performed on both surfaces.
Results
Pacing Studies: Infarction-Induced Changes in Potentials, Electrograms, and Isochrones for Different Activation Sequences
Figure 2 shows preinfarction (Control) and postinfarction (Infarct) electrograms at selected sites during LV endocardial pacing from a posterior location (the pacing site is indicated by an asterisk). For each case, measured (left) and reconstructed (right) electrograms are displayed. Sites A and D lie outside the region perfused by the LAD, and sites B and C are within the estimated infarcted region. After formation of the infarct, electrograms at sites A and D show little change, whereas B and C show altered morphologies. Electrograms at B and C have reduced negative peak potential and (−dV/dt)max relative to control. For electrograms in the infarct area, measured maximum negative potential is reduced on the average by 59% (58% reduction in reconstructed electrograms) and measured (−dV/dt)max is reduced by 62% (52% reduction in reconstructed electrograms). The postinfarction electrogram recorded at site C becomes fractionated and contains a distinct sharp RS deflection superimposed on a slow Q wave. This deflection probably reflects local activation of nearby surviving fibers within the infarct.16 Note that the electrograms reconstructed from the noncontact catheter measurements reproduce these changes, including reduced amplitudes and slopes, and the presence of superimposed small deflections. Figure 3 is an enlarged display of preinfarction and postinfarction electrograms in the estimated infarcted region from the same pacing protocol as in Figure 2. All electrograms are displayed on the same potential scale (shown at center of figure). Over this area, many of the postinfarction electrograms show morphologic changes associated with infarction, including reduced magnitudes, reduced slopes, and the appearance of superimposed local deflections or fractionation. These morphologic changes are captured in the reconstructed electrograms. The distinct morphologic properties can be used to estimate the location and extent of the abnormal EP substrate associated with the infarct. Figure 4 shows this estimated region based on the following criteria: (1) peak-to-peak potential <15 mV; (2) maximum negative derivative (excluding superimposed sharp deflection) <2 mV/msec; and (3) presence of fractionation. Note that the estimated regions using measured (solid lines) and reconstructed (dashed lines) data are closely correlated.
Figure 2.
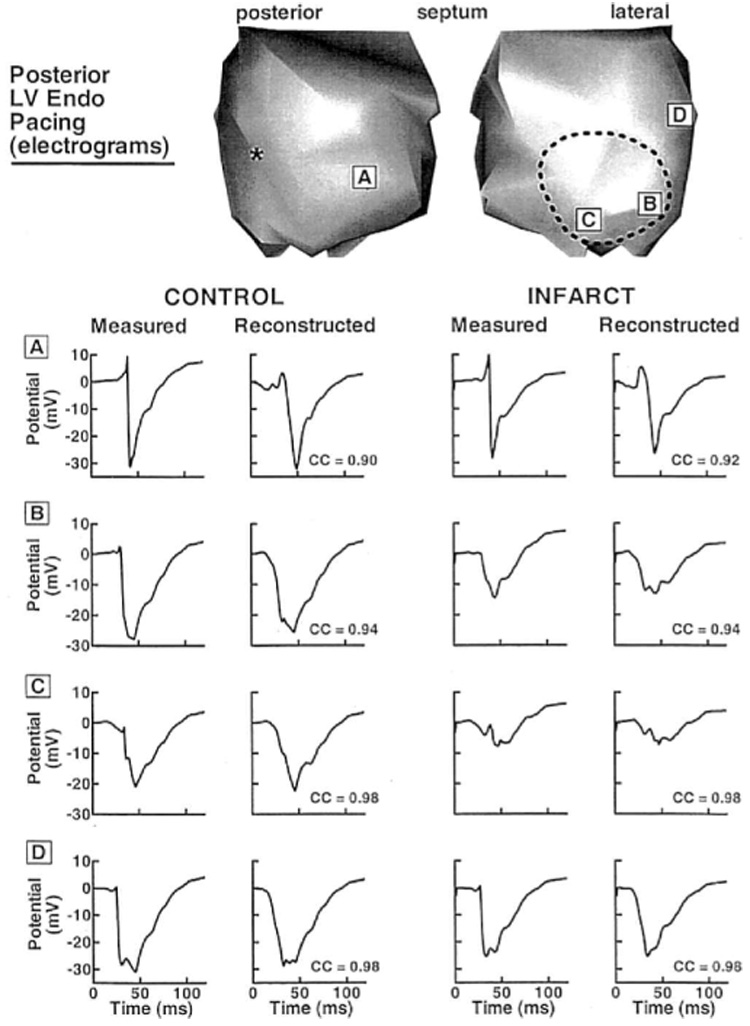
Endocardial electrograms associated with posterior left ventricular (LV) endocardial pacing. Letters in boxes indicate the electrogram locations. Left two columns show electrograms measured directly by the tip needle electrodes (left), and corresponding electrograms reconstructed from the noncontact catheter (right), in the preinfarct control heart. Right two columns show (similar format) measured and reconstructed electrograms from the infarcted heart. Correlation coefficients (CC) between the measured and the reconstructed electrograms are shown next to the reconstructed electrograms. The electrograms are displayed on the endocardial envelope, as seen by an observer looking from the epicardium (as if the myocardium were transparent, see Fig. 1B). The endocardial envelope is cut open and displayed in two views. Dashed border delineates estimated area perfused by the LAD. Asterisk identifies the pacing site.
Figure 3.
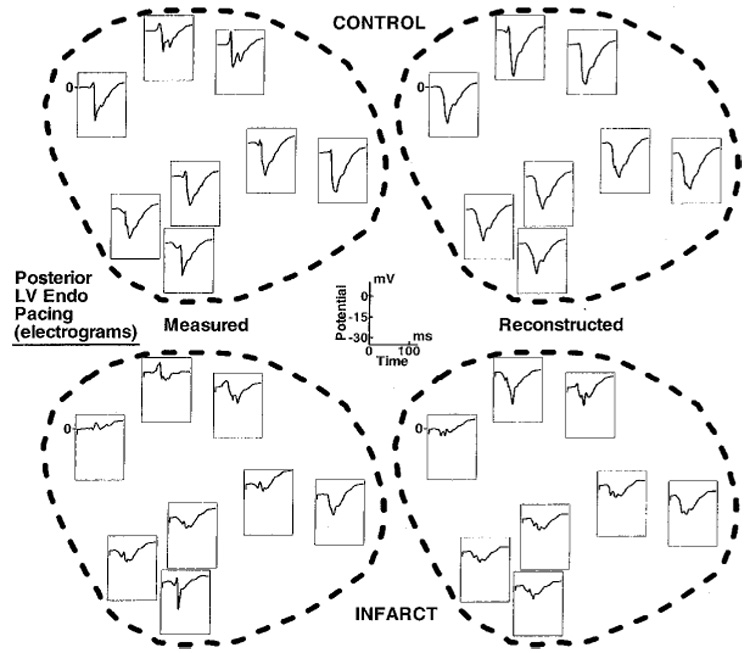
Endocardial electrograms inside the estimated infarcted region during the posterior left ventricular (LV) endocardial pacing shown in Figure 2. Top row: Preinfarction (Control) electrograms inside the left anterior descending coronary artery perfused region. Bottom row: Electrograms from the same region after infarct formation. Left column: Measured electrograms. Right column: Reconstructed electrograms.
Figure 4.
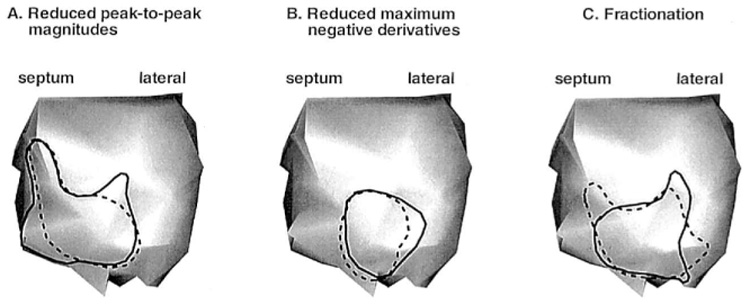
Estimated region of altered electrophysiologic substrate based on the posterior left ventricular (LV) endocardial pacing data of Figure 2 and Figure 3, using three different criteria. Solid lines depict estimates based on measured data. Dashed lines depict estimates based on reconstructed data. (A) Outlined LV regions contain electrograms with reduced peak-to-peak magnitudes (<15 mV). (B) Outlined LV regions contain electrograms with reduced maximum negative derivatives (<2 mV/msec, excluding superimposed sharp deflection). (C) Outlined LV regions contain fractionated electrograms.
Figure 5 shows preinfarction and postinfarction electrograms in the estimated infarct region during pacing from the exposed right ventricular surface of the septum. Different from the LV endocardial pacing of Figure 2 to Figure 4, the control endocardial electrograms show a predominant positive R wave before the intrinsic deflection. Postinfarction, the R wave is suppressed in most endocardial electrograms over the infarct region, probably because the underlying necrotic tissue cannot support normal wavefront propagation. The large and sharp intrinsic deflections are replaced by one or more small deflections, with development of multiple deflections and fractionation in most electrograms. The fractionation most likely reflects asynchronous activation of surviving fibers separated by necrotic inexcitable tissue.16 Note that morphologic changes are reproduced in the reconstructed electrograms.
Figure 5.
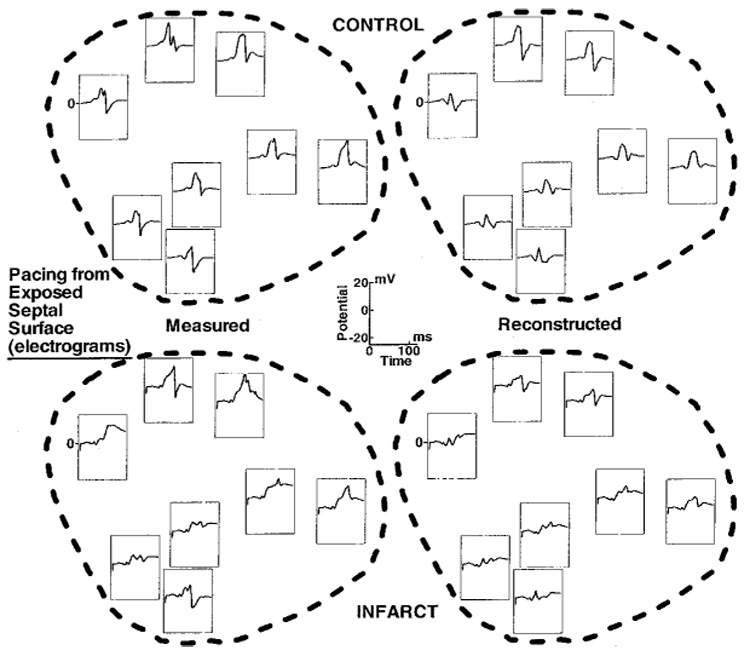
Endocardial electrograms from the estimated infracted region during pacing from the exposed right surface of the septum. Same format as Figure 3.
The top panel of Figure 6 shows measured and reconstructed preinfarction and postinfarction endocardial potentials generated 35 msec after LV endocardial pacing from within the LAD perfused region (asterisk). Preinfarction (Control), the most negative potentials surround the pacing site, reflecting the spread of activation from this site. Postinfarction, the infarcted region near the pacing site shows less negativity than the surrounding tissue. This suggests that normal spread from the pacing site has been interrupted in this area, forcing the wavefront to follow an alternative pathway. The activation sequence is depicted in the isochronal maps of Figure 6, bottom panel. Regions superior and inferior to the infarct are activated earlier than the endocardial surface over the infarct, suggesting activation spread in deeper layers and possible involvement of surviving Purkinje fibers. The reconstructed potential maps and isochrones capture these changes in activation caused by the infarct.
Figure 6.
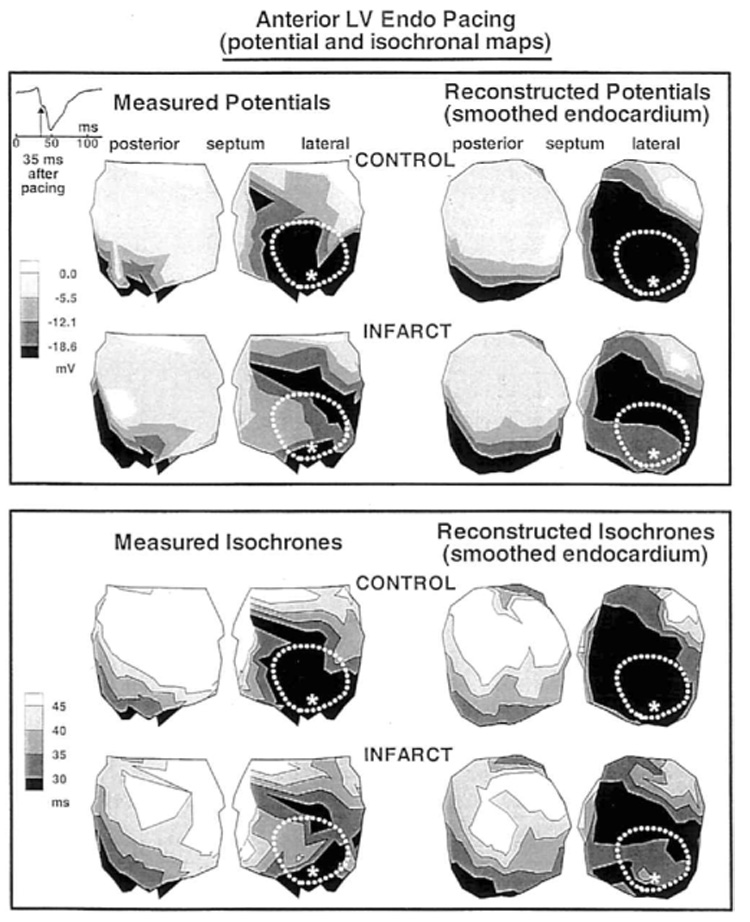
Endocardial potentials (top panels) and isochrones (bottom panels) generated by anterior left ventricular (LV) endocardial pacing. Asterisk indicates the pacing site. In each panel, top row shows preinfarction (Control) data and bottom row shows postinfarction data. Left: Measured data. Right: Reconstructed data.
Reconstruction of Arrhythmic Episodes
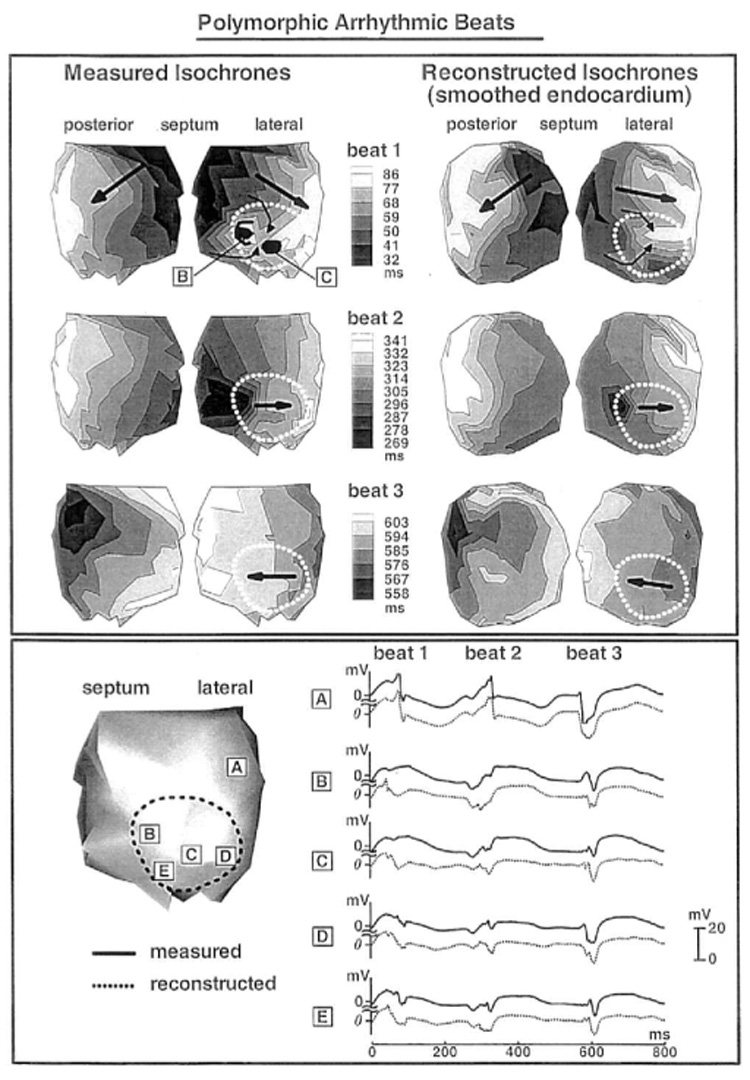
After programmed stimulation, episodes of arrhythmic beats developed in the infarcted LV. The top panel of Figure 7 shows the measured and reconstructed isochrones for three consecutive arrhythmic beats, starting from beat 2. The first beat (not shown) originates from a superior septal location, close to the endocardial breakthrough site during pacing. Interestingly, all arrhythmic episodes in the study started with a spontaneous beat originating in this area, possibly caused by focal activity. The arrhythmia is polymorphic, with the earliest endocardial activation site shifting from beat to beat. Beat 2 starts from an inferior posterior area (black) and ends in the lateral basal region of the LV. The wavefront spreads through the infarcted region in a vertical direction, from apex to base. This propagation direction is generally along the orientation of endocardial fibers in this region.6,17 The general pattern of activation is captured correctly in the reconstructed isochronal map. Beat 3 originates from a different, more superior and lateral posterior location. The wavefront propagates horizontally across the ventricle, including the infarcted region. Endocardial activation spread in this region is generally transverse to fiber orientation. Propagation is slow in portion of the infarcted region, as indicated by the crowding of isochrones. Velocity of wavefront propagation on the endocardial surface in this area is computed to be 25 cm/sec from the measured isochrones and 27 cm/sec from the reconstructed isochrones. In comparison, computed velocity away from the infarct in the posterior wall is 79 cm/sec (measured isochrones) and 78 cm/sec (reconstructed isochrones). Initiation site and activation sequence during beat 4 are similar to beat 2, with some differences. The reconstructed activation pattern resembles the measured pattern, except that the adjacent multiple initiation sites seen in the measured map are not differentiated in the reconstructed map. Origins of all three beats shown are remote to the infarcted region. Measured and reconstructed electrograms from five selected sites are shown at the bottom of Figure 7. Site A is far from the infarct, whereas sites B to E are within the infarcted region. Amplitude attenuation (all electrograms are shown on the same potential scale) is clearly observed in both measured and reconstructed electrograms inside the infarcted area. Importantly, fractionated electrograms with multiple deflections develop during beat 3, when slow conduction occurs across fibers in the infarcted region, and are captured by the reconstruction.
Figure 7.
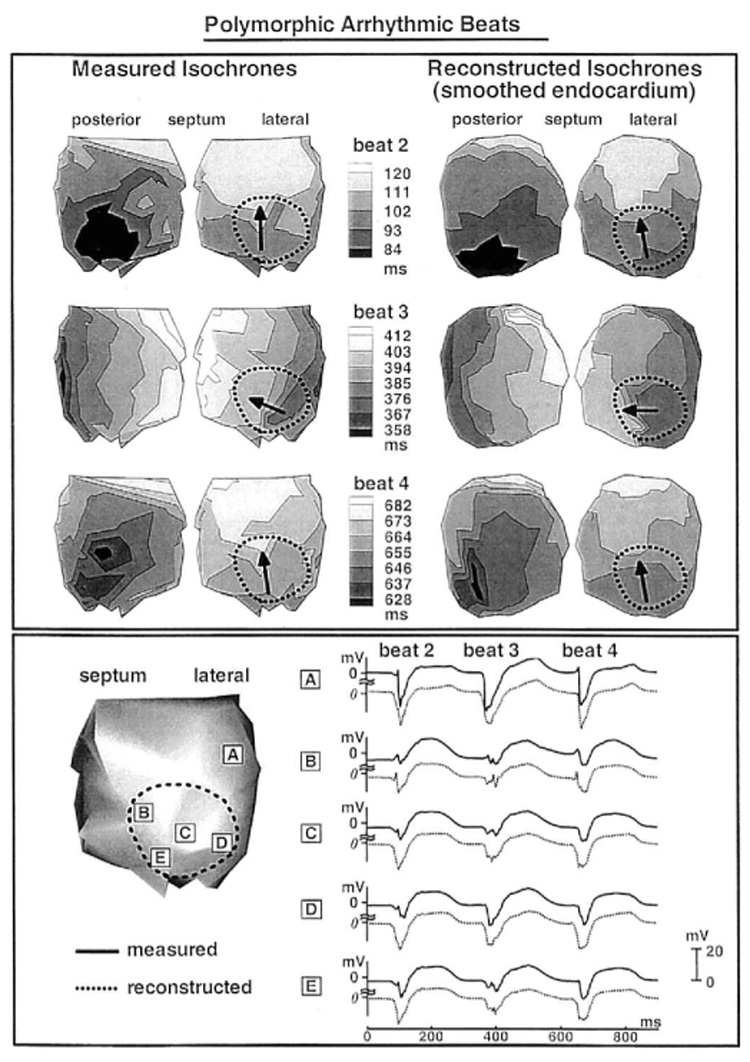
Top panel: Endocardial activation sequences (isochrones) of three consecutive arrhythmic beats during a polymorphic arrhythmia. Left: Measured. Right: Reconstructed. Black arrows inside the infarct show direction of propagation. Measured (solid) and reconstructed (dashed) endocardial electrograms corresponding to the three beats are shown in A to E of the bottom panel. The sites of these electrograms are shown on the left.
Figure 8 shows measured and reconstructed isochrones for one cardiac cycle during a sequence of monomorphic arrhythmic beats. Endocardial activation originates from a superior septal site (black) and ends posteriorly (white). The sequence repeats itself with a cycle length of about 250 msec. Five selected measured and reconstructed electrograms from sites A to E are displayed on the bottom of Figure 8. Reconstructed electrograms resemble the measured ones in most locations except at site B. The measured electrogram at site B (solid line) displays a small deflection on top of a positive “dome” (or “hump”). This is a typical waveform recorded near sites of conduction block. The block is marked by the horseshoe-shaped black line enveloping site B in the measured isochronal map. Propagation around this line is very slow (49 msec between sites 1 and B), as reflected in the crowded isochrones. Recorded electrograms along the pathway of the wavefront in this region (curved thin arrows) are shown below the measured isochronal map (sites 1 to 4 and B). The electrograms show a progressively delayed time of local activation and smaller deflections as the wavefront approaches site B. At this site, the monophasic electrogram (no S wave) indicates termination of conduction. The reconstructed electrogram at site B does not preserve this morphology very accurately. However, the site of latest activation (160 msec) is located 4 mm from B in the reconstructed isochrone map. The reconstructed isochrones show conduction slowing as the wave-front approaches this site from the left, with faster propagation along superior and inferior pathways that envelop this site (curved thin arrows). This pattern resembles the measured isochrones very closely. The main features of the global activation sequence (large arrows) also are captured by the reconstruction.
Figure 8.
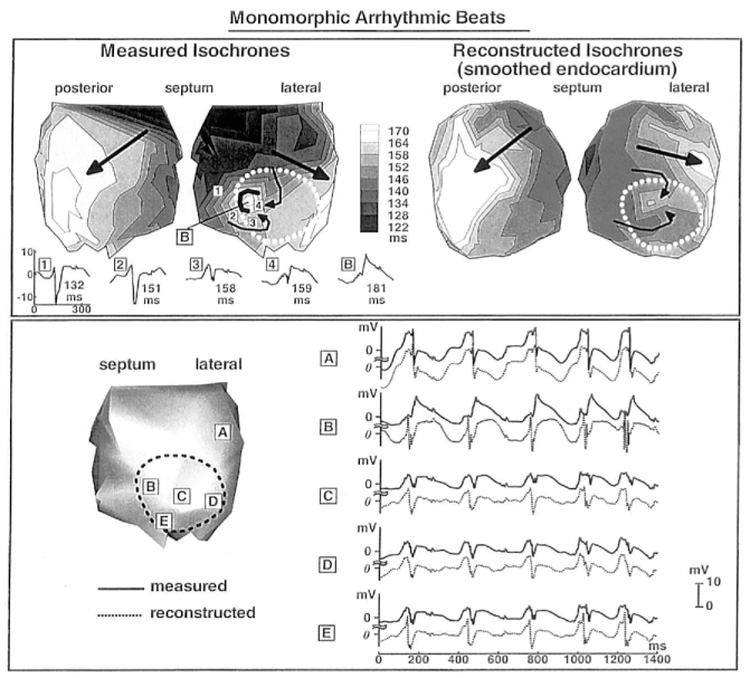
Top panel: Isochrones for one cycle of a monomorphic arrhythmia. Left: Measured. Right: Reconstructed. Conduction block near site B is delineated as a black horseshoe in the measured map. Small curved arrows indicate local activation sequence near the block region. Large arrows indicate the direction of propagation of the global wavefront. Numbers 1 to 4 and letter B on the measured isochronal map indicate the locations of electrograms displayed below the map. Local activation time is shown next to each electrogram. A to E in bottom panel show selected measured (solid lines) and reconstructed (dashed lines) electrograms from corresponding endocardial sites (left).
Figure 9 shows three consecutive arrhythmic beats during another episode of a polymorphic arrhythmia. Figure format is the same as in Figure 7. The first beat starts from a site close to the endocardial breakthrough site during programmed stimulation. Based on similar analysis of measured electrograms as in Figure 8, local block occurs within the infarct (measured isochrones, black regions B and C). A region of late activation inside the infarcted area is captured in the reconstructed isochronal map, indicating collision of the two enveloping wavefronts (thin curved arrows). This sequence is consistent with the measured isochrones that show similar wavefronts, curving around the region of block. Beat 2 is especially interesting in that it originates from the vicinity of site B after a silent gap of about 170 msec (from 98 msec to 268 msec). Although we did not observe continuous activity from the needle electrode recordings during this time period, it is possible that the activation wave followed a zigzag pathway through the infarct (endocardial or intramural) before it reemerged at 268 msec. Spread of activation during this beat is highly asymmetric, with normal conduction to the left of the site of origin (toward the LAD) and severe conduction slowing in the opposite direction as the wavefront traverses the infarct from left to right, across fiber orientation. The shift of the site of origin to the border of the infarct, fractionation of electrograms in the infarcted region, asymmetry of conduction velocity, and slowing of conduction across the infarct are all captured by the noncontact reconstruction. Beat 3 originates from a posterior basal location and the wavefront propagates through the infarct from right to left, in the opposite direction to beat 2. Despite being transverse to fiber orientation, propagation across the infarct in this direction does not show any conduction slowing or nonuniformities, and electrograms from the infarct region display single deflections of relatively large amplitudes without fractionation.
Figure 9.
Activation sequences and electrograms of three consecutive arrhythmic beats during a polymorphic arrhythmia, different from the arrhythmia of Figure 7. Same format as Figure 7.
Discussion
Cardiac remodeling processes that alter EP properties produce substrates that can be highly arrhythmogenic.1,18 Arrhythmias in such settings usually involve endocardial aspects of the altered myocardium and, in many cases, vary dynamically from beat to beat and can be nonsustained. These properties support the need for simultaneous EP mapping of the entire endocardial surface during a single beat using a small-diameter (nonexpanding) catheter. We previously demonstrated9 in a normal heart that this can be accomplished using a 9-French multielectrode spiral catheter positioned in the blood cavity, in conjunction with mathematical procedures that we developed13 to reconstruct potentials, electrograms, and isochrones on the entire endocardial surface. Here, we extend this approach to the clinically important situation of abnormal EP substrate produced by MI (a similar approach applies to other remodeling processes) and to arrhythmic activity that develops in this setting.
The experimental preparation used here allows for direct comparison between measured endocardial potentials (by the tip needle electrodes) and those reconstructed from the noncontact catheter. It also uses the preinfarction heart as its own control. The noncontact reconstructions reproduce correctly the following EP properties over the infarct substrate: (1) reduced potential magnitudes, possibly as a result of reduced volume of viable tissue participating in activation19 and reduced cell-to-cell coupling in this region20,21; (2) reduced magnitudes of negative derivatives of unipolar electrograms (“slow” deflections), reflecting dominance of far field potentials in this region; (3) electrograms with superimposed small deflections reflecting local activation of islands of surviving myocardium within the infarct18; and (4) fractionated electrograms, reflecting activity of nearby surviving fibers that is sufficiently separated in time to generate discrete deflection on the electrogram.16,20,22 Based on these characteristics, the endocardial location and extent of the abnormal EP substrate associated with the infarct can be estimated from the noncontact reconstruction (Fig. 4). Importantly, the small local deflections and fractionation of electrograms reflect structural nonuniformities and “patchiness” of the substrate. Such nonuniformities create local mismatches between electrical sources and sinks (e.g., sites of expansion or branching into islands of surviving tissue) that are highly susceptible to the development of unidirectional block and reentry.23,24 The ability of the noncontact mapping to reconstruct these characteristics suggests that it can be used to assess the “patchiness” and EP heterogeneity of the substrate, providing a measure of the vulnerability to arrhythmia and helping in risk stratification. Data presented in Figure 2 to Figure 6 are obtained during ventricular pacing. However, reduced potentials and electrogram derivatives are reconstructed over the infarct region during right atrial pacing as well (data not shown), demonstrating the ability to detect and locate the abnormal EP substrate during sinus rhythm.
The noncontact reconstructions capture the slowing of propagation (crowding of isochrones) that involves local delays (reflected in electrogram fractionation) in the infarct region. Such discontinuous slow propagation occurs when the wavefront propagates transverse to the fiber axis in this region (e.g., Fig. 7, beat 3) but not along the fiber axis (Fig. 7, beats 2 and 4), suggesting side-to-side separation between fiber bundles caused by necrosis. Interestingly, propagation slowing depends not only on orientation relative to the fiber axis but also on the actual direction of propagation. For example, in Figure 9 propagation across the infarct is slowed and electrograms are fractionated when the infarct is traversed by the propagating wavefront from left to right (beat 2) but not from right to left (beat 3). Such asymmetry probably reflects the complex asymmetric structure of the infarct.
The noncontact reconstruction determines correctly the endocardial sites of origin and general endocardial activation sequences of arrhythmic beats. Importantly, it captures the dynamic beat-to-beat shift of the initiation site and changes in the pattern of activation. The activation pattern within the infarct region also is reconstructed, although details on a small scale are smoothed out (Fig. 8 and Fig. 9). An important property of the nonexpandable catheter design is preservation of catheter steerability. With this property, the catheter can be steered to approach a region of interest such as the infarct region (once located by the global noncontact map) where more accurate reconstruction can be performed with higher resolution.
The present study demonstrates the capability of the noncontact mapping approach to reconstruct abnormal EP properties and arrhythmic activity on the endocardial surface of the heart from a 9-French catheter without the need for expansion. Most infarcts (and other remodeling processes) involve the three-dimensional myocardium, as do most reentrant circuits that underlie clinical VT.25–27 In previous studies we used similar methodology (ECG imaging [ECGI]) to reconstruct noninvasively EP information on the epicardial surface of the heart from body surface potentials in the presence of an infarct18 and during reentrant VT.25,28 Combined application of ECGI and noncontact catheter mapping can provide potentials, electrograms, and isochrones on both surfaces of the heart during a single beat. Availability of such detailed EP information on the epicardium and endocardium simultaneously will permit determination of electrical activity in the three-dimensional myocardium in a way that currently is not possible in the EP laboratory.
Acknowledgments
This study was supported by NIH-NHLBI Grants R37 HL-33343 and R01 HL-49054 to Dr. Rudy and R01 HL-43276 to Dr. Taccardi. Additional support was provided by the Nora Eccles Treadwell Foundation and the Richard A. and Nora Eccles Harrison Fund for Cardiovascular Research to Dr. Taccardi and a Whitaker Foundation Development Award to Dr. Rudy.
Contributor Information
Ping Jia, Cardiac Bioelectricity Research and Training Center (CBRTC) and the Department of Biomedical Engineering, Case Western Reserve University, Cleveland, Ohio
Bonnie Punske, Cardiac Bioelectricity Research and Training Center (CBRTC) and the Department of Biomedical Engineering, Case Western Reserve University, Cleveland, Ohio; and the Cardiovascular Research and Training Institute, University of Utah, Salt Lake City, Utah
Bruno Taccardi, Cardiac Bioelectricity Research and Training Center (CBRTC) and the Department of Biomedical Engineering, Case Western Reserve University, Cleveland, Ohio; and the Cardiovascular Research and Training Institute, University of Utah, Salt Lake City, Utah
Yoram Rudy, Cardiac Bioelectricity Research and Training Center (CBRTC) and the Department of Biomedical Engineering, Case Western Reserve University, Cleveland, Ohio
References
- 1.Janse MJ, Wit AL. Electrophysiological mechanisms of ventricular arrhythmias resulting from myocardial ischemia and infarction. Physiol Rev. 1989;69:1049–1069. doi: 10.1152/physrev.1989.69.4.1049. [DOI] [PubMed] [Google Scholar]
- 2.Singer I. Interventional Electrophysiology. Baltimore: Williams & Wilkins; 1997. [Google Scholar]
- 3.Sweets JL, Ben-Haim SA, Rodriguez LM, Timmermans C, Wellens HJ. New method for nonfluoroscopic endocardial mapping in humans: Accuracy assessment and first clinical results. Circulation. 1998;97:2426–2432. doi: 10.1161/01.cir.97.24.2426. [DOI] [PubMed] [Google Scholar]
- 4.Taccardi B, Arisi G, Macchi E, Baruffi S, Spaggiari S. A new intracavitary probe for detecting the site of origin of ectopic ventricular beats during one cardiac cycle. Circulation. 1987;75:272–281. doi: 10.1161/01.cir.75.1.272. [DOI] [PubMed] [Google Scholar]
- 5.Khoury DS, Rudy Y. A model study of volume conductor effects on endocardial and intracavitary potentials. Circ Res. 1992;71:511–525. doi: 10.1161/01.res.71.3.511. [DOI] [PubMed] [Google Scholar]
- 6.Khoury DS, Taccardi B, Lux RL, Ershler PR, Rudy Y. Reconstruction of endocardial potentials and activation sequences from intracavitary probe measurements. Localization of pacing sites and effects of myocardial structure. Circulation. 1995;91:845–863. doi: 10.1161/01.cir.91.3.845. [DOI] [PubMed] [Google Scholar]
- 7.Liu ZW, Jia P, Ershler PR, Taccardi B, Lux RL, Khoury DS, Rudy Y. Noncontact endocardial mapping: Reconstruction of electrograms and isochrones from intracavitary probe potentials. J Cardiovasc Electrophysiol. 1997;8:415–431. doi: 10.1111/j.1540-8167.1997.tb00807.x. [DOI] [PubMed] [Google Scholar]
- 8.Liu ZW, Jia P, Biblo LA, Taccardi B, Rudy Y. Endocardial potential mapping from a noncontact nonexpandable catheter: A feasibility study. Ann Biomed Eng. 1998;26:994–1009. doi: 10.1114/1.32. [DOI] [PubMed] [Google Scholar]
- 9.Jia P, Punske B, Taccardi B, Rudy Y. Electrophysiologic endocardial mapping from a noncontact nonexpandable catheter: A validation study of a geometry-based concept. J Cardiovasc Electrophysiol. 2000;11:1238–1251. doi: 10.1046/j.1540-8167.2000.01238.x. [DOI] [PubMed] [Google Scholar]
- 10.Gaiser J. Future catheter designs for interventional electrophysiology. In: Singer I, editor. Interventional Electrophysiology. Baltimore: Williams & Wilkins; 1997. p. 503.p. 523. [Google Scholar]
- 11.Eldar M, Ohad DG, Goldberger JJ, Rotstein Z, Hsu S, Swanson DK, Greenspon AJ. Transcutaneous multielectrode basket catheter for endocardial mapping and ablation of ventricular tachycardia in the pig. Circulation. 1997;96:2430–2437. doi: 10.1161/01.cir.96.7.2430. [DOI] [PubMed] [Google Scholar]
- 12.Schilling RJ, Peters NS, Davies DW. Feasibility of a noncontact catheter for endocardial mapping of human ventricular tachycardia. Circulation. 1999;99:2543–2552. doi: 10.1161/01.cir.99.19.2543. [DOI] [PubMed] [Google Scholar]
- 13.Rudy Y, Oster HS. The electrocardiographic inverse problem. CRC Crit Rev Biomed Eng. 1992;20:25–46. [PubMed] [Google Scholar]
- 14.Tikhonov AN, Arsenin VY. Solution of Ill-Posed Problems. Washington, DC: VH Winston & Sons; 1977. pp. 27–94. [Google Scholar]
- 15.Velipasaoglu EO, Sun H, Rao L, Khoury DS. Role of geometry in the endocardial electrocardiographic inverse problem. Chicago, Illinois: World Congress on Medical Physics and Biomedical Engineering; 2000. CD-ROM. [Google Scholar]
- 16.Wit AL, Josephson ME. Fractionaed electrograms and continuous electrical activity: Fact or artifact. In: Zipes DP, Jalife J, editors. Cardiac Electrophysiology and Arrhythmias. Orlando: Grune & Stratton; 1985. pp. 343–351. [Google Scholar]
- 17.Streeter D. Gross morphology and fiber geometry of the heart. In: Berne RM, editor. Handbook of Physiology. Baltimore: Williams & Wilkins; 1979. pp. 61–112. [Google Scholar]
- 18.Burnes JE, Taccardi B, MacLeod RS, Rudy Y. Noninvasive ECG imaging of electrophysiologically abnormal substrates in infracted hearts: A model study. Circulation. 2000;101:533–540. doi: 10.1161/01.cir.101.5.533. [DOI] [PubMed] [Google Scholar]
- 19.Spach MS, Dolber PC. Relating extracellular potentials and their derivatives to anisotropic propagation at a microscopic level in human cardiac muscle. Evidence for electrical uncoupling of side-to-side fiber connections with increasing age. Circ Res. 1986;58:356–371. doi: 10.1161/01.res.58.3.356. [DOI] [PubMed] [Google Scholar]
- 20.Rudy Y, Quan W. Propagation delays across cardiac gap junctions and their reflection in extracellular potentials: A simulation study. J Cardiovasc Electrophysiol. 1991;2:299–315. [Google Scholar]
- 21.Kleber AG, Janse MJ, van Capelle FJ, Durrer D. Mechanism and time course of S-T and T-Q segment changes during acute regional myocardial ischemia in the pig heart determined by extracellular and intracellular recordings. Circ Res. 1978;42:603–613. doi: 10.1161/01.res.42.5.603. [DOI] [PubMed] [Google Scholar]
- 22.Gardner PI, Ursell PC, Fenoglio JJ, Wit AL. Electrophysiologic and anatomic basis for fractionated electrograms recorded from healed myocardial infarcts. Circulation. 1985;72:596–611. doi: 10.1161/01.cir.72.3.596. [DOI] [PubMed] [Google Scholar]
- 23.Wang Y, Rudy Y. Action potential propagation in inhomogeneous cardiac tissue: Safety factor considerations and ionic mechanism. Am J Physiol. 2000;278 (Heart Circ Physiol):H1019–H1029. doi: 10.1152/ajpheart.2000.278.4.H1019. [DOI] [PubMed] [Google Scholar]
- 24.Fast VG, Kleber AG. Cardiac tissue geometry as a determinant of unidirectional conduction block: Assessment of microscopic excitation spread by optical mapping in patterned cell cultures and in a computer model. Cardiovasc Res. 1995;30:449–459. [PubMed] [Google Scholar]
- 25.Burnes JE, Taccardi B, Ershler PR, Rudy Y. Noninvasive electrocardiographic imaging of substrate and intramural ventricular tachycardia in infarcted hearts. J Am Coll Cardiol. 2001;38:2071–2078. doi: 10.1016/s0735-1097(01)01653-9. [DOI] [PMC free article] [PubMed] [Google Scholar]
- 26.de Bakker JM, Coronel R, Tasseron S, Wilde AA, Opthof T, Janse MJ, van Capelle FJ, Becker AE, Jambroes G. Ventricular tachycardia in the infarcted, Langendorff-perfused human heart: Role of the arrangement of surviving cardiac fibers. J Am Coll Cardiol. 1990;15:1594–1607. doi: 10.1016/0735-1097(90)92832-m. [DOI] [PubMed] [Google Scholar]
- 27.Chung MK, Pogwizd SM, Miller DP, Cain ME. Three-dimensional mapping of the initiation of nonsustained ventricular tachycardia in the human heart. Circulation. 1997;95:2517–2527. doi: 10.1161/01.cir.95.11.2517. [DOI] [PubMed] [Google Scholar]
- 28.Burnes JE, Taccardi B, Rudy Y. A noninvasive imaging modality for cardiac arrhythmias. Circulation. 2000;102:2152–2158. doi: 10.1161/01.cir.102.17.2152. [DOI] [PMC free article] [PubMed] [Google Scholar]


