

Abstract
The aim of this study was to differentiate the processing of nociceptive information, matched for pain intensity, from capsaicin-induced hyperalgesic vs. control skin at multiple levels in the trigeminal nociceptive pathway. Using an event-related fMRI approach, 12 male subjects underwent three functional scans beginning 1 hour after topical application of capsaicin to a defined location on the maxillary skin, when pain from capsaicin application had completely subsided. Brush and two levels of painful heat (low - Thermal-1 and high - Thermal-2) were applied to the site of capsaicin application and to the mirror image region on the opposite side. Temperatures for each side were set to evoke perceptually-matched pain (mean temperatures [capsaicin/control]: Thermal-1=38.4/42.8°C; Thermal-2=44.9/47.8°C). We found differences in activation patterns following stimuli to treated and untreated sides in sensory circuits across all stimulus conditions. Across the trigeminal nociceptive pathway, Thermal-2 stimulation of hyperalgesic skin evoked greater activation in trigeminal ganglion and nucleus, thalamus, and somatosensory cortex than the control side. Thus, trigeminal nociceptive regions showed increased activation in the context of perceptually equal pain levels. Beyond these regions, contrast analyses of capsaicin vs. control skin stimulation indicated significant changes in bilateral dorsolateral prefrontal cortex and amygdala. The involvement of these emotion-related regions suggests that they may be highly sensitive to context, such as prior experience (application of capsaicin) and the specific pain mechanism (hyperalgesic vs. normal skin).
Keywords: Pain, sensitization, dorsolateral prefrontal cortex, amygdala, S1, brush
Capsaicin-induced sensitization is considered to be a model for the hyperalgesic and allodynic states observed with neuropathic pain. Sensitization refers to the physiological phenomena of increased neural activity in response to a given stimulus intensity, while allodynia and hyperalgesia refer to perceptual symptoms. Applied topically or injected subcutaneously, capsaicin can produce a temporary state of behavioral hypersensitivity to thermal and mechanical stimuli in a healthy subject, similar to the chronic sensory symptoms of a patient with neuropathic pain (Baron, 2000; LaMotte et al., 1991; Simone et al., 1987; Treede et al., 1992). While capsaicin-induced sensitization has been demonstrated at the nociceptor level (Ren et al., 2005; Schmelz et al., 2000; Serra et al., 2004), sensitization also occurs at spinal (Simone et al., 1991) and supraspinal levels (Lorenz et al., 2002). Numerous studies considering capsaicin-induced hyperalgesia and allodynia in the human have identified several brain areas with enhanced activity (Baron et al., 2000; Iadarola et al., 1998; Iannetti et al., 2005; Lorenz et al., 2002; Maihofner and Handwerker, 2005; Malisza and Docherty, 2001; Witting et al., 2001; Zambreanu et al., 2005).
However, these studies have not adequately addressed the influence of peripheral sensitization with respect to increased central activation with allodynic or hyperalgesic pain. Increased activation beyond first-order nociceptive neurons does not necessarily reflect central sensitization. A set stimulus level on hyperalgesic skin could produce increased afferent activity, and thus increased central activity as an intensity coding process. While previous studies have shown physiological changes supraspinally during hyperalgesia, the contribution of nociceptive circuitry preceding cortical processing in this state is unclear.
Previously, a positron emission tomography (PET) study attempted to use perceptually-matched stimuli to document changes in activation patterns in brain regions involved in the processing of thermal pain following capsaicin-induced allodynia (Lorenz et al., 2002). Relative to stimulation of normal skin, perceptually-matched thermal stimulation with capsaicin-induced heat allodynia revealed increased activity in medial thalamic nuclei, putamen, insula, anterior cingulate, prefrontal, and orbitofrontal cortices. These results indicated a dissociation between activity and perceived pain intensity, which they attributed to changes in cognitive and emotional responses to stimulation of capsaicin-sensitized skin. However, the supraspinal changes could have merely reflected increased afferent input with the presence of peripheral sensitization. The aim of the current study was to measure the relationship between peripheral and central activation when equally painful stimuli are presented to hyperalgesic vs. control skin.
The classical trigeminothalamocortical nociceptive pathway provides an opportunity to examine the effects of capsaicin-induced sensitization from the primary afferents to the cortex. It can be broken down into four main processing regions: the trigeminal ganglion (TG), subnucleus caudalis of the trigeminal brainstem complex (spV), thalamus, and the primary somatosensory cortex (S1). The trigeminal ganglion can encode noxious stimuli from the periphery, and sends this information to nociceptive neurons in the ipsilateral spV. The spV projects axons to the contralateral thalamus, where it relays nociceptive signals to S1 and other cortical structures. Somatotopic activation has been demonstrated in each of these regions with fMRI in response to noxious heat applied to the face (DaSilva et al., 2002; Borsook et al., 2003). The trigeminal pathway presents a practical model in which to measure sensitization along a nociceptive processing stream.
While the blood oxygen level dependent (BOLD) signal in the cortex has been correlated with slow varying field potentials (Logothetis et al., 2001) and action potentials (Thompson et al., 2003), the signal in the TG has not been defined. However, with stimulation, action potential firing presumably increases and the vascular innervation of the ganglion provides a substrate for BOLD signal changes. Potential issues related to measuring BOLD signals in TG have been discussed previously in a report describing somatotopic activations in the ganglion to heat and brush stimuli (Borsook et al., 2003).
The current study differs from the previous work in a number of important ways: (1) measurement of activity in trigeminal ganglion and the medullary dorsal horn using a region of interest (ROI)-based approach, as well as a whole-brain analysis; (2) more closely matched pain intensities, using supra-threshold ratings rather than thresholds; (3) reduced scanner variability by contrasting capsaicin and control within the same scan; and (4) the increased spatial and temporal resolution of fMRI compared to PET. The null hypothesis was that there would be no differences in activation of nociceptive pathways following perceptually-matched painful heat applied to hyperalgesic vs. control skin. Any differences should reflect alterations in neural processing in categorization, transmission, and evaluation of peripheral inputs in non-sensory pathways.
Methods
Subjects
This study was approved by the McLean Hospital Institutional Review Board, and met the scientific and ethical guidelines for human pain research of the Helsinki Accord and the International Association for the Study of Pain. Seventeen healthy males were recruited through advertisements circulated in the Boston metropolitan area. All subjects provided informed consent to participate in this study. Three subjects were excluded following psychophysical screening (see below), one was excluded due to scanner problems, and one was unable to complete his fMRI session. The remaining 12 subjects averaged 30±7 years in age, and all but one were right-handed.
Pre-scan Paradigm (Figure 1A)
Figure 1.

Experimental paradigm. A) Pre-scan testing. For 25 minutes 0.075% capsaicin cream was applied to the left V2 area (CAP V2), and a control applied to the right side (CON V2). For each side of the face, an ascending series of temperatures was presented to customize stimulus levels of Thermal-1 (pain intensity VAS=∼2) and Thermal-2 (VAS=∼7) for each subject. After the ascending series on CAP V2, a single Thermal-2 stimulus was applied to CON V2, to verify that the temperature for Thermal-2 on CON V2 and the temperature for Thermal-2 on CAP V2 felt similar to the subject. B) Stimulus delivery during fMRI scans. Each graph depicts stimulus delivery alternating between CAP V2 (red trace) and CON V2 (black trace). The Thermal-1 and Thermal-2 scans consisted of within-scan perceptually-matched temperatures, while the Brush scan used physically identical brushing stimuli. The scans were performed in the order presented here.
Capsaicin application
Capsaicin cream (0.075% concentration; Zostrix, Rodlen Laboratories, Inc., Vernon Hills, IL) was applied topically to the left side of his face, within the receptive field of the maxillary division of the trigeminal nerve (V2). A dermatological bandage with a 1.6×1.6 cm square cut out was used to limit the area directly exposed to the capsaicin cream, and a plastic film was placed over the application. A control cream (Lubriderm Sensitive Skin Therapy Moisturizing Lotion, Pfizer Consumer Healthcare, Morris Plains, NJ) was applied to the V2 area on the right side at the same time in a similar manner. The cream applications were left on for 25 minutes. Upon application of the creams, the subject alternately rated overall pain intensity and unpleasantness (see Supplemental Text 1) every 30 seconds using a computerized on-line visual analog scale (VAS).
The VAS was presented using the software package LabVIEW 5.1 (National Instruments Corp., Austin, TX) and the subject given a hand-held analog dial to rate his sensation. The scale was presented horizontally and labeled as “PAIN” or “UNPLS”, for pain intensity and unpleasantness, respectively. The markers on the extremes of the scale were “No Pain” and “Max Pain” for pain intensity, and “Min” and “Max” for unpleasantness. Subject ratings were stored digitally as numerical values from 0 to 10, though the VAS presented to the subject did not contain numbers. After the 25 minutes of cream application, the creams on both sides were thoroughly wiped off using a tissue, and the bandage was removed.
Thermal stimulation
All thermal stimuli were delivered using a 1.6×1.6cm contact thermode (TSA-II, medoc Advanced Medical Systems, Ramat Yishai, Israel). A homemade head cage, complete with two thermode holders, was created to fit around the MRI headcoil. One thermode was affixed to the capsaicin-treated (CAP) V2 area, and the other to the control-treated (CON) V2 area. At rest, the thermodes maintained a steady baseline temperature of 32°C. Stimuli were applied for 24 seconds, which included the rise time and return time to baseline. The effective rate of rise was 5°C/sec, while the rate of return was 4.5°C/sec. The inter-stimulus interval was 30 seconds.
After removal of the capsaicin and control creams using a tissue, an ascending series of temperatures was presented to each V2 area using 1°C increasing steps (Figure 1A). For each subject, two temperature levels reflecting minimal pain (Thermal-1: pain intensity VAS∼2) and substantial, yet tolerable pain (Thermal-2: pain intensity VAS∼7) were identified for CAP and CON V2. The temperatures selected for CON V2 were significantly greater than the temperatures for CAP V2 for both Thermal-1 [one-tailed paired t-test: t(11)=7.9329, p<0.0001] and Thermal-2 perceptual levels [t(11)=6.4590, p<0.0001]. The mean difference between the temperatures for CAP vs. CON V2 was 4.4±1.5°C for Thermal-1 and 2.9±1.2°C for Thermal-2. Subjects who showed no signs of thermal hyperalgesia (i.e. no difference in ratings for CAP vs. CON in response to the same temperature) were excluded from the study (n=2). Additionally, one subject was excluded for being a poor discriminator of temperatures (could not discriminate between a 40°C and 49°C stimulus).
Scanning Experimental Paradigm (Figure 1B)
Stimuli
Just over one hour after the capsaicin cream was removed, when pain due to the application had resolved completely, each subject underwent three fMRI scans, each focusing on one of three stimulus conditions, in this order: Thermal-1, Thermal-2, and Brush (Figure 1B). Each scan consisted of twelve 24 sec-on/30 sec-off stimulus cycles, with stimuli alternating between CAP and CON V2. The Brush stimulus consisted of 1Hz brushing of V2 along the superior-inferior axis. Brush stimuli were applied to the face using a lever system attached to a specially designed wooden frame overlying the MRI headcoil. Plastic/nylon materials allowed us to brush the face while standing at the feet of the subject.
A 24-sec rekindling thermal stimulus (the Thermal-2 stimulus for CAP V2, presented bilaterally) preceded the Thermal-1 scan, and was again presented prior to the Thermal-2 scan. This rekindling was performed to maintain capsaicin-induced hyperalgesia (Petersen and Rowbotham, 1999). A rekindling stimulus was not provided prior to the Brush scan, as the subject had been repeatedly exposed to the Thermal-2 stimulus before the Brush scan.
Every subject alternately rated pain intensity (n=3 stimulus blocks rated/V2 side) or pain unpleasantness (n=3 stimulus blocks rated/V2 side) using an online VAS scale projected onto a screen outside of the scanner. The subjects rated the first stimulus block with respect to pain intensity, and rated pain unpleasantness during the following stimulus block to the same V2 side. Subject ratings continued this alternating pattern until all 6 stimulus blocks were completed for each V2 side. As the act of rating strongly activates primary motor cortex contralateral to the hand being used, this could confound detection of activation in nearby S1 relating to stimulus application. Subjects were instructed to perform their rating with the hand opposite the side of stimulation, so as to separate dominant motor and somatosensory activations into separate hemispheres. The VAS scale also prompted subjects with which hand to rate each stimulus (LH or RH). In the event that the subjects felt no pain or unpleasantness during the brushing stimuli, subjects were told to move the VAS cursor to the center of the scale and to oscillate their rating with the brush strokes. This task was included to clarify that the pain vs. no pain contrast was not simply a rating vs. a lack of rating comparison. After the fMRI scans, subjects chose from a list of qualitative descriptors from the Gracely Pain Scale (Gracely et al., 1978) to report the sensory and affective intensity evoked by the stimuli.
Data Acquisition and Analysis
Image acquisition
Imaging was realized using a 3T Siemens Trio scanner with a quadrature head coil. Anatomical images were acquired using a magnetization prepared rapid gradient echo (MPRAGE) sequence (128 1.33mm-thick slices with an in-plane resolution of 1 mm (256×256)). Tissue-air interface areas can cause susceptibility effects, which lead to localized distortions in the EPI (functional) images. Such distortions can also arise from the presence of the thermode on the face. Two series of images (T2 weighted Magnitude and Phase images) were acquired using a non-EPI spin echo sequence to estimate susceptibility distortions, and were used to correct EPI images utilizing FSL (FMRIB's Software Library, www.fmrib.ox.ac.uk/fsl (Smith et al., 2004)). For elaboration of the unwarping technique and theory, refer to its primary source (Jenkinson, 2001). Slice location, number, and thickness were the same as the ones used in the functional scans. Thermal-1, Thermal-2, and Brush functional scans were acquired as described in the paradigm (Figure 1B). Each functional scan consisted of 33 slices coronally oriented to match the brainstem axis and covering the middle region of the cerebrum. Slices were 3.5mm thick with in-plane resolution of 3.5 mm (64×64). A Gradient Echo (GE) echo planning imaging (EPI) sequence with TE/TR = 30/2000 was used to acquire the data. Three hundred and forty four brain volume images were captured for each functional scan, at the rate of one volume every 2 seconds. This resulted in a scan time of 11:28 per functional acquisition.
Individual subject level image processing
Functional imaging datasets were processed and analyzed using scripts within FSL. The initial four volumes were removed from each of the functional scans to allow for signal equilibration. Visual screening of the functional volumes revealed that none of the subjects showed indications of gross movement (>1 voxel). The skull and other non-brain areas were extracted from the anatomical and functional scans using FSL's script Brain Extraction Tool (BET). Motion Correction using FMRIB's Linear Image Registration Tool (MCFLIRT) was performed on each functional scan. The functional scans were unwarped using FMRIB's Utility for Geometrically Unwarping EPIs (FUGUE), and all volumes were mean-based intensity normalized by the same factor. The volumes were spatially smoothed with a 6 mm full-width at half-maximum filter, and a high-pass temporal filter was applied (sigma=54.0 sec). These functional images were then co-registered with the anatomical images using FMRIB's Linear Image Registration Tool (FLIRT).
First-level fMRI analysis of single subject data was performed using FMRI Expert Analysis Tool using FMRIB's Improved Linear Model (FEAT FILM) Version 5.4 with local autocorrelation correction (Woolrich et al., 2001). For the Thermal-1 and Thermal-2 scans, the temperature profiles recorded from the CAP and CON V2 thermodes were entered as separate explanatory variables (EVs), as were their temporal derivatives. The EVs for brushing stimuli were entered as boxcar functions. The EVs were convolved with a gamma function incorporating a 3 sec standard deviation and a 6 sec hemodynamic lag.
Region of interest-based analysis
A region of interest (ROI) based approach was used to trace activation changes along the classic trigeminal nociceptive pathway. A traditional whole-brain group analysis would dilute the signal in these regions, given the small size of many of these ROIs and inter-individual anatomical variation. This is particularly likely in the brainstem, where conventional transformations from original to standardized space consider primarily cortical references.
The trigeminal nociceptive pathway has been segregated into five main ROIs for the purposes of this study: TG, dorsolateral caudal brainstem (BS(c)), dorsolateral pontine brainstem (BS(p)), thalamus, and S1 (Supplemental Figure 1). These ROIs were chosen based on prior fMRI studies on the trigeminal nociceptive pathway (Borsook et al., 2003; DaSilva et al., 2002). The ganglia, brainstem, and S1 ROIs were individually hand-drawn for each subject based on their high-resolution anatomical scans (Supplemental Table 1). The ROIs for thalamus were identified in MNI space using wfu_pickatlas (Lancaster et al., 2000; Maldjian et al., 2003), and transformed back into original space.
a. Single Trial Averages (STAs)
STAs were calculated using in-house programs implemented via MATLAB (Release 7.2, Mathworks Inc., Natick, MA, USA) in combination with functional time courses and activation maps. For each subject, activation masks for each ROI were created based on uncorrected thresholding of the z-statistics (z>1.64) for both the CAP and CON condition for all three stimuli (Brush, Thermal-1, Thermal-2). The mean time course for each ROI was extracted from each subject's demeaned raw functional image, for each of the three stimulus types. Subjects without significant activation in a given ROI had their time course intensities set to zero. The EVs for each condition and stimulus were used to define each specific “trial”. A trial was defined as the period consisting of 10 seconds prior to the beginning of the stimulus, and 50 seconds immediately following the beginning of the stimulus. This captured the duration of a stimulus response and its recovery without overlapping in time with the following stimulus. A trial average was calculated for each ROI, each stimulus, and each condition by taking the average time course of the trials. To measure a group STA response, the average and standard error at each time point of every subject's trial average was calculated.
b. Logistic Regression
For each stimulus type, logistic regression analysis was performed to assess the differentiability of two conditions, CAP and CON, based on activations (or contrasts of parameter estimates [COPEs]) within the selected ROIs (Pendse et al., 2006). A multivariate approach based on logistic regression attempts to distinguish the two groups based on all ROIs at once. This approach has several advantages: (1) it makes no assumptions about the distribution of the underlying data (such as normality); (2) likelihood ratio tests and Wald tests determine which variables are important for discrimination; and 3) an estimate of misclassification error is produced, which evaluates the model fit quality. ROI COPEs were sampled from significantly active voxels (z>1.64, uncorrected), and zero values were substituted for subjects without significant voxels.
Logistic regression was used to determine the separability of CAP and CON, because nonparametric ROI-wise tests (e.g. Kruskal-Wallis) were not significant. The lack of a difference with a two-sample comparison would not suggest the statistical weakness of a multivariate approach, but rather a different statistical interpretation of the data. Since each ROI was not able to discriminate the two groups individually, this multivariate approach was used to determine whether the ROI set could discriminate these two states as a whole.
Group level whole-brain image analysis (Figure 2A)
Figure 2.

Whole brain analysis approach. A) Hemispheric flipping procedure for the contrast of CAP vs. CON V2 activation. Circles represent the subject's face, and the red square indicates the capsaicin site. I: ipsilateral to stimuli, C: contralateral to stimuli, L: left, and R: right. Beneath each stylized face are the explanatory variables (EVs) for the stimulus applied, and a schematic of its corresponding activation map. The second row of figures show the control activation map being hemispheric flipped along the y-axis, so that the brain areas contralateral to stimulus application are coincident. The contrast is performed between these reoriented images. B) Modeling hemispheric lateralized activity. A general linear model analysis creates an activation map based on stimulus application (regardless of the side of the face being stimulated). The original orientation for these images is maintained for both (i.e. not flipped). Red indicates activation and blue is deactivation. The second brain image shows the conversion of hemispheric lateralized activity into a spatial mask (in yellow). This mask reflects a mirroring of the hemispheric lateralized activity from the image above it. This mask is applied to the image from the contrast analysis, thereby creating a conservative contrast image. This is meant to correct for possible artifacts created by the flipping process.
Prior to group analysis, all first-level statistical maps were transformed to Montreal Neurological Institute (MNI) space. For each stimulus type, group activation maps were generated by fMRI expert analysis tool (FEAT) fMRIB's Local Analysis of Mixed Effects (FLAME) for CAP V2 and CON V2 separately. Statistical maps were thresholded using a mixture modeling approach to identify categories of activated and deactivated voxels (Everitt and Bullmore, 1999; Woolrich et al., 2005). In a conventional GLM, the same design matrix is used at every voxel in the brain with the noise as a multivariate Gaussian (Friston et al., 1995). However, incorrect modeling assumptions or unmodeled signals can result in a shifted and scaled null distribution. Recently, networks in the human brain have been identified that show similar patterns of activity even at rest (De Luca et al., 2005). Thus, under the null hypothesis, regions having similar patterns of activity can be expected to have differently scaled and shifted Gaussian distributions. This variability was accounted for by using Gaussian Mixture Modeling (GMM; Supplemental Text 2), a multiple comparisons-based analysis generally used for unsupervised classification of data into multiple categories (Pendse et al., 2006). A minimum cluster criterion of 7 voxels in original space (38 significant voxels in MNI space) was also implemented.
Contrast analysis (Figure 2A)
This analysis determined which regions were modulated after capsaicin application, relative to the side of stimulation. To directly compare mirror-like activations on our voxel-by-voxel approach, we flipped brains for control stimulation left to right in order to align them with the activations following stimulation to the capsaicin treated side of the face. The use of flipped brains in fMRI analysis is a well-described procedure in clinical pain studies (Maihofner et al., 2006; Pleger et al., 2006; Schweinhardt et al., 2006).
The parameter estimate maps for CON V2 stimulation were flipped along the y-axis to correspond with the stimulus lateralization of CAP V2 stimulation. That is, the statistical maps for the CAP and CON V2 condition were arranged such that areas contralateral and ipsilateral to stimulation corresponded in space. Paired contrast maps were separately generated for each of the functional scans. Significant differences were determined using the GMM method as described above.
To compare BOLD responses to stimulation of different sides of the face, a major potential confound needed to be addressed: hemispheric lateralized activity (Bingel et al., 2002, 2003; Brooks et al., 2002; Coghill et al., 2001). Hemispheric lateralized activity is a stimulus response that is evoked regardless of the side of stimulation (e.g. spatial attention). Such areas would confound a contrast using a brain flipping approach.
To reduce the likelihood of this possibility, a spatial mask was created to identify areas with hemispheric lateralized activity and to exclude these regions from the contrast analysis (Figure 2B; Supplemental Text 3).
Results
Capsaicin application
Pre-scanning psychophysics
The capsaicin application evoked painful and unpleasant sensations in all subjects (Figure 3A). Average maximum pain intensity reported was 3.7±2.5 (SD), with a range from 0.7 to 9.4. Average maximum unpleasantness was 3.9±2.5 (SD), with a range from 0.9 to 8.9.
Figure 3.
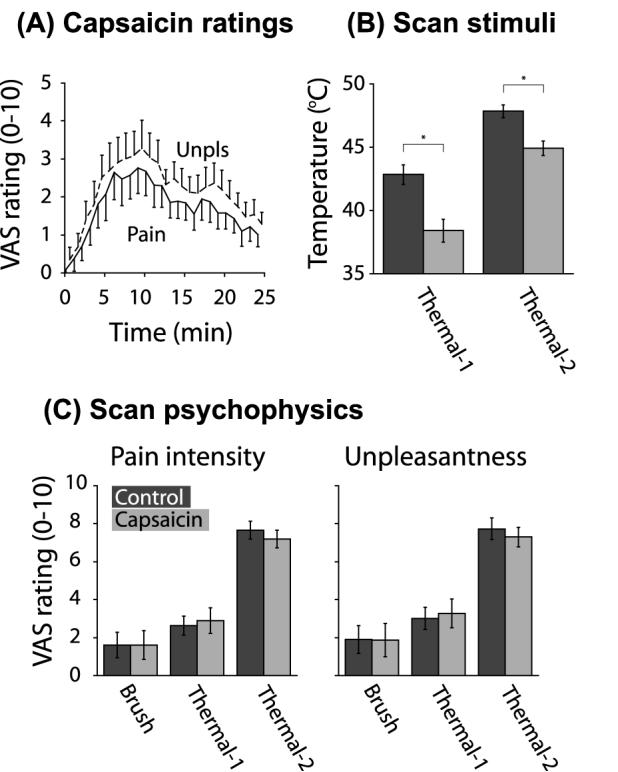
Psychophysical and stimulus data. A) Group on-line ratings of pain intensity and pain unpleasantness during capsaicin application. The cream was applied at time 0. Mean±SE. B) Mean temperatures applied to CON vs. CAP V2 for Thermal-1 and Thermal-2. Mean±SE. *One-tailed paired t-test, p<0.0001. C) Group psychophysical ratings obtained during the Brush, Thermal-1, and Thermal-2 scans. The Brush psychophysical data from one subject was lost due to a computer error. Pain intensity ratings – the maximum pain intensity perceived was recorded per stimulus event, averaged across like events, and averaged across subjects. No significant difference in pain intensity was observed between CAP and CON V2 during the Brush [two-tailed paired t-test: t(10)=0.0765, p>0.1], Thermal-1 [t(11)=0.9031, p>0.1], and Thermal-2 scans [t(11)=1.9751, p>0.05]. Unpleasantness ratings – the maximum unpleasantness perceived was recorded per stimulus event, averaged across like events, and averaged across subjects. No significant difference in unpleasantness was observed between CAP and CON V2 (two-tailed paired t-test) during Brush [t(10)= 0.3606, p>0.1], Thermal-1 [t(11)=1.2562, p>0.1], and Thermal-2 scans [t(11)=0.6717, p>0.1]. Mean±SE.
fMRI Psychophysics
By the time of the beginning of the first scan, no subjects reported residual baseline pain from the capsaicin application. On-line perceptual ratings indicated that Thermal-1 and Thermal-2 stimuli (Figure 3B) were successful in evoking matched pain intensity levels in CAP vs. CON V2 during scanning (Figure 3C, Figure 4A). The reports during the Brush scan failed to show a significant difference between the two sides. The post-scan sensory and affective descriptors reported for each stimulus condition indicate that the qualitative sensations were comparable, though not identical, between CAP and CON V2 (Figure 4B, Figure 5).
Figure 4.

Within-subjects comparison of capsaicin vs. control ratings. A) Online VAS ratings (0-10) for pain intensity and unpleasantness during scanning. Each dot represents an individual's response to a stimulus applied to CAP V2 plotted against the response to the same stimulus applied to CON V2. The solid black line is the curve fit to the data. The hashed line is the ideal relationship for matched perceptual intensity (slope = 1). Mean±SD. B) Post-scan retrospective ratings from the Gracely Pain Scale. The ascending qualitative descriptors were converted to unitary numerical values from 1-15. Each subject made only one report per stimulus condition.
Figure 5.

Qualitative Psychophysical Reports. Histogram of sensory and affective descriptors reported for each scan after completion of the scan sessions. Subjects selected one descriptor which best characterized their perceptual experience. The figure is a histogram of those responses across all 12 subjects. Every subject accounted for exactly 1 report for each stimulus condition. The categories along the x-axis are the qualitative descriptors listed in the Gracely Pain Scale.
ROI-based analysis
Single trial average responses
STAs of the BOLD signal showed clear responses to each of the stimulus conditions across ROIs (example of responses in the S1 ROI, Figure 6A).
Figure 6.

Differences in Capsaicin vs. Control V2 responses in trigeminal nociceptive pathway ROIs. A) Example of functional time series group single trial average (STA) responses to Brush, Thermal-1, and Thermal-2 stimuli. Black bar denotes application of stimuli. The STA response was shifted in the y-axis for each stimulus condition, such that the median of the five pre-stimulus time points was set to zero. Mean±SE. B) Direction of median differences of sampled COPE values from trigeminal ROIs in CAP V2 with respect to CON V2. The S1 and Thal ROIs are contralateral to the stimulus application, while the BS(p), BS(c), and TG ROIs are ipsilateral. All ROIs were found to be important for discrimination in the logistic regression analysis, except for S1 with Thermal-1 stimulation (Supplemental Table 2). Quantitative values are not comparable across ROIs, due to the variable relationship between the BOLD signal and physiological activity across the ROIs. The overall classification accuracy using all ROIs was in the range of 60-70% for all three stimuli.
Logistic regression
Logistic regression multivariate analysis indicated that activation from stimulation of CAP and CON V2 could be distinguished on the basis of fMRI intensity values sampled across the five ROIs of the classical trigeminal nociceptive pathway (Supplemental Table 1). Z-statistic values (Wald's test) for all ROIs were significant, except for S1 with regards to Thermal-1 stimulation (z=0.3). This indicates the participation of nearly every ROI in discrimination between group CAP and CON during brushing and thermal stimulation. Median changes of the ROIs in the two groups showed largely the same qualitative pattern for Thermal-1 and Thermal-2 (Figure 6B). Brush stimuli produced increased CAP responses in all trigeminal ROIs, with the exception of TG (Figure 6B).
Whole-brain group fMRI results
With group-level analysis, thermal and brush stimulation to CON V2 produced activation and deactivation throughout the cortex, brainstem, and cerebellum. The painful thermal stimuli activated areas commonly identified in pain studies, including the insula (anterior, middle, and posterior), anterior cingulate cortex (ACC), S1, secondary somatosensory cortex (S2), and thalamus. Of note, deactivation was observed in the amygdala for Thermal-2, but not with the less painful Thermal-1 stimuli. Brush stimuli to CON V2 produced activation in areas found active in somatosensory studies, particularly insula and S2. Similar spatial patterns of activation were observed with stimulation to CAP V2 using Thermal-1, Thermal-2, and Brush.
Contrast analysis
When comparing activation patterns following perceptual intensity-matched stimuli, significant differences were found between responses to thermal stimuli delivered to CAP and CON V2 (Figure 7, Table 1). Thermal stimulation of CAP V2 elicted larger responses than CON V2 in contralateral frontal cortices (superior, middle, and inferior), ipsilateral cerebellum, and areas in or near ipsilateral amygdala (Figure 8). Decreased responses relative to control were found mostly opposite areas with increased responses, but also in the ipsilateral thalamus and inferior parietal lobe.
Figure 7.

Venn diagram summary of Capsaicin vs. Control contrast. (A) Regions that show greater activation in response to stimulation to CAP V2 than to CON V2 (Capsaicin > Control). Capsaicin V2 responses were significantly greater than control in more areas following brush than thermal stimuli. All three stimuli showed increased responses in amygdala, cerebellum, and DLPFC with Capsaicin V2 stimulation. (B) Regions that show greater activation in response to stimulation to CON V2 than to CAP V2 (Capsaicin < Control). Capsaicin V2 responses were significantly lower than control in more areas with thermal stimuli than brush. Red font=areas active contralateral to stimulus. Blue font=areas active ipsilateral to stimulus. S1=Primary somatosensory cortex, MFG=Middle frontal gyrus, DLPFC=Dorsolateral prefrontal cortex, IFG=Inferior frontal gyrus, PrG=Precentral gyrus, ACC=Anterior cingulate cortex, PCC=Posterior cingulate cortex, PCL=Paracentral lobule, IPL=Inferior parietal lobule, SN=Substantia nigra, STG=Superior temporal gyrus, FFG=Fusiform gyrus, MTG=Middle temporal gyrus, ITG=Inferior temporal gyrus, NAc=Nucleus accumbens.
Table 1A.
Contrast analysis – CAP>CON
| Local maxima | |||||
|---|---|---|---|---|---|
| Area | Side | x | y | z | Max Z |
| Thermal-1 (z>2.71) | |||||
| MFG (9) | C | 36 | 14 | 32 | 3.80 |
| Amygdala | I | −24 | 2 | −24 | 3.24 |
| STG (38) | I | −38 | 8 | −22 | 3.29 |
| Cerebellum | I | −28 | −78 | −48 | 3.81 |
| Thermal-2 (z>2.43) | |||||
| SFG (9) | C | 20 | 34 | 34 | 3.53 |
| MFG (46) | C | 44 | 34 | 30 | 3.27 |
| IFG (46) | C | 42 | 38 | 14 | 3.80 |
| STG (22) | C | 58 | −34 | 4 | 3.95 |
| STG (38) | I | −30 | 8 | −24 | 3.69 |
| Hippocampus | I | −32 | −18 | −36 | 3.64 |
| ITG (20) | C | 44 | −2 | −44 | 4.66 |
| Cerebellum | I | −46 | −58 | −44 | 3.44 |
| I | −32 | −68 | −38 | 3.34 | |
| Brush (z>3.10) | |||||
| MFG (6) | C | 22 | 10 | 68 | 3.67 |
| MFG (9) | C | 52 | 20 | 30 | 3.24 |
| IFG (46) | C | 54 | 34 | 10 | 3.54 |
| IFG (47) | I | −22 | 22 | −16 | 2.94 |
| Mid. insula (13) | C | 44 | 8 | −8 | 3.43 |
| I | −36 | −6 | 6 | 3.11 | |
| ACC (24) | C | 2 | −10 | 46 | 3.29 |
| PCC (31) | C | 20 | −64 | 14 | 4.49 |
| PCL (6) | C | 12 | −26 | 48 | 3.79 |
| IPL (40) | C | 36 | −36 | 42 | 3.51 |
| S1(3) | I | −50 | −16 | 50 | 3.41 |
| PrG (4) | C | 34 | −24 | 54 | 3.56 |
| Amygdala | C | 16 | −6 | −16 | 3.59 |
| I | −24 | −2 | −16 | 3.01 | |
| NAc | I | 6 | 4 | −8 | 3.22 |
| Thalamus, Pulv | C | 20 | −26 | 8 | 2.97 |
| SN | C | 12 | −20 | −14 | 3.10 |
| STG (22) | C | 50 | −26 | −4 | 3.34 |
| I | −56 | −8 | 4 | 3.54 | |
| I | −46 | −52 | 22 | 3.29 | |
| MTG (22) | C | 60 | −34 | 2 | 4.04 |
| FFG (37) | I | −42 | −40 | −20 | 3.50 |
| Cerebellum | C | 20 | −76 | −34 | 4.54 |
| I | −50 | −60 | −42 | 3.79 | |
| I | −24 | −68 | −22 | 3.35 | |
| I | −22 | −30 | −36 | 3.52 | |
| I | −24 | −68 | −22 | 3.35 | |
| I | −14 | −44 | −48 | 3.18 | |
| Table 1B. Contrast analysis – CAP<CON | |||||
|---|---|---|---|---|---|
| Local maxima | |||||
| Area | Side | x | y | z | Max Z |
| Thermal-1 (z>2.83) | |||||
| MFG (8) | I | −32 | 22 | 46 | 3.64 |
| IFG (46) | I | −40 | 16 | 24 | 3.46 |
| IFG (47) | I | −38 | 26 | −16 | 3.52 |
| Post. insula (13) | I | −46 | −22 | 22 | 3.57 |
| ACC (24) | C | 8 | −2 | 46 | 3.65 |
| IPL (40) | I | −64 | −40 | 22 | 3.46 |
| S1 | I | −44 | −26 | 52 | 3.83 |
| PrG (4) | I | −40 | −12 | 52 | 3.99 |
| PrG (6) | I | −50 | −8 | 40 | 4.02 |
| C | 44 | −18 | 64 | 3.72 | |
| Uncus (34) | C | 28 | 4 | −26 | 3.44 |
| Thalamus, MD | I | −8 | −16 | 10 | 3.26 |
| Thalamus, VL | I | −12 | −14 | 8 | 3.63 |
| STG (22) | I | −64 | −36 | 12 | 3.61 |
| MTG (21) | I | −58 | −52 | 0 | 3.67 |
| I | −48 | −30 | −6 | 3.47 | |
| ITG (37) | I | −52 | −62 | −14 | 3.90 |
| Cerebellum | C | 40 | −72 | −26 | 4.10 |
| C | 26 | −74 | −50 | 3.56 | |
| C | 6 | −62 | −58 | 3.43 | |
| Thermal-2 (z>3.09) | |||||
| SFG (9) | I | −18 | 50 | 38 | 3.52 |
| MFG (8) | I | −24 | 20 | 50 | 3.25 |
| MFG (46) | I | −44 | 34 | 22 | 3.94 |
| IFG (47) | I | −40 | 22 | −16 | 3.31 |
| Post. insula (13) | C | 44 | −20 | 12 | 3.19 |
| PCL (5) | I | −4 | −36 | 50 | 3.64 |
| IPL (40) | I | −44 | −48 | 42 | 4.06 |
| Precuneus (7) | I | −14 | −44 | 46 | 3.72 |
| PrG (4) | C | 54 | −14 | 58 | 3.77 |
| C | 26 | −30 | 56 | 3.86 | |
| I | −52 | −14 | 42 | 3.57 | |
| PrG (6) | I | −62 | −6 | 12 | 3.50 |
| Thalamus, MD | I | −8 | −16 | 14 | 3.60 |
| Thalamus, VL | I | −16 | −12 | 8 | 3.09 |
| STG (38) | C | 32 | 8 | −20 | 4.22 |
| MTG (21) | I | −54 | −60 | 0 | 3.73 |
| I | −50 | −26 | −6 | 4.05 | |
| C | 56 | 4 | −36 | 3.25 | |
| NAc | C | 14 | 2 | −2 | 2.85 |
| Cerebellum | C | 38 | −72 | −28 | 4.56 |
| C | 8 | −62 | −44 | 3.34 | |
| I | −8 | −64 | −14 | 3.94 | |
| I | −4 | −76 | −40 | 4.07 | |
| I | −22 | −52 | −24 | 3.44 | |
| I | −26 | −58 | −60 | 4.08 | |
| Brush (z>2.67) | |||||
| S1 (3) | C | 48 | −20 | 58 | 3.28 |
| PrG (4) | C | 38 | −18 | 60 | 3.37 |
| C | 48 | −20 | 42 | 3.34 | |
Key: Thresholds were determined using the Gaussian Mixture Modeling technique described in the text. S1=Primary somatosensory cortex, SFG=Superior frontal gyrus, MFG=Middle frontal gyrus, IFG=Inferior frontal gyrus, STG=Superior temporal gyrus, MTG=Middle temporal gyrus, ITG=Inferior temporal gyrus, ACC=Anterior cingulate cortex, PCC=Posterior cingulate cortex, PCL=Paracentral lobule, IPL=Inferior parietal lobule, PrG=Precentral gyrus, NAc=Nucleus accumbens, Pulv=Pulvinar, SN=Substantia nigra, FFG=Fusiform gyrus, MD=Mediodorsal thalamic nucleus, VL=Ventrolateral thalamic nucleus.
Figure 8.

Capsaicin vs. Control contrast for thermal stimuli. Transparent yellow areas reflect the hemispheric lateralized activation mask specific for each stimulus (see Methods). Analysis was restricted to areas outside of these masks. Contrast thresholding was performed using generalized mixture modeling (see Methods). For presentation, statistical images have been spatially smoothed using low pass Gaussian linear filtering with a sigma of 2 mm. IFG=inferior frontal gyrus, MFG=middle frontal gyrus, SFG=superior frontal gyrus, STG=superior temporal gyrus.
Brush stimulation of CAP V2 induced increased activation relative to CON V2 stimulation predominantly in contralateral frontal cortices (middle and inferior), contralateral posterior cingulate cortex, midcingulate cortex, bilateral amygdala, the paracentral lobule, ipsilateral cerebellum, and the brainstem (Figure 7, Figure 9). CAP V2 brush stimulation induced less activation than CON V2 stimulation in contralateral S1 (hand area) and primary motor cortex (hand area), and may be rating-related artifacts.
Figure 9.

Capsaicin vs. Control contrast for brush stimuli. Transparent yellow areas reflect the hemispheric lateralized activation mask specific for each stimulus. Analysis was restricted to areas outside of these masks. For presentation, statistical images have been spatially smoothed using low pass Gaussian linear filtering with a sigma of 2 mm and an acceptance threshold of 50%. IFG=inferior frontal gyrus, MFG=middle frontal gyrus, SMA=supplementary motor area, MCC=midcingulate cortex, PCC=posterior cingulate cortex.
Discussion
Capsaicin significantly alters responses to perceptually-matched thermal and brush stimuli in the trigeminal nociceptive pathway and in additional brain areas. ROI analysis revealed that BS(c) and Thal showed significantly greater responses with painful thermal stimulation of CAP V2 than perceptually matched stimulation of CON V2. Thermal stimulation of CAP vs. CON V2 also produced significant changes in TG and S1 that varied with perceptual intensity. In addition, brushing CAP V2 produced greater activation in BS(p), ACC, PCC, contralateral amygdala, and cerebellum than CON V2. All stimuli applied to CAP V2 produced significantly increased responses in the contralateral DLPFC (dorsolateral prefrontal cortex; Brodmann Area 9/46), the vicinity of ipsilateral amygdala, and ipsilateral cerebellum relative to stimulation of CON V2. Thermal stimulation of CAP V2 decreased responses relative to CON V2 in ipsilateral DLPFC, bilateral mid-insula, contralateral cerebellum, and areas adjacent to contralateral amygdala. This suggests that capsaicin application caused widespread changes in processing of sensory, affective, evaluative, and emotional dimensions of subsequent stimuli.
Trigeminal Nociceptive Pathway
While some types of primary afferents can be sensitized by capsaicin (Ren et al., 2005; Schmelz et al., 2000; Serra et al., 2004), only Thermal-2 evoked increased responses in TG with stimulation of CAP V2 relative to CON V2, while Thermal-1 evoked a decreased response relative to control. The differential responses could be explained as a combination of peripheral sensitization and intensity coding. Since the capsaicin side produced less peripheral activation than control with Thermal-1, central sensitization could account for the similarity in perceived intensity. However, because lower temperatures were used for the capsaicin side relative to the control, a weaker response with capsaicin in the ganglia would not preclude the presence of peripheral sensitization.
Thermal and Brush stimulation of CAP V2 induced greater activity in BS(c). This area includes spV, which contains second-order neurons that receive nociceptive input from TG. Intradermal capsaicin sensitizes second-order neurons, increasing neuronal firing rates in response to thermal and mechanical stimuli (Dougherty and Willis, 1992; Simone et al., 1991). In this study, spV received enhanced input from the sensitized TG, and may further amplify these signals through second-order sensitization. Capsaicin-induced descending inhibition could also influence responses in spV (Hu and Sessle, 1979; Sessle et al., 1981), but was apparently insufficient to neutralize the increase.
All stimuli applied to CAP V2 significantly increased activation in thalamus, while Thermal-2 and Brush stimuli increased S1 activation. Previous imaging studies have detected increased stimulus-induced responses in S1 after capsaicin-induced thermal and mechanical allodynia (Lorenz et al., 2002; Maihofner and Handwerker, 2005; Maihofner et al., 2004). Single-unit neural ensemble recordings in rat indicate that capsaicin sensitization produces complex changes in the ventroposterior medial thalamus (VPM) and S1 (Katz et al., 1999). These changes were temporally distinguishable from alterations in spinal and brainstem nuclei, suggesting functional plasticity within VPM and S1. Such reorganization could increase BOLD responses in these areas.
While S1 activation has been suggested to encode pain intensity (Coghill et al., 1999; Moulton et al., 2005), CAP and CON V2 responses were significantly different with Thermal-2. Though Thermal-2 stimuli were matched perceptually, S1 responses were greater with stimulation of sensitized skin. However, Thermal-1 did not differentiate S1 activation with capsaicin and control conditions, and intensity-coding properties were observed with separate contrasts of Thermal-1 vs. Thermal-2 for CAP and CON V2 stimulation (unpublished observations). This suggests a dissociation between pain intensity coding and neural activity during hyperalgesia, when using more intensely painful thermal stimuli. Since the BOLD response represents a survey of overall neural activity within a voxel, including encoding of pain and touch (Davis, 2003), the differences in S1 during thermal hyperalgesia may represent a shift in the circuitry engaged (Katz et al., 1999). The pain intensity coding qualities observed previously are likely retained, but obscured by the recruitment of non-intensity coding neurons unmasked during thermal hyperalgesia. Alternatively, increased activation vs. matched perception could result from increased levels of activity in both excitatory and inhibitory neurons; balanced increases in these populations would result in no perceptual change, but would not necessarily be reflected in BOLD signal level.
An increase relative to control in BS(p) was identified for brushing of CAP V2. This area includes msn, which responds to afferents responsive to non-noxious mechanical stimulation. While msn has a large population of second-order low threshold mechano-sensitive neurons, it does not receive direct projections from small-diameter nociceptive afferents and contains few nociceptive responsive neurons (Kruger et al., 1988; Sugimoto et al., 1997). However, msn could receive modulatory input from spV (Greenwood and Sessle, 1976; Hallas and Jacquin, 1990), perhaps enhancing responses to mechanical stimuli with capsaicin exposure (Kwan et al., 1999). Alternatively, BS(p) contains other regions likely affected by capsaicin, including nucleus tractus solitarius and vagal nuclei.
Beyond the Trigeminal Circuit
Areas of frontal cortex constituting DLPFC showed significantly altered responses to thermal and brush stimulation of CAP V2. DLPFC encodes cognitive control of complex actions (Fuster, 2001; Koechlin et al., 2003; MacDonald et al., 2000), and may affect pain perception through cortico-subcortical and cortico-cortical modulatory mechanisms (Apkarian et al., 2004; Lorenz et al., 2003; Maihofner and Handwerker, 2005; Wager et al., 2004; Zubieta et al., 2005). DLPFC is commonly active in pain imaging studies, and may participate in a proposed pain-induced analgesia circuit (Anderson et al., 2002; Bencherif et al., 2002; Gear et al., 1999; Zubieta et al., 2001). This suggests that DLPFC changes during capsaicin-induced sensitization reflect an increase in its capacity to modulate nociceptive processes.
Capsaicin altered stimulus responses in or near the amygdala, including the uncus and portions of superior temporal gyrus (STG). This area processes the emotional salience of noxious stimuli (Becerra et al., 2001; Bernard et al., 1992), and is involved in pain-induced analgesia (Gear et al., 1999; Manning, 1998; Zubieta et al., 2001). Capsaicin-related changes in this study may indicate an enhancement of emotional salience of stimuli to CAP V2. This salience shift could initiate a tendency to protect an injured body part over an intact counterpart when faced with similar noxious input. Changes in amygdala responsiveness may reflect a change in the threshold for perceiving a stimulus as aversive.
The cerebellum was also more responsive to stimulation of CAP V2. Noxious stimuli may activate this area even in unconscious subjects, indicating an autonomic role (Hofbauer et al., 2004). The cerebellum may encode latent motor responses during pain (Peyron et al., 2000; Saab and Willis, 2003), and perhaps more importantly in the control of error signals (Ekerot et al., 1987). Thus, the differential responses here may relate to its potential role as a comparator for errors in somatosensory processing.
For thermal stimuli, increased DLPFC activation was observed contralateral to stimulation, and decreased activation on the ipsilateral side, and vice versa for the amygdala and cerebellum. Two possible explanations for this observation are: (1) these areas show functional lateralization with respect to stimulus side, which is altered with thermal hyperalgesia, or (2) hemispheric lateralized processes were inappropriately flipped in the contrast analysis. In addition to analysis steps that minimized the possibility of the latter, the contrast results for either side were spatially asymmetric. Also, statistical maps for both CAP and CON V2 stimulation produced bilateral activation in these areas. This suggests that the bilaterally opposite contrast results represent real changes in stimulus-based lateralized activation.
Mechanical allodynia was not detected in this study. This is perhaps explained by the long period of time (>1.5 hours) between the removal of the capsaicin and the brush functional scan. Despite the use of a rekindling stimulus (Petersen and Rowbotham, 1999), mechanical allodynia may have faded to non-painful levels during this time. Though dynamic mechanical allodynia has been reported to last up to 4 hours using a heat/capsacin sensitization model (Dirks et al., 2003; Petersen and Rowbotham, 1999), the capsaicin model used in the current study may not have been sufficient to maintain allodynia over this time.
Despite the lack of psychophysical evidence for mechanical allodynia, brushing capsaicin-treated skin evoked increased activation in the same areas as heat, and also in ACC, which encodes pain intensity and/or unpleasantness (Buchel et al., 2002; Coghill et al., 1999; Derbyshire et al., 1997; Porro et al., 1998; Rainville et al., 1997), and PCC, which activates in chronic pain patients (Derbyshire et al., 2002; Hsieh et al., 1995; Lorenz et al., 1998). Even in the absence of perceptual changes, this data suggests that the brain changes after capsaicin exposure. These physiological changes may reflect a pre-symptomatic phase in the early development of progressive tactile allodynia (Ma and Woolf, 1996). Alternatively, as this study was not controlled for order effects, the activation patterns observed may be affected by this factor. The contralateral-ipsilateral contrast patterns in the brushing scan may thus be a result of the order of stimulus presentation.
Perception Dissociated from Neural Activity
Differences in brain activation were found with perceptually-matched stimuli under conditions of thermal hyperalgesia. Although one study has acknowledged the presence of this dissociation between brain activity and perception with thermal allodynia (Lorenz et al., 2002), its implications have not been discussed. This dissociation can be interpreted several ways. First, the perceptions may not have truly matched (Casey, 1996). Though VAS ratings were matched, there were nonetheless subtle qualitative differences in the perceptual experiences (Figure 5). Qualitative aspects of sensation are differentially coded throughout the brain (Strigo et al., 2003), and have been demonstrated with microstimulation within ventral caudal thalamus (Patel et al., 2006). Slight qualitative differences in sensory experience may be responsible for the differential responses following capsaicin-induced sensitization. Second, variability in subjective pain experiences has been attributed to supraspinally-mediated factors, such as expectation, psychological factors, and experience (Coghill et al., 2003). Perhaps during perceptually-matched stimulation, such cognitive factors occur but without significantly altering sensory processing. Third, evidence suggests that nociceptive inputs entering through separate channels (peptidergic and nonpeptidergic nociceptors) may be differentially affected by capsaicin (Braz et al., 2005). Nonpeptidergic neurons ascend to regions such as the amygdala, and may explain the observed differences. Furthermore, activation in both classes may be additive, accounting for differences in afferent systems at the level of the TG and BS(c).
Conclusions
This study demonstrates that capsaicin alters nociceptive processing at multiple levels along the trigeminothalamocortical nociceptive pathway, from ganglia to cortex. Such changes may reflect a recalibration of descending inhibition and ascending nociceptive processes, in addition to plasticity in emotional processing. With Thermal-1 in particular, matched pain levels coupled with decreased ganglia activation with capsaicin relative to control indicate the presence of central sensitization. Further investigation of these kinds of changes should contribute to our understanding of clinical pain conditions with thermal hyperalgesia, such as migraine or neuropathic pain.
Supplementary Material
Single Subject ROIs. Example of a set of single subject ROIs on high-resolution images, and as transformed onto functional time series images.
Supplemental Text 1
To illustrate the difference between pain intensity and unpleasantness, the subjects were told:
“Pain intensity is how strong the sensation feels, while unpleasantness is how much the sensation bothers you. Though they are closely related, they can be distinguished. For example, if an edge of a knife were gently resting on your neck, your pain intensity would be minimal, but unpleasantness would be high.”
Supplemental Text 2
GMM is a standard technique generally used for unsupervised classification of data into multiple categories, and is a multiple comparisons–based analysis. Since any distribution can be represented by using a mixture of a sufficient number of Gaussians, separate Gaussian distributions for activation and deactivation could be identified from each whole-brain statistical map. An automatic model selection approach using Bayes Information Criterion was used to estimate the number of classes in the statistical distribution. For each statistical map, the threshold value was set to the z-statistic value that corresponded to the mode of the activation/deactivation distribution. We used GMM to capture the null distribution with various shifts and scales, to account for unmodeled signal due to physiological noise that can shift and scale the null distribution. In doing so, we also captured the activation and deactivation distributions.
Supplemental Text 3
Creation of hemispheric-lateralized activation masks. First-level statistics were generated for each subject with FILM using a single EV to reflect the time course of stimulation for both CAP and CON V2. Group statistical maps were separately generated for the Thermal-1, Thermal-2, and Brush scans using FLAME on all the subjects, and thresholded using the GMM and the cluster criterion approaches as described above. These maps were turned into binary masks, which included both activation and deactivation. The masks were then spatially eroded, then dilated twice, using FSL. These masks were combined with their flipped counterparts to create symmetric masks. The resulting masks represented hemispheric lateralized activation areas, with a separate mask for each stimulus type. The areas contained within the mask were excluded from the contrast analysis to prevent flip artifacts due to hemispheric lateralized activity.
Acknowledgements
The authors would like to thank Sadie Cole for her assistance with data entry. This work was supported by a grant from NINDS (NS042721) to DB.
Footnotes
Publisher's Disclaimer: This is a PDF file of an unedited manuscript that has been accepted for publication. As a service to our customers we are providing this early version of the manuscript. The manuscript will undergo copyediting, typesetting, and review of the resulting proof before it is published in its final citable form. Please note that during the production process errors may be discovered which could affect the content, and all legal disclaimers that apply to the journal pertain.
References
- Anderson WS, Sheth RN, Bencherif B, Frost JJ, Campbell JN. Naloxone increases pain induced by topical capsaicin in healthy human volunteers. Pain. 2002;99:207–216. doi: 10.1016/s0304-3959(02)00103-3. [DOI] [PubMed] [Google Scholar]
- Apkarian AV, Sosa Y, Sonty S, Levy RM, Harden RN, Parrish TB, Gitelman DR. Chronic back pain is associated with decreased prefrontal and thalamic gray matter density. Journal of Neuroscience. 2004;24:104–105. doi: 10.1523/JNEUROSCI.2541-04.2004. [DOI] [PMC free article] [PubMed] [Google Scholar]
- Baron R. Capsaicin and nociception: from basic mechanisms to novel drugs. Lancet. 2000;356:785–787. doi: 10.1016/S0140-6736(00)02649-0. [DOI] [PubMed] [Google Scholar]
- Baron R, Baron Y, Disbrow E, Roberts TP. Activation of the somatosensory cortex during Abeta-fiber mediated hyperalgesia. A MSI study. Brain Res. 2000;871:75–82. doi: 10.1016/s0006-8993(00)02444-6. [DOI] [PubMed] [Google Scholar]
- Becerra L, Breiter HC, Wise R, Gonzalez RG, Borsook D. Reward circuitry activation by noxious thermal stimuli. Neuron. 2001;32:927–946. doi: 10.1016/s0896-6273(01)00533-5. [DOI] [PubMed] [Google Scholar]
- Bencherif B, Fuchs PN, Sheth R, Dannals RF, Campbell JN, Frost JJ. Pain activation of human supraspinal opioid pathways as demonstrated by [11C]-carfentanil and positron emission tomography (PET) Pain. 2002;99:589–598. doi: 10.1016/S0304-3959(02)00266-X. [DOI] [PubMed] [Google Scholar]
- Bernard JF, Huang GF, Besson JM. Nucleus centralis of the amygdala and the globus pallidus ventralis: electrophysiological evidence for an involvement in pain processes. Journal of Neurophysiology. 1992;68:551–569. doi: 10.1152/jn.1992.68.2.551. [DOI] [PubMed] [Google Scholar]
- Bingel U, Quante M, Knab R, Bromm B, Weiller C, Buchel C. Subcortical structures involved in pain processing: evidence from single-trial fMRI. Pain. 2002;99:313–321. doi: 10.1016/s0304-3959(02)00157-4. [DOI] [PubMed] [Google Scholar]
- Bingel U, Quante M, Knab R, Bromm B, Weiller C, Buchel C. Single trial fMRI reveals significant contralateral bias in responses to laser pain within thalamus and somatosensory cortices. Neuroimage. 2003;18:740–748. doi: 10.1016/s1053-8119(02)00033-2. [DOI] [PubMed] [Google Scholar]
- Borsook D, DaSilva AF, Ploghaus A, Becerra L. Specific and somatotopic functional magnetic resonance imaging activation in the trigeminal ganglion by brush and noxious heat. Journal of Neuroscience. 2003;23:7897–7903. doi: 10.1523/JNEUROSCI.23-21-07897.2003. [DOI] [PMC free article] [PubMed] [Google Scholar]
- Braz JM, Nassar MA, Wood JN, Basbaum AI. Parallel “pain” pathways arise from subpopulations of primary afferent nociceptor. Neuron. 2005;47:787–793. doi: 10.1016/j.neuron.2005.08.015. [DOI] [PubMed] [Google Scholar]
- Brooks JC, Nurmikko TJ, Bimson WE, Singh KD, Roberts N. fMRI of thermal pain: effects of stimulus laterality and attention. Neuroimage. 2002;15:293–301. doi: 10.1006/nimg.2001.0974. [DOI] [PubMed] [Google Scholar]
- Buchel C, Bornhovd K, Quante M, Glauche V, Bromm B, Weiller C. Dissociable neural responses related to pain intensity, stimulus intensity, and stimulus awareness within the anterior cingulate cortex: a parametric single-trial laser functional magnetic resonance imaging study. J Neurosci. 2002;22:970–976. doi: 10.1523/JNEUROSCI.22-03-00970.2002. [DOI] [PMC free article] [PubMed] [Google Scholar]
- Casey KL. Match and mismatch: identifying the neuronal determinants of pain. Ann Intern Med. 1996;124:995–998. doi: 10.7326/0003-4819-124-11-199606010-00007. [DOI] [PubMed] [Google Scholar]
- Coghill RC, Gilron I, Iadarola MJ. Hemispheric lateralization of somatosensory processing. J Neurophysiol. 2001;85:2602–2612. doi: 10.1152/jn.2001.85.6.2602. [DOI] [PubMed] [Google Scholar]
- Coghill RC, McHaffie JG, Yen YF. Neural correlates of interindividual differences in the subjective experience of pain. Proc Natl Acad Sci U S A. 2003;100:8538–8542. doi: 10.1073/pnas.1430684100. [DOI] [PMC free article] [PubMed] [Google Scholar]
- Coghill RC, Sang CN, Maisog JM, Iadarola MJ. Pain intensity processing within the human brain: a bilateral, distributed mechanism. J Neurophysiol. 1999;82:1934–1943. doi: 10.1152/jn.1999.82.4.1934. [DOI] [PubMed] [Google Scholar]
- DaSilva AF, Becerra L, Makris N, Strassman AM, Gonzalez RG, Geatrakis N, Borsook D. Somatotopic activation in the human trigeminal pain pathway. Journal of Neuroscience. 2002;22:8183–8192. doi: 10.1523/JNEUROSCI.22-18-08183.2002. [DOI] [PMC free article] [PubMed] [Google Scholar]
- Davis KD. Neurophysiological and anatomical considerations in functional imaging of pain. Pain. 2003;105:1–3. doi: 10.1016/s0304-3959(03)00174-x. [DOI] [PubMed] [Google Scholar]
- De Luca M, Smith S, De Stefano N, Federico A, Matthews PM. Blood oxygenation level dependent contrast resting state networks are relevant to functional activity in the neocortical sensorimotor system. Experimental brain research. Experimentelle Hirnforschung. 2005;167:587–594. doi: 10.1007/s00221-005-0059-1. [DOI] [PubMed] [Google Scholar]
- Derbyshire SW, Jones AK, Creed F, Starz T, Meltzer CC, Townsend DW, Peterson AM, Firestone L. Cerebral responses to noxious thermal stimulation in chronic low back pain patients and normal controls. Neuroimage. 2002;16:158–168. doi: 10.1006/nimg.2002.1066. [DOI] [PubMed] [Google Scholar]
- Derbyshire SW, Jones AK, Gyulai F, Clark S, Townsend D, Firestone LL. Pain processing during three levels of noxious stimulation produces differential patterns of central activity. Pain. 1997;73:431–445. doi: 10.1016/S0304-3959(97)00138-3. [DOI] [PubMed] [Google Scholar]
- Dirks J, Petersen KL, Dahl JB. The heat/capsaicin sensitization model: a methodologic study. J Pain. 2003;4:122–128. doi: 10.1054/jpai.2003.10. [DOI] [PubMed] [Google Scholar]
- Dougherty PM, Willis WD. Enhanced responses of spinothalamic tract neurons to excitatory amino acids accompany capsaicin-induced sensitization in the monkey. J Neurosci. 1992;12:883–894. doi: 10.1523/JNEUROSCI.12-03-00883.1992. [DOI] [PMC free article] [PubMed] [Google Scholar]
- Ekerot CF, Oscarsson O, Schouenborg J. Stimulation of cat cutaneous nociceptive C fibres causing tonic and synchronous activity in climbing fibres. The Journal of physiology. 1987;386:539–546. doi: 10.1113/jphysiol.1987.sp016550. [DOI] [PMC free article] [PubMed] [Google Scholar]
- Everitt BS, Bullmore ET. Mixture model mapping of the brain activation in functional magnetic resonance images. Human brain mapping. 1999;7:1–14. doi: 10.1002/(SICI)1097-0193(1999)7:1<1::AID-HBM1>3.0.CO;2-H. [DOI] [PMC free article] [PubMed] [Google Scholar]
- Friston K, Holmes AP, Worsley K, Poline JB, Frith C, Frackowiak RSJ. Statistical parametric maps in functional imaging: a general linear approach. Human Brain Mapping. 1995;2:189–210. [Google Scholar]
- Fuster JM. The prefrontal cortex--an update: time is of the essence. Neuron. 2001;30:319–333. doi: 10.1016/s0896-6273(01)00285-9. [DOI] [PubMed] [Google Scholar]
- Gear RW, Aley KO, Levine JD. Pain-induced analgesia mediated by mesolimbic reward circuits. Journal of Neuroscience. 1999;19:7175–7181. doi: 10.1523/JNEUROSCI.19-16-07175.1999. [DOI] [PMC free article] [PubMed] [Google Scholar]
- Gracely RH, McGrath P, Dubner R. Validity and sensitivity of ratio scales of sensory and affective verbal pain descriptors: manipulation of affect by diazepam. Pain. 1978;5:19–29. doi: 10.1016/0304-3959(78)90021-0. [DOI] [PubMed] [Google Scholar]
- Greenwood LF, Sessle BJ. Inputs to trigeminal brain stem neurones from facial, oral, tooth pulp and pharyngolaryngeal tissues: II. Role of trigeminal nucleus caudalis in modulating responses to innocuous and noxious stimuli. Brain Res. 1976;117:227–238. doi: 10.1016/0006-8993(76)90732-0. [DOI] [PubMed] [Google Scholar]
- Hallas BH, Jacquin MF. Structure-function relationships in rat brain stem subnucleus interpolaris. IX. Inputs from subnucleus caudalis. J Neurophysiol. 1990;64:28–45. doi: 10.1152/jn.1990.64.1.28. [DOI] [PubMed] [Google Scholar]
- Hofbauer RK, Fiset P, Plourde G, Backman SB, Bushnell MC. Dose-dependent effects of propofol on the central processing of thermal pain. Anesthesiology. 2004;100:386–394. doi: 10.1097/00000542-200402000-00031. [DOI] [PubMed] [Google Scholar]
- Hsieh JC, Belfrage M, Stone-Elander S, Hansson P, Ingvar M. Central representation of chronic ongoing neuropathic pain studied by positron emission tomography. Pain. 1995;63:225–236. doi: 10.1016/0304-3959(95)00048-W. [DOI] [PubMed] [Google Scholar]
- Hu JW, Sessle BJ. Trigeminal nociceptive and non-nociceptive neurones: brain stem intranuclear projections and modulation by orofacial, periqueductal gray and nucleus raphe magnus stimuli. Brain Res. 1979;170:547–552. doi: 10.1016/0006-8993(79)90973-9. [DOI] [PubMed] [Google Scholar]
- Iadarola MJ, Berman KF, Zeffiro TA, Byas-Smith MG, Gracely RH, Max MB, Bennett GJ. Neural activation during acute capsaicin-evoked pain and allodynia assessed with PET. Brain. 1998;121:931–947. doi: 10.1093/brain/121.5.931. [DOI] [PubMed] [Google Scholar]
- Iannetti GD, Zambreanu L, Wise RG, Buchanan TJ, Huggins JP, Smart TS, Vennart W, Tracey I. Pharmacological modulation of pain-related brain activity during normal and central sensitization states in humans. Proc Natl Acad Sci U S A. 2005;102:18195–18200. doi: 10.1073/pnas.0506624102. [DOI] [PMC free article] [PubMed] [Google Scholar]
- Jenkinson M. Improved unwarping of EPI images using regularised B0 maps. Neuroimage. 2001;13:165. [Google Scholar]
- Katz DB, Simon SA, Moody A, Nicolelis MA. Simultaneous reorganization in thalamocortical ensembles evolves over several hours after perioral capsaicin injections. J Neurophysiol. 1999;82:963–977. doi: 10.1152/jn.1999.82.2.963. [DOI] [PubMed] [Google Scholar]
- Koechlin E, Ody C, Kouneiher F. The architecture of cognitive control in the human prefrontal cortex. Science. 2003;302:1181–1185. doi: 10.1126/science.1088545. [DOI] [PubMed] [Google Scholar]
- Kruger L, Sternini C, Brecha NC, Mantyh PW. Distribution of calcitonin gene-related peptide immunoreactivity in relation to the rat central somatosensory projection. J Comp Neurol. 1988;273:149–162. doi: 10.1002/cne.902730203. [DOI] [PubMed] [Google Scholar]
- Kwan CL, Demaro JA, Hu JW, Jacquin MF, Sessle BJ. C-fiber depletion alters response properties of neurons in trigeminal nucleus principalis. J Neurophysiol. 1999;81:435–446. doi: 10.1152/jn.1999.81.2.435. [DOI] [PubMed] [Google Scholar]
- LaMotte RH, Shain CN, Simone DA, Tsai EF. Neurogenic hyperalgesia: psychophysical studies of underlying mechanisms. Journal of Neurophysiology. 1991;66:190–211. doi: 10.1152/jn.1991.66.1.190. [DOI] [PubMed] [Google Scholar]
- Lancaster JL, Woldorff MG, Parsons LM, Liotti M, Freitas CS, Rainey L, Kochunov PV, Nickerson D, Mikiten SA, Fox PT. Automated Talairach atlas labels for functional brain mapping. Human brain mapping. 2000;10:120–131. doi: 10.1002/1097-0193(200007)10:3<120::AID-HBM30>3.0.CO;2-8. [DOI] [PMC free article] [PubMed] [Google Scholar]
- Logothetis NK, Pauls J, Augath M, Trinath T, Oeltermann A. Neurophysiological investigation of the basis of the fMRI signal. Nature. 2001;412:150–157. doi: 10.1038/35084005. see comment. [DOI] [PubMed] [Google Scholar]
- Lorenz J, Cross D, Minoshima S, Morrow T, Paulson P, Casey K. A unique representation of heat allodynia in the human brain. Neuron. 2002;35:383–393. doi: 10.1016/s0896-6273(02)00767-5. [DOI] [PubMed] [Google Scholar]
- Lorenz J, Kohlhoff H, Hansen HC, Kunze K, Bromm B. Abeta-fiber mediated activation of cingulate cortex as correlate of central post-stroke pain. Neuroreport. 1998;9:659–663. doi: 10.1097/00001756-199803090-00018. [DOI] [PubMed] [Google Scholar]
- Lorenz J, Minoshima S, Casey KL. Keeping pain out of mind: the role of the dorsolateral prefrontal cortex in pain modulation. Brain. 2003;126:1079–1091. doi: 10.1093/brain/awg102. [DOI] [PubMed] [Google Scholar]
- Ma QP, Woolf CJ. Progressive tactile hypersensitivity: an inflammation-induced incremental increase in the excitability of the spinal cord. Pain. 1996;67:97–106. doi: 10.1016/0304-3959(96)03105-3. [DOI] [PubMed] [Google Scholar]
- MacDonald AW, 3rd, Cohen JD, Stenger VA, Carter CS. Dissociating the role of the dorsolateral prefrontal and anterior cingulate cortex in cognitive control. Science. 2000;288:1835–1838. doi: 10.1126/science.288.5472.1835. [DOI] [PubMed] [Google Scholar]
- Maihofner C, Handwerker HO. Differential coding of hyperalgesia in the human brain: A functional MRI study. Neuroimage. 2005 doi: 10.1016/j.neuroimage.2005.06.049. [DOI] [PubMed] [Google Scholar]
- Maihofner C, Handwerker HO, Birklein F. Functional imaging of allodynia in complex regional pain syndrome. Neurology. 2006;66:711–717. doi: 10.1212/01.wnl.0000200961.49114.39. [DOI] [PubMed] [Google Scholar]
- Maihofner C, Schmelz M, Forster C, Neundorfer B, Handwerker HO. Neural activation during experimental allodynia: a functional magnetic resonance imaging study. Eur J Neurosci. 2004;19:3211–3218. doi: 10.1111/j.1460-9568.2004.03437.x. [DOI] [PubMed] [Google Scholar]
- Maldjian JA, Laurienti PJ, Kraft RA, Burdette JH. An automated method for neuroanatomic and cytoarchitectonic atlas-based interrogation of fMRI data sets. Neuroimage. 2003;19:1233–1239. doi: 10.1016/s1053-8119(03)00169-1. [DOI] [PubMed] [Google Scholar]
- Malisza KL, Docherty JC. Capsaicin as a source for painful stimulation in functional MRI. J Magn Reson Imaging. 2001;14:341–347. doi: 10.1002/jmri.1192. [DOI] [PubMed] [Google Scholar]
- Manning BH. A lateralized deficit in morphine antinociception after unilateral inactivation of the central amygdala. J Neurosci. 1998;18:9453–9470. doi: 10.1523/JNEUROSCI.18-22-09453.1998. [DOI] [PMC free article] [PubMed] [Google Scholar]
- Moulton EA, Keaser ML, Gullapalli RP, Greenspan JD. Regional intensive and temporal patterns of functional MRI activation distinguishing noxious and innocuous contact heat. J Neurophysiol. 2005;93:2183–2193. doi: 10.1152/jn.01025.2004. [DOI] [PubMed] [Google Scholar]
- Patel S, Ohara S, Dougherty PM, Gracely RH, Lenz FA. Psychophysical elements of place and modality specificity in the thalamic somatic sensory nucleus (ventral caudal, vc) of awake humans. J Neurophysiol. 2006;95:646–659. doi: 10.1152/jn.00756.2005. [DOI] [PubMed] [Google Scholar]
- Pendse G, Borsook D, Aiello-Lammens M, Moulton EA, Becerra L. Analyzing Response Characteristics in fMRI using Logistic Regression. Society for Neuroscience. 2006;36 [Google Scholar]
- Petersen KL, Rowbotham MC. A new human experimental pain model: the heat/capsaicin sensitization model. Neuroreport. 1999;10:1511–1516. doi: 10.1097/00001756-199905140-00022. erratum appears in Neuroreport 2002 Jan 21;13(1):inside back cover. [DOI] [PubMed] [Google Scholar]
- Peyron R, Laurent B, Garcia-Larrea L. Functional imaging of brain responses to pain. A review and meta-analysis (2000) Neurophysiologie Clinique. 2000;30:263–288. doi: 10.1016/s0987-7053(00)00227-6. [DOI] [PubMed] [Google Scholar]
- Pleger B, Ragert P, Schwenkreis P, Forster AF, Wilimzig C, Dinse H, Nicolas V, Maier C, Tegenthoff M. Patterns of cortical reorganization parallel impaired tactile discrimination and pain intensity in complex regional pain syndrome. Neuroimage. 2006 doi: 10.1016/j.neuroimage.2006.03.045. [DOI] [PubMed] [Google Scholar]
- Porro CA, Cettolo V, Francescato MP, Baraldi P. Temporal and intensity coding of pain in human cortex. J Neurophysiol. 1998;80:3312–3320. doi: 10.1152/jn.1998.80.6.3312. [DOI] [PubMed] [Google Scholar]
- Rainville P, Duncan GH, Price DD, Carrier B, Bushnell MC. Pain affect encoded in human anterior cingulate but not somatosensory cortex. Science. 1997;277:968–971. doi: 10.1126/science.277.5328.968. [DOI] [PubMed] [Google Scholar]
- Ren Y, Zou X, Fang L, Lin Q. Sympathetic modulation of activity in Adelta- and C-primary nociceptive afferents after intradermal injection of capsaicin in rats. Journal of neurophysiology. 2005;93:365–377. doi: 10.1152/jn.00804.2004. [DOI] [PubMed] [Google Scholar]
- Saab CY, Willis WD. The cerebellum: organization, functions and its role in nociception. Brain Res Brain Res Rev. 2003;42:85–95. doi: 10.1016/s0165-0173(03)00151-6. [DOI] [PubMed] [Google Scholar]
- Schmelz M, Schmid R, Handwerker HO, Torebjork HE. Encoding of burning pain from capsaicin-treated human skin in two categories of unmyelinated nerve fibres. Brain. 2000;123(Pt 3):560–571. doi: 10.1093/brain/123.3.560. [DOI] [PubMed] [Google Scholar]
- Schweinhardt P, Glynn C, Brooks J, McQuay H, Jack T, Chessell I, Bountra C, Tracey I. An fMRI study of cerebral processing of brush-evoked allodynia in neuropathic pain patients. Neuroimage. 2006 doi: 10.1016/j.neuroimage.2006.03.024. [DOI] [PubMed] [Google Scholar]
- Serra J, Campero M, Bostock H, Ochoa J. Two types of C nociceptors in human skin and their behavior in areas of capsaicin-induced secondary hyperalgesia. Journal of neurophysiology. 2004;91:2770–2781. doi: 10.1152/jn.00565.2003. [DOI] [PubMed] [Google Scholar]
- Sessle BJ, Hu JW, Dubner R, Lucier GE. Functional properties of neurons in cat trigeminal subnucleus caudalis (medullary dorsal horn). II. Modulation of responses to noxious and nonnoxious stimuli by periaqueductal gray, nucleus raphe magnus, cerebral cortex, and afferent influences, and effect of naloxone. J Neurophysiol. 1981;45:193–207. doi: 10.1152/jn.1981.45.2.193. [DOI] [PubMed] [Google Scholar]
- Simone DA, Ngeow JY, Putterman GJ, LaMotte RH. Hyperalgesia to heat after intradermal injection of capsaicin. Brain research. 1987;418:201–203. doi: 10.1016/0006-8993(87)90982-6. [DOI] [PubMed] [Google Scholar]
- Simone DA, Sorkin LS, Oh U, Chung JM, Owens C, LaMotte RH, Willis WD. Neurogenic hyperalgesia: central neural correlates in responses of spinothalamic tract neurons. J Neurophysiol. 1991;66:228–246. doi: 10.1152/jn.1991.66.1.228. [DOI] [PubMed] [Google Scholar]
- Smith SM, Jenkinson M, Woolrich MW, Beckmann CF, Behrens TE, Johansen-Berg H, Bannister PR, De Luca M, Drobnjak I, Flitney DE, Niazy RK, Saunders J, Vickers J, Zhang Y, De Stefano N, Brady JM, Matthews PM. Advances in functional and structural MR image analysis and implementation as FSL. Neuroimage. 2004;23(Suppl 1):S208–219. doi: 10.1016/j.neuroimage.2004.07.051. [DOI] [PubMed] [Google Scholar]
- Strigo IA, Duncan GH, Boivin M, Bushnell MC. Differentiation of visceral and cutaneous pain in the human brain. J Neurophysiol. 2003;89:3294–3303. doi: 10.1152/jn.01048.2002. [DOI] [PubMed] [Google Scholar]
- Sugimoto T, Fujiyoshi Y, He YF, Xiao C, Ichikawa H. Trigeminal primary projection to the rat brain stem sensory trigeminal nuclear complex and surrounding structures revealed by anterograde transport of cholera toxin B subunit-conjugated and Bandeiraea simplicifolia isolectin B4-conjugated horseradish peroxidase. Neurosci Res. 1997;28:361–371. doi: 10.1016/s0168-0102(97)00064-3. [DOI] [PubMed] [Google Scholar]
- Thompson JK, Peterson MR, Freeman RD. Single-neuron activity and tissue oxygenation in the cerebral cortex. Science. 2003;299:1070–1072. doi: 10.1126/science.1079220. [DOI] [PubMed] [Google Scholar]
- Treede RD, Meyer RA, Raja SN, Campbell JN. Peripheral and central mechanisms of cutaneous hyperalgesia. Prog Neurobiol. 1992;38:397–421. doi: 10.1016/0301-0082(92)90027-c. [DOI] [PubMed] [Google Scholar]
- Wager TD, Rilling JK, Smith EE, Sokolik A, Casey KL, Davidson RJ, Kosslyn SM, Rose RM, Cohen JD. Placebo-induced changes in FMRI in the anticipation and experience of pain. Science. 2004;303:1162–1167. doi: 10.1126/science.1093065. see comment. [DOI] [PubMed] [Google Scholar]
- Witting N, Kupers RC, Svensson P, Arendt-Nielsen L, Gjedde A, Jensen TS. Experimental brush-evoked allodynia activates posterior parietal cortex. Neurology. 2001;57:1817–1824. doi: 10.1212/wnl.57.10.1817. [DOI] [PubMed] [Google Scholar]
- Woolrich MW, Behrens TE, Beckmann CF, Smith SM. Mixture models with adaptive spatial regularization for segmentation with an application to FMRI data. IEEE Trans Med Imaging. 2005;24:1–11. doi: 10.1109/tmi.2004.836545. [DOI] [PubMed] [Google Scholar]
- Woolrich MW, Ripley BD, Brady M, Smith SM. Temporal autocorrelation in univariate linear modeling of FMRI data. Neuroimage. 2001;14:1370–1386. doi: 10.1006/nimg.2001.0931. [DOI] [PubMed] [Google Scholar]
- Zambreanu L, Wise RG, Brooks JC, Iannetti GD, Tracey I. A role for the brainstem in central sensitisation in humans. Evidence from functional magnetic resonance imaging. Pain. 2005;114:397–407. doi: 10.1016/j.pain.2005.01.005. [DOI] [PubMed] [Google Scholar]
- Zubieta JK, Bueller JA, Jackson LR, Scott DJ, Xu Y, Koeppe RA, Nichols TE, Stohler CS. Placebo effects mediated by endogenous opioid activity on mu-opioid receptors. J Neurosci. 2005;25:7754–7762. doi: 10.1523/JNEUROSCI.0439-05.2005. [DOI] [PMC free article] [PubMed] [Google Scholar]
- Zubieta JK, Smith YR, Bueller JA, Xu Y, Kilbourn MR, Jewett DM, Meyer CR, Koeppe RA, Stohler CS. Regional mu opioid receptor regulation of sensory and affective dimensions of pain. Science. 2001;293:311–315. doi: 10.1126/science.1060952. [DOI] [PubMed] [Google Scholar]
Associated Data
This section collects any data citations, data availability statements, or supplementary materials included in this article.
Supplementary Materials
Single Subject ROIs. Example of a set of single subject ROIs on high-resolution images, and as transformed onto functional time series images.
Supplemental Text 1
To illustrate the difference between pain intensity and unpleasantness, the subjects were told:
“Pain intensity is how strong the sensation feels, while unpleasantness is how much the sensation bothers you. Though they are closely related, they can be distinguished. For example, if an edge of a knife were gently resting on your neck, your pain intensity would be minimal, but unpleasantness would be high.”
Supplemental Text 2
GMM is a standard technique generally used for unsupervised classification of data into multiple categories, and is a multiple comparisons–based analysis. Since any distribution can be represented by using a mixture of a sufficient number of Gaussians, separate Gaussian distributions for activation and deactivation could be identified from each whole-brain statistical map. An automatic model selection approach using Bayes Information Criterion was used to estimate the number of classes in the statistical distribution. For each statistical map, the threshold value was set to the z-statistic value that corresponded to the mode of the activation/deactivation distribution. We used GMM to capture the null distribution with various shifts and scales, to account for unmodeled signal due to physiological noise that can shift and scale the null distribution. In doing so, we also captured the activation and deactivation distributions.
Supplemental Text 3
Creation of hemispheric-lateralized activation masks. First-level statistics were generated for each subject with FILM using a single EV to reflect the time course of stimulation for both CAP and CON V2. Group statistical maps were separately generated for the Thermal-1, Thermal-2, and Brush scans using FLAME on all the subjects, and thresholded using the GMM and the cluster criterion approaches as described above. These maps were turned into binary masks, which included both activation and deactivation. The masks were then spatially eroded, then dilated twice, using FSL. These masks were combined with their flipped counterparts to create symmetric masks. The resulting masks represented hemispheric lateralized activation areas, with a separate mask for each stimulus type. The areas contained within the mask were excluded from the contrast analysis to prevent flip artifacts due to hemispheric lateralized activity.