

Summary
A MM-GBSA computational protocol was used successfully to account for wild type U1A-RNA and F56 U1A mutant experimental binding free energies. The trend in mutant binding free energies compared to wild type is well-reproduced. Following application of a linear-response-like equation to scale the various energy components, the binding free energies agree quantitatively with observed experimental values. Conformational adaptation contributes to the binding free energy for both the protein and the RNA in these systems. Small differences in ΔGs are the result of different and sometimes quite large relative contributions from various energetic components. Residual free energy decomposition indicates differences not only at the site of mutation, but throughout the entire protein. MM-GBSA and ab initio calculations performed on model systems suggest that stacking interactions may nearly, but not completely, account for observed differences in mutant binding affinities. This study indicates that there may be different underlying causes of ostensibly similar experimentally observed binding affinities of different mutants, and thus recommends caution in the interpretation of binding affinities and specificities purely by inspection.
Keywords: MM-PB(GB)SA, U1A, protein-RNA recognition, molecular dynamics, binding free energy
Introduction
The protein U1A is a component of the spliceosome which excises introns from pre-mRNA prior to gene expression in eukaryotes.1 Fine control of complex formation between U1A and stem loop 2 (SL2) of U1 snRNA (U1A-RNA) has been studied via experiments involving U1A mutants and SL2 base replacements, and observed affinities (ΔG) and specificities (ΔΔG) have been reported for the wild type system and a number of modified forms.2-24 The results of these experiments have raised interesting and important questions about the nature of U1A-RNA complex formation at the molecular level and the relative contributions of various chemical forces to binding.
U1A binds single-stranded RNA through one of the most common eukaryotic binding domains, the RNA recognition motif (RRM), also known as the RNA binding domain (RBD) or the ribonucleoprotein (RNP) domain.2 The general RRM structure is comprised of a βαββαβ sandwich fold that forms a four-stranded antiparallel β-sheet supported by two α-helices.3 The N-terminal RRM of U1A binds SL2 of U1 snRNA and two adjacent internal loops in the 3'-untranslated region of its own pre-mRNA with high affinity and specificity.4-6 All three target sites contain nearly identical sequences in the loop, AUUGCAC closed by a CG base pair.
The structure of the N-terminal RRM of U1A (residues 2−117) has been solved by NMR spectroscopy7 and X-ray crystallography (residues 3−92),8 and the complex of the N-terminal RRM of U1A (residues 2−97) with SL2 RNA (21 bases) has been solved by X-ray crystallography,9 albeit with two surface mutations. The tertiary structure of the U1A-SL2 RNA complex9 and the secondary structure of SL2 RNA are shown in Figure 1. The C-terminal α-helix (αC or helix C) of U1A assumes a significantly different orientation free in solution than that in the crystal structure of the complex. αC is oriented adjacent to the β sheet in the bound form, but lies across the β sheet in the free form, (Figure 2) obstructing the approach of the RNA. We refer to the NMR (free) and X-ray (bound) structures of U1A as the “closed” and “open” forms of αC, respectively. A recent crystal structure of free U1A (residues 6−98) exhibits αC in the open orientation which may have been due to the solution conditions10 or to the shorter construct used in the study compared to the NMR structure.11 An experimental structure of the free form of SL2 RNA is not available.
Figure 1.
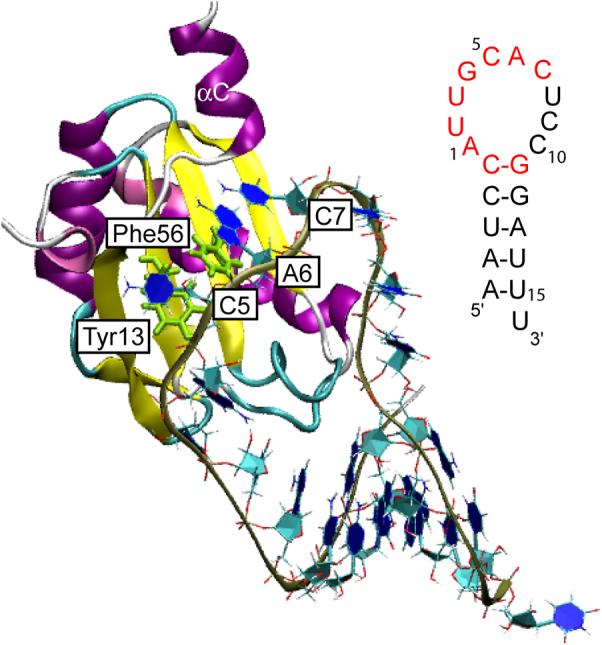
Structure of the N-terminal RRM of U1A bound to SL2 RNA.9 Inset: Nucleic acid sequence of SL2 RNA with nucleotides recognized by U1A for binding highlighted in red.
Figure 2.
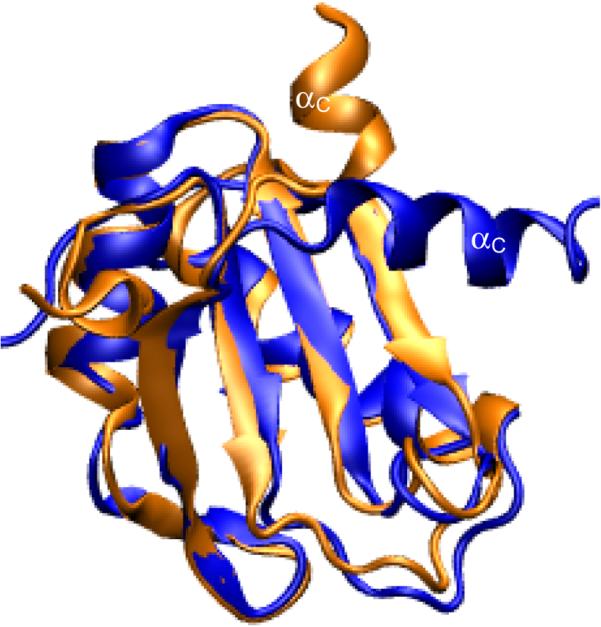
Overlay of the U1A protein in free7 (blue) and bound9 (orange, RNA omitted for clarity) forms illustrating the closed and open orientations of αC, respectively.
Baranger and coworkers investigated the contribution of conserved aromatic amino acids that participate in stacking interactions to the affinity and specificity of the N-terminal RRM of U1A. Based on mutant studies, they found that the highly conserved F56 contributed significantly to binding and that the F56A mutant altered the affinity by more than would be anticipated from a loss in stacking interactions.12,13 Energetic coupling was found between F56 and A6 of SL2 RNA based on simultaneous modification.13 Non-polar base isosteres could be substituted for A6 with little loss of binding affinity, evidence that increased hydrophobicity can compensate for the loss of hydrogen-bonding interactions.14 Taken together, this data indicates an important role for the conserved F56 residue in U1A-RNA binding.
Detailed information about chemical forces is not readily obtained from experiment; as such, the interpretation and understanding of observed binding constants involves reference to a theoretical and, in the case of systems of this complexity, a computational model. One such model involves post-processing molecular dynamics (MD) trajectories for a biomolecular complex and its corresponding unbound forms to obtain free energies based on a linearly additive model of terms representing the various chemical forces. The methodology for this goes by several names, including the master equation method,15 end point calculations,16 free energy component analysis17 and the MM-PBSA method,18 which refers to calculations based on a Molecular Mechanics (MM) configurational energy function combined with Poisson Boltzmann (PB) continuum treatment of solvation with non-polar contributions estimated from Solvent Accessibility (SA) calculations. A widely used semi-empirical variant of this method utilizes MD trajectories and a Generalized Born (GB) approximation to PB solvation17,19-21 (MM-GBSA).
The results of MM-PBSA-type and related calculations can provide useful estimates of the contribution of various terms to a binding free energy, but are limited in absolute accuracy due to the propagation of uncertainties in the values of individual contributions. Viable approaches to additive free energy calculations of binding and specificity are due to the labs of Honig,22 Gilson,23 Sharp,24 and McCammon,16 and specific applications to ligand binding have been surveyed by Simonsen et al.25 We have recently reported several studies using component analysis on protein-DNA complexes.17,19,26 In many cases, trends in binding free energies are well represented and a subsequent step of linear regression to rescale the MM-PBSA-type calculated values has proved highly successful.27,28 A theoretical justification of this has been provided based on linear response (LR) theory and extended linear response methods.29-31
A number of theoretical and computational studies on the U1A-RNA system have been reported previously.32-45 Reyes and Kollman described MD on U1A binding to both SL2 RNA and internal loop RNA32 and estimated the unbound forms of both U1A and SL2 RNA to be ∼10 kcal/mol lower in energy than the corresponding bound forms, indicating the critical role that adaptation plays on complex formation.36 The influence of some mutations that both reduce and increase affinity was verified.35 Olson37 subsequently reported an MM - nonlinear PBSA study on U1A-RNA and provided a semi-quantitative account of specificities for mutants at several different positions. Blakaj et al.38 carried out an early component analysis estimate of ΔΔG for the F56A mutant of U1A-RNA and found that the origin of the large reduction in affinity upon mutation was due to the free energy of the unbound form of U1A.
We describe herein an application of the MM-GBSA-LR computational protocol to wild type U1A-RNA and the F56A, F56L and F56W mutants of the protein. The corresponding experimental measurements were obtained locally and described in a series of recent articles by Baranger and coworkers.12,13,46 A quite successful account of the experimental data was obtained after LR rescaling of the MM-GBSA energies. Our results indicate that the small differences in ΔGs for this series are not a consequence of small progressive changes but due to different relative contributions from various forces. Changes in stacking forces are clearly involved in the relative binding free energies; however the observed values may or may not be fully accounted for on this basis. MM-GBSA analysis and quantum mechanical calculations provide insight into this issue.
Results
MD simulations of U1A-RNA systems
The MD trajectories computed for this study are summarized in Table 1. They include wild type U1A-RNA complex, free wild type U1A in closed and open conformations, and free SL2 RNA, as well as those of three U1A mutants, F56A, F56L and F56W. MD simulations were performed with explicit water and counterions. The root-mean-square deviations (RMSD) of the protein backbone residues Phe8 – Lys98 and RNA backbone atoms from the equilibrated structures were calculated over the course of the trajectories and are plotted in Figure 3. The N- and C-terminal protein residues were omitted from the RMSD analysis because they are very flexible throughout the MD simulations, causing high RMSD values that are not indicative of any significant structural changes of interest in the proteins or protein-RNA complexes.
Table 1.
MD simulations performed
| Free Protein | Simulation Length | Portion of Simulation Selected for Analysis | # Snapshots for MM-PB(GB)SA/NMode Analysis |
|---|---|---|---|
| Wild type U1A (closed) | 5 ns | 2 − 5 ns | 150/150 |
| F56A U1A (closed) | 5 ns | 3 − 5 ns | 100/100 |
| F56L U1A (closed) | 5 ns | 2 − 5 ns | 150/150 |
| F56W U1A (closed) | 5 ns | 2 − 5 ns | 150/150 |
| Wild type U1A (open) | 5 ns | 3 − 5 ns | 100/100 |
| F56A U1A (open) | 3 ns | 0.5 − 3 ns | 125/125 |
| F56L U1A (open) | 3 ns | 0.5 − 3 ns | 125/125 |
| F56W U1A (open) | 3 ns | 0.5 − 3 ns | 125/125 |
|
Free RNA |
|||
| Stem loop 2 RNA | 32 ns | 8 − 32 ns | 1200/120 |
|
Protein-RNA Complex |
|||
| Wild type U1A-RNA | 3 ns | 0.5 − 3 ns | 125/125 |
| F56A U1A-RNA | 3 ns | 0.5 − 3 ns | 125/125 |
| F56L U1A-RNA | 3 ns | 0.5 − 3 ns | 125/125 |
| F56W U1A-RNA | 3 ns | 0.5 − 3 ns | 125/125 |
Figure 3.

Plots of the RMSD of protein backbone residues Phe8 – Lys98 and RNA backbone atoms from the equilibrated structures calculated over the course of the MD trajectories. (a) U1A-RNA complex. (b) Free U1A protein with helix C in the closed orientation. (c) Free U1A protein with helix C in the open orientation. (d) Free SL2 RNA.
The RMSD plots of the wild type U1A-RNA complex and mutant complexes (Figure 3a) are all quite stable over the 0.5 – 3 ns portion of the trajectories for which each was sampled for the MM-PB(GB)SA calculations. Verification of the wild type U1A-RNA complex trajectory is provided by comparison to previous MD studies on this system.32-34,38,42 The average RMSD of 1.1 Å is consistent with these prior studies. Subsequent to this study, the U1A-RNA wild type complex trajectory was extended to 10 ns and remains stable throughout the course of the trajectory. Thus, results based on the 3 ns trajectory are expected to be very similar to those that would be obtained from a longer simulation. The average RMSD of the F56A mutant complex from the initial structure is 1.4 Å, larger than wild type and the other mutants (F56L = 1.1 Å, F56W = 1.2 Å). This may indicate loss of stability of the F56A complex, which has been shown experimentally.47,48
The free U1A simulations in closed form were run for 5 ns. The RMSD plots of the free wild type, F56L and F56W U1A proteins in the closed conformation stabilize after 2 ns, while the F56A mutant takes 3 ns to stabilize (Figure 3b). Comparison to a previous MD study on this system indicates good agreement40 with an average RMSD value of 2.1 Å. Comparing the average distance between the center of mass of helix C and the center of mass of the β-sheet, wild type and F56W U1A have similar distances (17.1 Å and 16.5 Å, respectively), while the F56A and F56L are shorter (15.1 Å and 15.7 Å, respectively). This indicates that helix C moves to a new space during the MD simulations in the F56A and F56L mutants, which may affect binding.
The free U1A simulations in open form were more stable than those in the closed form, so were run for 3 ns. The simulation of free wild type U1A in the open form was run for 5 ns to confirm the stability of the open form. The RMSD plots of the free wild type and F56 mutant U1A proteins in the open conformation stabilize between 0.5−1 ns (Figure 3c). Comparison to a previous MD study on this system indicates good agreement40 with an average RMSD value of 1.1 Å.
The 32 ns simulation of SL2 RNA appears to be the longest MD trajectory performed to date on this system. The all-atom RMSD plot of the free SL2 RNA stabilizes at 8 ns (Figure 3d). It can be seen from the plot that the stem residues are quite stable throughout the duration of the simulation and that the flexible loop residues appear to evolve through two substates with average RMSDs of 3.5 Å and 5 Å before reaching a more stable conformation with an average RMSD of 7.5 Å. Previous MD simulations on SL2 RNA 40,32,36,33 have been run between 0.6−5 ns, thus would not have observed these substates. However, an average RMSD of 3.5 Å for the first substate agrees quite well with the results from these previous studies. Additional analysis of this simulation including a complete analysis of the ion and hydration atmospheres will be reported elsewhere.
Analysis of wild type and F56 mutant U1A binding free energies for SL2 RNA using MM-PB(GB)SA methods
MM-PB(GB)SA component analysis was performed on snapshots extracted from the MD simulations stripped of water and ions, then averaged over the snapshots to obtain free energies of binding as described in the Methods section. The “separate trajectory” method involves analysis of three different trajectories to obtain the overall free energy of binding: the U1A-RNA complex, the free U1A protein (in either closed or open form) and the free SL2 RNA. The “single trajectory” method obtains all snapshots from the MD simulation of the complex, and obtains the free protein and RNA contributions by separating the complex into its constituent parts. This method is less computationally intensive than the separate trajectory method, but neglects effects from structural adaptation. Solute free energy contributions include the MM energy computed by AMBER and entropy contributions computed using normal mode analysis. Solvent free energy contributions include the electrostatic component computed using PB or GB implicit solvent methods and the nonpolar component based on the molecular solvent-accessible surface area (SASA).
MM-GBSA analysis by end points quantitatively agrees with observed U1A-RNA binding free energies after application of a linear-response-type analysis
The snapshots from the MD trajectories selected for MM-PB(GB)SA analysis were determined based on stabilization of the RMSD plots (Figure 3) and are reported in Table 1. MM-PB(GB)SA binding free energies were calculated as described in the Materials and Methods section. The electrostatic contribution to the solvation free energy (Ges in Equation 8) was calculated using PB as implemented in the pbsa program in AMBER 8 as well as a number of GB methods (see Materials and Methods). Upon comparison of the computed binding free energies to the experimental values, the GBOBC (I) method49,50 provided the most reasonable overall binding free energies in conjunction with normal mode analysis. The correct trends for the binding free energies of mutants are observed by all of the GB methods, however GBOBC (I) performs best, even compared to PB (results not shown). As such, analysis throughout the remainder of the paper pertains to the results obtained using the GBOBC (I) method.
Computed MM-GBSA binding free energies for wild type and F56 mutant U1A-RNA systems using both the single trajectory and separate trajectory methods are reported in Table 2. Numbers are reported using either the closed or open form of free U1A protein in the separate trajectory method. ΔGs relative to wild type are indicated in parentheses for each system. In all cases, the computed free energies of binding for the U1A mutants to SL2 RNA follow the trend of the experimental binding free energies compared to the wild type system. However, the binding free energies are overestimated by MM-GBSA, a common result that has been seen in other studies.20,36 The standard errors (σ) reported in Table 2 are comparable to those seen in other similar MM-GBSA studies20,36 and are generally smaller than the ΔΔGs for the mutants compared to the wild type system. This indicates that the trend in binding free energies compared to the experimental data is upheld upon taking into account the standard error for each system.
Table 2.
Calculated average binding free energy (kcal/mol)
| Single |
Separate Trajectory |
||||||||
|---|---|---|---|---|---|---|---|---|---|
|
Trajectory |
U1A closed |
U1A open |
MP2/ | ||||||
| GBOBC(I)a | σb | GBOBC(I)a | σb | LRa | GBOBC(I)a | σb | 6−311G(d,p)a | EXPTc | |
| Wild Type | −62.1 | 3.7 | −57.7 | 3.5 | −12.3 | −23.1 | 3.4 | 1.7 | −12.7±0.3 |
| (0.0) | (0.0) | (0.0) | (0.0) | (0.0) | (0.0) | ||||
| F56A | −43.8 | 4.0 | −37.4 | 3.8 | −6.8 | 2.7 | 3.5 | 4.0 | −7.2±0.3 |
| (18.3) | (20.3) | (5.5) | (25.9) | (2.4) | (5.5) | ||||
| F56L | −52.5 | 3.7 | −52.3 | 3.6 | −10.7 | −0.4 | 3.3 | 2.4 | −8.6±0.3 |
| (9.6) | (5.4) | (1.6) | (22.7) | (0.7) | (4.1) | ||||
| F56W | −68.9 | 3.6 | −55.2 | 3.7 | −11.4 | −19.4 | 3.3 | 2.4 | −12.7±0.3 |
| (−6.8) | (2.4) | (0.9) | (3.8) | (0.7) | (0.0) | ||||
The differences in the binding free energies between the single trajectory and separate trajectory methods stems from conformational adaptation. The free energies of the bound conformations of U1A protein and SL2 RNA from the single trajectory method are expected to be higher than those of the free conformations from the separate trajectories. As such, the free energies of binding computed from separate trajectories should be larger than those calculated from the single trajectory method. This is indeed observed in the binding free energies in Table 2.
Comparing the binding free energies of the closed and open forms of U1A obtained from the separate trajectory method, ΔG for the closed form is more negative for the wild type and all of the mutants. In general, the trend in binding free energies compared to the experimental values is better for the open form of U1A primarily because of the ΔG for the F56L mutant. However, in terms of absolute binding free energies, the F56A and F56L mutants bind very weakly in the open form and, in fact, a positive ΔG indicates that the F56A mutant should not bind SL2 RNA. For these reasons, and because the NMR structure of the free U1A protein in solution is the closed form, we chose to base the remaining analysis on the closed form of U1A.
The trend in the binding free energies of wild type and mutant U1A-RNA was reproduced very well by MM-GBSA compared to experiment, though the absolute binding free energies were overestimated. As MM-GBSA is empirical in nature, the various energy components may be scaled to obtain more accurate estimates of free energies. The four systems in this study have experimentally known binding free energies, which were used to train the data set. The solute and solvent electrostatic energy components tend to dominate the energy components, so the energy components were factored into electrostatic terms and nonelectrostatic terms, as shown in Equations 11-12. Multiple regression analysis was then applied to optimize the α, β and γ parameters to derive a LR-like equation.
| (1) |
The optimal amount by which the ES and NES terms should be scaled are quite similar (0.2796 and 0.25837, respectively), suggesting that multiplication by a constant may have been a sufficient choice. However, several different methods were explored, including different numbers of parameters, and this equation gave the best fit and lowest error compared to the experimental data.
The results from the LR-type analysis in Eq. 1 are shown in the LR column in Table 2 and reproduce the experimental binding free energies quite well. The binding free energy predicted for the F56L U1A mutant with SL2 RNA remains more favorable than is seen in the experimental results; however, the trend in the mutant binding free energies compared to wild type remains correct compared to the experimental results. The α, β and γ parameter values derived here may be applicable to future MM-GBSA calculations on F56 U1A mutants.
MM-GBSA analysis by chemical forces indicate different underlying causes contributing to experimentally observed binding free energies of different F56 U1A mutants
MM-GBSA-LR provided excellent results computing binding free energies for wild type and several F56 U1A mutants with SL2 RNA compared to the experimental results. The advantage to using an energy component technique such as MM-GBSA-LR is that the resultant data can be further analyzed to obtain information that cannot be obtained from the experimental data. One such technique involves analysis of the contributions of the various energy components for the systems of interest.
The analysis in Figure 4 is based on the separate trajectory method with the free U1A protein in the closed conformation. The individual energy components contributing to the overall binding free energy of U1A-RNA are shown in Figure 4a. The overall free energy of binding is dominated by the solute and solvent electrostatic components. These components are of opposite sign and nearly equal value for each of the systems. This indicates that differences in the solute electrostatics in the systems are generally compensated for by equal and opposite differences in the electrostatic contribution to the solvation free energy. Other components may, of course, contribute to this compensation, as well. In addition, this analysis indicates that very large contributions from the different energy components sum to an overall small binding free energy for wild type U1A-RNA and the F56 mutants, indicated by the TOTAL label in Figure 4a.
Figure 4.

Energy components (kcal/mol) contributing to the overall free energies of binding for wild type and F56 mutant U1A-RNA systems. VAL, ELE and VDW are the solute valence, electronic and van der Waals energy contributions, respectively; GB-ES and NP are the electrostatic and nonpolar contributions to the solvation free energy, respectively; NMODE is the entropy contribution to the free energy; TOTAL is the overall free energy from the summation of the energy components. (a) Absolute energies for wild type, F56A, F56L and F56W systems. (b) Relative energies of F56 mutants compared to wild type. (c) Electrostatic and nonelectrostatic energy contributions of F56 mutants compared to wild type scaled according to Equation 10.
In Figure 4a, the component contributions appear to have quite similar values between wild type and the F56 mutants, due to the large energy values of the electrostatic component contributions. This issue was remedied by plotting the same data of the F56 mutants relative to wild type (Figure 4b). Figure 4b provides a clearer picture of the contributions to the overall binding free energy of the F56 U1A-RNA mutants compared to the wild type system. The F56A U1A mutant has the weakest binding free energy for SL2 RNA compared to the other mutants. According to Figure 4b, this poor binding is due to less favorable solute ELE and VDW contributions compared to wild type that cannot be compensated for by a slightly more favorable VAL and GB-ES. The F56L U1A-RNA mutant also has poor binding compared to wild type. Figure 4b indicates that the energy components for the F56L U1A-RNA mutant are for the most part quite similar to wild type. However, an unfavorable contribution from GB-ES cannot be completely compensated for by a favorable contribution from the VAL component compared to wild type. The F56W U1A-RNA mutant has the largest differences in energy components compared to the wild type system, yet has the most similar overall binding free energy. The unfavorable GB-ES component contribution almost perfectly compensates for the favorable ELE and VDW contributions.
Figure 4c reports the electrostatic and nonelectrostatic energy contributions as well as the overall free energies of binding for the F56 mutants compared to the wild type system. The electrostatic and nonelectrostatic energy components were scaled using the α and β parameters, respectively, from Equation 1. This graph indicates that the F56A system has the poorest binding free energy of all of the mutants because both the ES and NES contributions are unfavorable compared to wild type. This is in contrast to the F56L and F56W systems, which indicate unfavorable ES contributions that are compensated for by favorable NES contributions compared to the wild type system. For the F56W system, the ES and NES contributions are nearly equal in magnitude and opposite in sign, whereas for the F56L system, the favorable NES contribution is not large enough to compensate completely for the unfavorable ES contribution.
Figure 5 plots the energy components of SL2 RNA from the single trajectory method relative to wild type. This enables comparison of the SL2 RNA energetics when bound to wild type and F56 U1A mutants. Though these energies cannot be scaled by the optimized parameters in Equation 1 because they are not ΔGs, they can still contribute to an understanding of differences being imposed on the RNA structure by the mutation at position 56 in U1A. As with the energy components contributing to the overall ΔGs (Figure 4), the most significant differences are in the ELE and GB-ES components compared to wild type, which compensate for each other with nearly equal and opposite values. However, SL2 RNA bound to F56A U1A has the opposite trend compared to wild type U1A than when it is bound to F56L or F56W. The VAL energy component is unfavorable for SL2 RNA bound to all of the mutant proteins compared to wild type, while the VDW energy component is favorable. Overall, SL2 RNA bound to each of the mutant proteins is unfavorable energetically compared to wild type, as indicated by the results in the TOTAL column.
Figure 5.
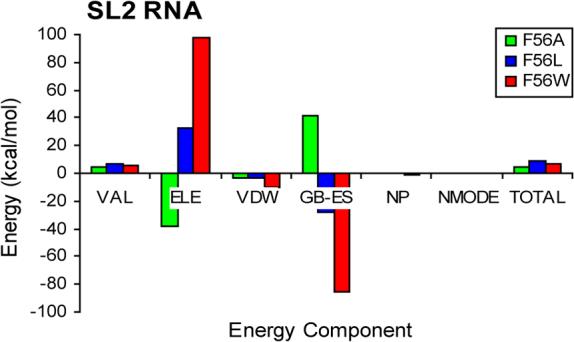
Unscaled energy components (kcal/mol) contributing to the free energy of SL2 RNA bound to F56 U1A mutants relative to wild type obtained from the single trajectory method. Energy components are defined in the caption of Figure 4 and in the text.
MM-GBSA analysis on a residual basis indicates energetic differences throughout F56 mutant systems rather than localized at the site of mutation
Energy decomposition on a per residue basis was performed for the wild type and F56 mutant free U1A proteins in the closed form, free SL2 RNA and U1A-RNA complexes. The ES and NES terms for each residue were collected in both the bound and free forms, followed by scaling based on Equation 1 and calculation of ΔG for each residue. The entropy term complicates matters for this analysis, as it is a collective property of the entire system and cannot be decomposed on a residual basis as may the other energy components. Entropy was, however, originally included in the linear regression analysis which was used to obtain the parameters in Equation 1. In this computation, the approximation is made that it is acceptable to use the α, β and γ parameters from Equation 1 to scale the residual ES and NES terms since change in entropy was similar for all of the systems.
Figure 6 plots the scaled energy decomposition on a residual basis for the F56 mutant systems relative to wild type. Differences in ΔΔG greater than ±0.5 kcal/mol are highlighted in blue. Here, we concentrate mainly on the residues between Thr11 – Lys98, as the N- and C-terminal residues (residues Ala2 – His10 and Gly99 – Val102, respectively) are unstructured and quite mobile in the simulations and are thus expected to vary compared to wild type. As may be seen from the plots, the energy differences are distributed over the entire protein as well as the RNA. The site of mutation, position 56, indicates a significant difference in ΔG compared to wild type for all three mutant systems studied. However, this energy difference is unfavorable for the F56A and F56L mutants, which have unfavorable binding compared to wild type, while the energy difference from the F56W mutant at this position is favorable compared to wild type. The majority of the significant perturbations occur in the loop 3 – β3 and loop 6 – helix C regions of the protein, and the nucleotides involved in binding in the RNA loop region. In addition, the differences in ΔG for the RNA nucleotides are generally unfavorable in the mutant systems.
Figure 6.

Per residue free energy decomposition of F56 mutants compared to wild type (ΔΔG, kcal/mol) scaled according to Equation 10. The secondary structure of U1A residues (2−102) and SL2 RNA (−5 to 16) is indicated. Residues with ΔΔG values ±0.5 kcal/mol compared to wild type are highlighted in blue. The truncated value for Arg7 in the F56W mutant is −1.55 kcal/mol.
Ab initio interaction energetics estimate the extent to which stacking energetics contribute to U1A-RNA binding free energies
Ab initio calculations were performed on U1A-RNA model systems obtained from the average MD structures at the MP2/6−311G(d,p) level of theory to obtain an estimate of the contribution of stacking interactions in U1A-RNA binding. The results of these calculations can be found in Table 2. The F56A mutant has the weakest interaction energy compared to wild type (2.3 kcal/mol), which may be expected due to the loss of stacking interactions. However, the F56L and F56W mutants have very similar interaction energies compared to wild type (0.7 kcal/mol), which is interesting since the Trp mutant maintains stacking while the Leu mutant does not. Hydrophobic interactions may help to compensate for the loss of stacking for the Leu mutant. These interaction energies may provide an estimate of the degree to which a loss of stacking interactions affects binding in the F56 U1A mutants.
Discussion
MM-PBSA and related techniques involve post-processing of MD trajectories to obtain free energy estimates by summing gas phase (MM) and solvent (PB/GB and SA) energetic contributions. Such calculations are pairwise additive, and recent studies have proposed a link between dynamical structure and functional energetics via detailed energy breakdowns into contributions from solute and solvent.17,20,21 The advantage of this class of free energy calculations is the rapidity with which estimates can be obtained on a wide range of individual cases. There are, however, problems to be contended with as well. First and foremost is that additivity per se is an approximation - free energies are in general not additive since the entropic contribution is a collective property of an entire system.51,52 This is inherent in describing MM-PBSA as "phenomenological," i.e. a method postulated on the basis of plausible intuition as opposed to something rigorously derived from a full statistical mechanics partition function. In addition, calculations of this genre are susceptible to both errors of omission and commission. Errors of omission involve the neglect of particular energetic contributions, such as counterion effects and configurational entropy in this study, while errors of commission refer to uncertainties in the estimates of terms included in a model, i.e. the use of a constant dielectric in calculating the solvation free energy or the use of a harmonic potential in the normal mode calculation.
The MM-GBSA adaptation energies, detailed in Table 3, are of considerable interest in the U1A-RNA system due to the conformational changes that take place in both the U1A protein and SL2 RNA. The adaptation energies indicate that free U1A in the open form and free SL2 RNA are less stable in their bound forms than in their free forms, while the same is not true for U1A in the closed form. MM-GBSA also predicts that the open form of U1A is energetically more stable than the closed form, which would suggest the structure of the free 2−102 U1A construct would be in an open form instead of a closed form. These discrepancies may be due to the use of an implicit solvent20 or the neglect of certain terms. In addition, they may be due to the difference in the length of the U1A protein constructs used. The experimental NMR structure is comprised of residues 2−117,7 while the construct used in this study and the experimental binding studies of the F56 mutants is comprised of residues 2−102.12,13,46 It has been observed by NMR that helix C of the 2−102 U1A construct is more dynamic than that of the 2−117 construct,11 and that these motions are on the micro- to millisecond timescale, a longer timescale than can be observed using MD. Dynamical motions of helix C on a 2−3 ns time scale have also been reported by time-resolved fluorescence anisotropy studies,53 NMR,11 and MD.40 These short timescale motions may contribute to dynamical processes on longer timescales. The effect of the length of U1A construct on the dynamics of helix C may be indicated by a crystal structure of the 98 residue construct of U1A reported with helix C in the open position.10 No interconversion between the closed and open forms of free U1A has been observed on the timescale of our simulations, and there is currently no estimate of the energy barrier for interconversion between the two forms.
Table 3.
Conformational adaptation energies (kcal/mol)
|
Single Trajectory |
Separate Trajectory |
Adaptation Energy |
|||
|---|---|---|---|---|---|
| Free U1A (CLOSED) | σa | σa | |||
| Wild Type | −4216.39 | 2.30 | −4200.80 | 2.09 | −15.59 |
| F56A | −4206.42 | 2.37 | −4188.34 | 2.89 | −18.08 |
| F56L | −4238.23 | 2.45 | −4209.61 | 2.28 | −28.62 |
| F56W | −4211.28 | 2.23 | −4197.67 | 2.54 | −13.61 |
|
Free U1A (OPEN) |
|
|
|
|
|
| Wild Type | −4216.39 | 2.30 | −4235.34 | 2.24 | 18.95 |
| F56A | −4206.42 | 2.37 | −4228.46 | 2.09 | 22.04 |
| F56L | −4238.23 | 2.45 | −4261.49 | 2.05 | 23.26 |
| F56W | −4211.28 | 2.23 | −4233.51 | 2.08 | 22.23 |
|
Free SL2 RNA |
|
|
|
|
|
| Wild Type | −4608.26 | 1.47 | −4628.29 | 0.58 | 20.03 |
| F56A | −4603.79 | 1.68 | −4628.29 | 0.58 | 24.50 |
| F56L | −4599.49 | 1.46 | −4628.29 | 0.58 | 28.80 |
| F56W | −4601.03 | 1.44 | −4628.29 | 0.58 | 27.26 |
Standard error of mean values.
Mutation of F56 in U1A to Ala or Leu results in a 5.5 or 4.1 kcal/mol loss in binding free energy compared to wild type, which is a much more detrimental effect on binding than mutation to Trp. Since Trp retains the aromaticity lost upon mutation of Phe, while Ala and Leu do not, it is an obvious assumption to attribute the loss in binding free energy with the Ala and Leu mutants to the loss of stacking interactions upon binding SL2 RNA. However, previous studies have indicated smaller interactions between aromatic amino acids and nucleobases, on a scale of 1−3 kcal/mol.54-60 MP2/6−311G(d,p) interaction energies calculated for model systems of these F56 U1A mutants derived from MD average structures suggest that a loss of stacking is worth 2.3 and 0.7 kcal/mol in the F56A and F56L systems, respectively (hydrophobic interactions in the Leu mutant may partially compensate for loss of the aromatic interaction). These estimates suggest a similar contribution from stacking in this system compared to earlier estimates which do not completely account for the differences in binding free energies. In contrast, stacking is maintained by the Trp mutant, yet it has an interaction energy difference similar to the Leu mutant compared to wild type.
If the experimental binding free energies in Table 2 could completely be accounted for by the stacking interactions between the residue at position 56 and A6 of SL2 RNA, then it might be expected that largest difference in the MM-GBSA component analysis of the F56 mutants would be in the VDW energy component.61 This, however, is not the case. Figure 4b shows that, compared to wild type, the VDW component is unfavorable for F56A, favorable for F56W and very similar for F56L. This result supports the idea that, though stacking contributes to the differences in the binding free energies in the mutants, it is not the only factor. Further analysis of Figures 4b and 4c indicates that there are significant differences between the wild type and F56 mutants in most of the energy components, leading to a complex view of the overall contributions to binding in this system. Though the overall binding free energy is similar for all of the systems, the mutants obtain the overall binding free energies by different mixtures of the various energy terms. This is not necessarily obvious upon inspection of the experimental binding free energies, and indicates different contributing factors to binding for the different F56 mutants.
Inspection of the residual free energies of the F56 mutants compared to wild type (Figure 6) indicates that energetic differences are not localized to the site of the mutation. Rather, the single mutation at position 56 creates differences in residual free energies that are distributed throughout the mutant proteins. This also supports the idea that stacking is not the only factor contributing to the differences in the binding free energies of the F56 mutants. We do note, however, that the main significant differences in the residual free energies are in regions of the protein that have been shown to be involved in conformational adaptation62,63 and in regions important for binding (loop 3 – β3 and loop 6 – helix C).2 There is also significant compensation in the free energies of the residues in the protein, in that significant unfavorable contributions at sites in the protein are compensated for by favorable contributions at other sites.
Analysis of the SL2 RNA energetics also lends support to the idea that stacking is not the sole contributor to differences in the experimental binding free energies in the F56 mutant systems. Figure 5 indicates that energetics of SL2 RNA are less favorable when bound to each of the F56 mutant U1A proteins compared to the wild type system. However, SL2 RNA bound to F56L and F56W mutants is more unfavorable than when bound to the F56A mutant. If stacking was the sole contributor to the differential binding free energies of the mutants, it would be expected that the energy of SL2 RNA bound to F56A U1A would be the least favorable compared to wild type. This idea can be explored further by analysis of the energy decomposition of SL2 RNA on a nucleotide basis (Figure 6). If stacking was the only contributor to the differences in binding free energies of the F56 U1A mutants, it would be expected that a large unfavorable ΔG compared to wild type would appear at the A6 nucleotide (which stacks with Phe56 in wild type U1A) for the Ala and Leu mutants, but not for the Trp mutant. Though all of the mutants do have unfavorable ΔGs compared to wild type at the A6 position, unfavorable ΔGs are not localized specifically to that position, and are seen throughout most of the RNA.
Insight into U1A-RNA binding can be gained from additional analysis of SL2 RNA in these systems. Figure 5 indicates that SL2 RNA bound to the F56A mutant is more favorable than when bound to the F56L and F56W mutants. Since the F56A mutant has the weakest binding free energy compared to the mutants, this result suggests that the poor binding free energy of the F56A system is likely due more to differences in the protein than to differences in the RNA upon binding, which has been suggested previously.38 Energy decomposition of SL2 RNA on a nucleotide basis in the mutant systems (Figure 6) indicates that the majority of nucleotides have unfavorable differences in ΔG compared to wild type. This observation corresponds to the data in Table 3, which shows that the adaptation energy for SL2 RNA is higher upon binding to the F56 U1A mutants than it is upon binding to wild type. Overall, these results indicate that SL2 RNA binding to wild type is more favorable than binding to any of the F56 mutants.
Conclusions
MM-GBSA was used in conjunction with normal mode analysis to successfully account for experimental binding free energies of the U1A protein for SL2 RNA for wild type and several F56 protein mutants. Average energies were obtained from samples of snapshots extracted from MD simulations. The trend in the computed binding free energies for the U1A-RNA mutants was in agreement with the experimental values, though absolute binding free energies were overestimated. A linear-response-like equation was used to scale the various energy components to obtain binding free energies in agreement with the experimental values. Ab initio calculations were performed on model systems to estimate contributions of stacking to binding.
Differences in binding free energies between the single and separate trajectory methods indicate that conformational adaptation is important. Individual component analysis provides insight into the different overall free energies of binding for the F56 mutants. Though overall binding free energies of the F56 U1A mutants are very similar, they arise from different combinations of favorable and unfavorable energetic component contributions. Free energy decomposition on a residual basis indicates differences throughout the entire protein, not only at the site of mutation, and especially in areas of the protein shown to be important for binding. MM-GBSA analysis and ab initio calculations indicate that differences in mutant binding free energies are not completely accounted for by differences in stacking interactions. Taken together, these results indicate that there may be different underlying causes of ostensibly similar experimentally observed binding affinities of different mutants, and thus recommends caution in the interpretation of binding affinities and specificities purely by inspection.
Materials and Methods
MD Simulations
The starting structure for the MD simulation of the wild type U1A-RNA complex was based on the x-ray cocrystal structure of the N-terminal RRM of U1A bound to SL2 of U1 snRNA solved at 1.92 Å resolution,9 PDB ID:64 1URN. Biological unit 2 was chosen for the initial structure as it contains the most complete structural information for SL2 RNA. The U1A protein was extended from the crystal structure construct to obtain a structure containing residues 2 – 102 to match that used in the binding affinity experiments, and two point mutations (H31Y and R36Q) were introduced to revert the protein to the wild type sequence. Details of these procedures have been described previously.40 Point mutations were introduced at the Phe56 position in this structure to create the F56A, F56L and F56W mutant complexes. This extended U1A-RNA complex was then separated into its constituent protein and nucleic acid parts which served as starting structures for the MD simulations of wild type U1A in the open form and the free SL2 RNA, respectively. Point mutations were introduced at the Phe56 position in this U1A structure to create the F56A, F56L and F56W mutants of free U1A in the open conformation. The free SL2 RNA used in the previously reported biochemical studies was a 25mer;12,13,46 however, the SL2 RNA in the x-ray cocrystal structure of the complex and in other MD studies was a 21mer (Figure 1). As previous studies have shown that the shorter SL2 RNA stem does not affect U1A binding,54 the 21mer RNA was used in the calculations described in this paper.
The starting structure for the MD simulation of the wild type U1A in the closed form was based on the NMR solution structure of the unbound protein,7 PDB ID:64 1FHT. Model 5 was selected as the representative structure based on analysis of the 43 NMR structures by NMRCLUST 2.1.65 The U1A NMR structure was truncated from residues 2 – 117 to residues 2 – 102 to match the construct used in the binding affinity experiments. Point mutations were introduced at the Phe56 position in this structure to create the F56A, F56L and F56W mutant forms of free U1A in the closed conformation.
MD simulations were performed using the AMBER66,67 suite of programs with the parm9668 force field. The systems were solvated in a box of explicit TIP3P69 water molecules that extended a minimum distance of 12 Å from the solute atoms. Neutralizing Na+ or Cl− ions were added to each system, after which Na+ and Cl− ions were added to each system to obtain a salt concentration of 250 mM, in accordance with the conditions of the binding affinity experiments. The ions were randomized around the solute such that the ions could be no closer than 5 Å to the solute and no closer than 3 Å to each other. Additional details of the minimization and MD procedures are described in Pitici et al.40 The results presented here are based on a production runs of 3 ns to 32 ns (see Table 1).
Methodology
Free energies of binding were estimated using MM-PBSA or MM-GBSA in AMBER 867 according the methods of Gohlke and Case,20 using an additive free energy component analysis approach. This analysis follows a similar protocol established by Beveridge, Baranger et al. and others in studies of the U1A-RNA complex,38,40,43 the Eco RI endonuclease complex,17 the λ repressor-operator26 and a number of protein-DNA complexes.19
The overall objective of this method is to calculate the absolute binding free energy for the non-covalent association of any two molecules, A and B, in solution, i.e.
| (2) |
where [A]aq refers to the dynamical structure of molecule A free in solution, [B]aq refers to the dynamical structure of molecule B free in solution, and [A*B*]aq* represents the complex formed from molecules A and B, taking into account any structural changes ([A*] and [B*]) and solvent reorganization (aq*) that may occur upon complex formation.
In principle, this calculation requires three MD simulations, one each on [A]aq, [B]aq, and [A*B*]aq*. Gohlke and Case20 refer to this protocol as “separate trajectories” or “three trajectories” (3T). One may also make the (questionable) approximation that structural adaptation is negligible and draw the trajectories for [A]aq and [B]aq from the single MD carried out on [A*B*]aq*, simply by separating the complex into its constituent parts, [A*] aq* and [B*] aq*. This is referred to as the “single trajectory” (1T) method.
The binding free energy for the noncovalent association of two molecules may be written as
| (3) |
The free energy of any molecule X may be divided into a contribution from the solute and a contribution from the solvent.
| (4) |
The free energy contribution from the solute may be expressed as
| (5) |
where
| (6) |
and
| (7) |
Here, 〈E(X)〉 represents the average MM energy of snapshots obtained from the MD simulation(s), which is comprised of internal energy contributions from bonds, angles and torsions (Eval), the electronic energy contribution (Eele) and the van der Waals distance-dependent interaction energy (EvdW), Strans and Srot are the entropic contributions from translational and rotational motion, respectively, obtained from classical statistical mechanics, and Svib is the entropic contribution from vibrational motion, obtained using the normal mode analysis module nmode implemented in AMBER 8. Note that this protocol neglects any small changes in volume upon complex formation as well as configurational entropy contributions from sidechain reorganization.
The quasiharmonic analysis70,71 was used as an alternative method of computing the entropy for this study. The length of the MD simulations were not extensive enough to provide convergent behavior (data not shown), which has been shown previously.20,71 In addition, the quasiharmonic vibrational entropy is highly dependent on the superposition of the structures used for analysis.20 As such, we used results from the normal-mode analysis to estimate entropic contributions in this study.
The free energy contribution from the solvent may be expressed as
| (8) |
where Ges is the electrostatic contribution and Gnp is the nonpolar contribution. In this study, the electrostatic contribution was calculated using PB as implemented in the pbsa program in AMBER 8 or one of several GB programs. GB is an analytic approximation to the PB method for solving the electrostatic contribution to the solvation free energy. The GB methods compared in this study are the Hawkins, Cramer, Truhlar pairwise generalized Born model 72,73 with parameters described by Tsui and Case74 (GBHCT, called by IGB=1 in AMBER 8), the modified GB model developed by Onufriev, Bashford and Case, which has been optimized with two different α, β and γ parameter sets49,50 (GBOBC (I), called by IGB=2 in AMBER 8 and GBOBC (II), called by IGB=5 in AMBER 8), and the GB and modified GB parameterizations derived by Jayaram, Sprous and Beveridge75 (GBJSB, called by IGB=3 in AMBER 7 and MGBJSB, called by IGB=4 in AMBER 7). The nonpolar contribution to the solvation free energy is calculated by
| (9) |
where γ is a surface tension parameter, set to 0.005 for PB76 and 0.0072 for GB,77 SASA(X) is the solvent-accessible surface area of molecule X, computed with the program molsurf,78 and b is a parameterized value, set to 0.86 for PB76 and 0.0 for GB.77
Free energy decomposition was performed on a per-residue basis. Solute free energies and the electrostatic contribution to the solvation free energy were computed according to the methods described earlier in this section, while the nonpolar contribution to the solvation free energy was determined using the LCPO method.79
MM-PB(GB)SA-LR Calculations
Snapshots for MM-PB(GB)SA analysis were collected from the MD simulations once every 20 ps over the stable portion of computed trajectories, as determined from convergence of RMSD plots (Table 1). The same snapshots were used for normal mode analysis except for the free SL2 RNA trajectory, for which snapshots were collected every 200 ps. MM-PB(GB)SA and normal mode analysis were performed on each snapshot and averaged to obtain energy components and overall free energies of binding. Energy components were subsequently scaled using a LR-like equation:
| (10) |
where α, β and γ are weight factors derived from a multiple regression analysis and ΔES and ΔNES represent the electrostatic and nonelectrostatic energy components, respectively, derived from MM-GBSA.
| (11) |
| (12) |
Ab initio Calculations
To probe the stacking energetics involved in U1A-RNA binding, ab initio calculations were performed between A6 of SL2 RNA and Phe56 of U1A, as well as the Ala, Leu, and Trp mutants. Bound forms were obtained using the average structures from MD simulations, followed by deletion of all atoms but the ones of interest. The ribose of A6 and the Cα of the amino acids were then replaced with a methyl group. Interaction energies were calculated using Gaussian 0380 at the MP2/6−311G(d,p) level of theory81-87 in the presence of solvent using a Polarizable Continuum model (PCM).88-100 The free systems were calculated in water (ε=78.39) to mimic a solvated environment, and the bound forms were calculated in diethyl ether (ε=4.335) to mimic the hydrophobic core environment in the U1A-RNA complex. Reported interaction energies include (gas-phase) basis set superposition error (BSSE) corrections.101
Acknowledgements
We would like to thank Dr. Surjit Dixit and Laure Dykas for many helpful discussions and Dr. Felicia Pitici for the use of several earlier U1A MD simulations. Funding was provided by the NIH to AMB (GM-56857) and to DLB (GM-076490). BLK was supported by a NIH Postdoctoral Fellowship (F32 GM072345). This work was partially supported by the National Science Foundation through TeraGrid resources provided by the National Center for Supercomputing Applications under LRAC/NRAC grant number MCA94P011 utilizing the Xeon Linux Cluster and by the Texas Advanced Computing Center utilizing the Cray-Dell PowerEdge Xeon Linux Cluster.
Footnotes
Publisher's Disclaimer: This is a PDF file of an unedited manuscript that has been accepted for publication. As a service to our customers we are providing this early version of the manuscript. The manuscript will undergo copyediting, typesetting, and review of the resulting proof before it is published in its final citable form. Please note that during the production process errors may be discovered which could affect the content, and all legal disclaimers that apply to the journal pertain.
References
- 1.Stark H, Lührmann R. Cryo-Electron Microscopy of Spliceosomal Components. Annu. Rev. Biophys. Biomol. Struct. 2006;35:435–457. doi: 10.1146/annurev.biophys.35.040405.101953. [DOI] [PubMed] [Google Scholar]
- 2.Maris C, Dominguez C, Allain FH-T. The RNA recognition motif, a plastic RNA-binding platform to regulate post-transcriptional gene expression. FEBS J. 2005;272:2118–2131. doi: 10.1111/j.1742-4658.2005.04653.x. [DOI] [PubMed] [Google Scholar]
- 3.Varani G, Nagai K. RNA recognition by RNP proteins during RNA processing. Annu. Rev. Biophys. Biomol. Struct. 1998;27:407–445. doi: 10.1146/annurev.biophys.27.1.407. [DOI] [PubMed] [Google Scholar]
- 4.Hall KB. Interaction of RNA hairpins with the human U1A N-terminal RNA binding domain. Biochemisty. 1994;33:10076–10088. doi: 10.1021/bi00199a035. [DOI] [PubMed] [Google Scholar]
- 5.Tsai DE, Harper DS, Keene JD. U1-snRNP-A selects a ten nucleotide consensus sequence from a degenerate RNA pool presented in various structural contexts. Nucleic Acids Res. 1991;19:4931–4936. doi: 10.1093/nar/19.18.4931. [DOI] [PMC free article] [PubMed] [Google Scholar]
- 6.Boelens WC, Jansen EJ, van Venrooij WJ, Stripecke R, Mattaj IW, Gunderson SI. The human U1 snRNP-specific U1A protein inhibits polyadenylation of its own pre-mRNA. Cell. 1993;72:881–892. doi: 10.1016/0092-8674(93)90577-d. [DOI] [PubMed] [Google Scholar]
- 7.Avis JM, Allain FH-T, Howe PWA, Varani G, Nagai K, Neuhaus D. Solution structure of the N-terminal RNP domain of U1A protein: The role of C-terminal residues in structure stability and RNA binding. J. Mol. Biol. 1996;257:398–411. doi: 10.1006/jmbi.1996.0171. [DOI] [PubMed] [Google Scholar]
- 8.Nagai K, Oubridge C, Jessen TH, Li J, Evans PR. Crystal structure of the RNA-binding domain of the U1 small nuclear ribonucleoprotein A. Nature. 1990;348:515–520. doi: 10.1038/348515a0. [DOI] [PubMed] [Google Scholar]
- 9.Oubridge C, Ito N, Evans PR, Teo CH, Nagai K. Crystal structure at 1.92 A resolution of the RNA-binding domain of the U1A spliceosomal protein complexed with an RNA hairpin. Nature. 1994;372:432–438. doi: 10.1038/372432a0. [DOI] [PubMed] [Google Scholar]
- 10.Rupert PB, Xiao H, Ferre-D'Amare AR. U1A RNA-binding domain at 1.8 A resolution. Acta Crystallogr., Sect. D: Biol. Crystallogr. 2003;59:1521–1524. doi: 10.1107/s0907444903011338. [DOI] [PubMed] [Google Scholar]
- 11.Mittermaier A, Varani L, Muhandiram DR, Kay LE, Varani G. Changes in side-chain and backbone dynamics identify determinants of specificity in RNA recognition by human U1A protein. J. Mol. Biol. 1999;294:967–979. doi: 10.1006/jmbi.1999.3311. [DOI] [PubMed] [Google Scholar]
- 12.Nolan SJ, Shiels JC, Tuite JB, Cecere KL, Baranger AM. Recognition of an Essential Adenine at a Protein-RNA Interface: Comparison of the Contributions of Hydrogen Bonds and a Stacking Interaction. J. Am. Chem. Soc. 1999;121:8951–8952. [Google Scholar]
- 13.Shiels JC, Tuite JB, Nolan SJ, Baranger AM. Investigation of a conserved stacking interaction in target site recognition by the U1A protein. Nucleic Acids Res. 2002;30:550–558. doi: 10.1093/nar/30.2.550. [DOI] [PMC free article] [PubMed] [Google Scholar]
- 14.Tuite JB, Shiels JC, Baranger AM. Substitution of an essential adenine in the U1A-RNA complex with a non-polar isostere. Nucleic Acids Res. 2002;30:5269–5275. doi: 10.1093/nar/gkf636. [DOI] [PMC free article] [PubMed] [Google Scholar]
- 15.Ajay A, Murcko MA. Computational Methods to Predict Binding Free Energies in Ligand- Receptor Complexes. J. Med. Chem. 1995;38:4953–4967. doi: 10.1021/jm00026a001. [DOI] [PubMed] [Google Scholar]
- 16.Swanson JM, Henchman RH, McCammon JA. Revisiting free energy calculations: a theoretical connection to MM/PBSA and direct calculation of the association free energy. Biophys. J. 2004;86:67–74. doi: 10.1016/S0006-3495(04)74084-9. [DOI] [PMC free article] [PubMed] [Google Scholar]
- 17.Jayaram B, McConnell K, Dixit SB, Beveridge DL. Free Energy Analysis of Protein-DNA Binding: The EcoRI Endonuclease - DNA Complex. J. Comput. Phys. 1999;151:333–357. [Google Scholar]
- 18.Kollman PA, Massova I, Reyes C, Kuhn B, Huo S, Chong L, Lee M, Lee T, Duan Y, Wang W, Donini O, Cieplak P, Srinivasan J, Case DA, Cheatham TE., III Calculating Structures and Free Energies of Complex Molecules: Combining Molecular Mechanics and Continuum Models. Acc. Chem. Res. 2000;33:889–897. doi: 10.1021/ar000033j. [DOI] [PubMed] [Google Scholar]
- 19.Jayaram B, McConnell K, Dixit SB, Das A, Beveridge DL. Free-energy component analysis of 40 protein-DNA complexes: A consensus view on the thermodynamics of binding at the molecular level. J. Comput. Chem. 2002;23:1–14. doi: 10.1002/jcc.10009. [DOI] [PubMed] [Google Scholar]
- 20.Gohlke H, Case DA. Converging Free Energy Estimates: MM-PB(GB)SA Studies on the Protein-Protein Complex Ras-Raf. J. Comput. Chem. 2004;25:238–250. doi: 10.1002/jcc.10379. [DOI] [PubMed] [Google Scholar]
- 21.Gohlke H, Kiel C, Case DA. Insights into Protein-Protein Binding by Binding Free Energy Calculation and Free Energy Decomposition for the Ras-Raf and Ras-RalGDS Complexes. J. Mol. Biol. 2003;330:891–913. doi: 10.1016/s0022-2836(03)00610-7. [DOI] [PubMed] [Google Scholar]
- 22.Proloff N, Windemuth A, Honig B. On the Calculation of Binding Free Energies using Continuum Methods: Application to MHC Class I Protein- Peptide Interactions. Protein Sci. 1997;6:1293–1301. doi: 10.1002/pro.5560060617. [DOI] [PMC free article] [PubMed] [Google Scholar]
- 23.Gilson MK, Given JA, Bush BL, McCammon JA. The Statistical Thermodynamic Basis for Computation of Binding Affinities: A Critical Review. Biophys. J. 1997;72:1047–1069. doi: 10.1016/S0006-3495(97)78756-3. [DOI] [PMC free article] [PubMed] [Google Scholar]
- 24.Novotny J, Bruccoleri RE, Davis M, Sharp KA. Empirical free energy calculations: a blind test and further improvements to the method. J. Mol. Biol. 1997;268:401–411. doi: 10.1006/jmbi.1997.0961. [DOI] [PubMed] [Google Scholar]
- 25.Simonson T, Archontis G, Karplus M. Free energy simulations come of age: protein-ligand recognition. Acc. Chem. Res. 2002;35:430–437. doi: 10.1021/ar010030m. [DOI] [PubMed] [Google Scholar]
- 26.Kombo DC, Jayaram B, McConnell KJ, Beveridge DL. Calculation of the Affinity of the λ Repressor-Operator Complex Based on Free Energy Component Analysis. Mol. Simul. 2002;28:187–211. [Google Scholar]
- 27.Zhou Z, Madura JD. Relative Free Energy of Binding and Binding Mode Calculations of HIV-1 RT Inhibitors Based on Dock-MM-PG/GS. Proteins: Struct., Funct., Bioinf. 2004;57:493–403. doi: 10.1002/prot.20223. [DOI] [PubMed] [Google Scholar]
- 28.Zhou Z, Bates M, Madura JD. Structure Modeling, Ligand Binding, and Binding Affinity Calculation (LR-MM-PBSA) of Human Heparanase for Inhibition and Drug Design. Proteins: Struct., Funct., Bioinf. 2006;65:580–592. doi: 10.1002/prot.21065. [DOI] [PubMed] [Google Scholar]
- 29.Lee FS, Chu Z-T, Bolger MB, Warshel A. Calculations of antibody-antigen interactions: microscopic and semi-microscopic evaluation of the free energies of binding of phosphorylcholine analogs to McPC603. Protein Eng. 1992;5:215–228. doi: 10.1093/protein/5.3.215. [DOI] [PubMed] [Google Scholar]
- 30.Aqvist J, Medina C, Samuelsson JE. A new method for predicting binding affinity in computer-aided drug design. Protein Eng. 1994;7:385–391. doi: 10.1093/protein/7.3.385. [DOI] [PubMed] [Google Scholar]
- 31.Carlson HA, Jorgensen WL. An Extended Linear Resonse Method For Determining Free Energies of Hydration. J. Phys. Chem. 1995;99:10677–10673. [Google Scholar]
- 32.Reyes CM, Kollman PA. Molecular dynamics studies of U1A-RNA complexes. RNA. 1999;5:235–244. doi: 10.1017/s1355838299981657. [DOI] [PMC free article] [PubMed] [Google Scholar]
- 33.Tang Y, Nilsson L. Molecular dynamics simulations of the complex between human U1A protein and hairpin II of U1 small nuclear RNA and of free RNA in solution. Biophys. J. 1999;77:1284–1305. doi: 10.1016/S0006-3495(99)76979-1. [DOI] [PMC free article] [PubMed] [Google Scholar]
- 34.Hermann T, Westhof E. Simulations of the dynamics at an RNA-protein interface. Nat. Struct. Biol. 1999;6:540–544. doi: 10.1038/9310. [DOI] [PubMed] [Google Scholar]
- 35.Reyes CM, Kollman PA. Investigating the Binding Specificity of U1ARNA by Computational Mutagenesis. J. Mol. Biol. 2000;295:1–6. doi: 10.1006/jmbi.1999.3319. [DOI] [PubMed] [Google Scholar]
- 36.Reyes CM, Kollman PA. Structure and Thermodynamics of RNA-protein Binding: Using Molecular Dynamics and Free Energy Analyses to Calculate the Free Energies of Binding and Conformational Change. J. Mol. Biol. 2000;297:1145–1158. doi: 10.1006/jmbi.2000.3629. [DOI] [PubMed] [Google Scholar]
- 37.Olson MA. Calculations of free-energy contributions to protein-RNA complex stabilization. Biophys. J. 2001;81:1841–1853. doi: 10.1016/S0006-3495(01)75836-5. [DOI] [PMC free article] [PubMed] [Google Scholar]
- 38.Blakaj DM, McConnell KJ, Beveridge DL, Baranger AM. Molecular dynamics and thermodynamics of protein-RNA interactions: Mutation of a conserved aromatic residue modifies stacking interactions and structural adaptation in the U1A-stem loop 2 RNA complex. J. Am. Chem. Soc. 2001;123:2548–2551. doi: 10.1021/ja005538j. [DOI] [PubMed] [Google Scholar]
- 39.Showalter SA, Hall KB. A functional role for correlated motion in the N-terminal RNA-binding domain of human U1A protein. J. Mol. Biol. 2002;322:533–542. doi: 10.1016/s0022-2836(02)00804-5. [DOI] [PubMed] [Google Scholar]
- 40.Pitici F, Beveridge DL, Baranger AM. Molecular dynamics simulation studies of induced fit and conformational capture in U1A-RNA binding: Do molecular substates code for specificity. Biopolymers. 2002;65:424–435. doi: 10.1002/bip.10251. [DOI] [PubMed] [Google Scholar]
- 41.Showalter SA, Hall KB. Altering the RNA-binding mode of the U1A RBD1 protein. J. Mol. Biol. 2004;335:465–480. doi: 10.1016/j.jmb.2003.10.055. [DOI] [PubMed] [Google Scholar]
- 42.Showalter SA, Hall KB. Correlated Motions in the U1 snRNA Stem/Loop 2:U1A RBD1 Complex. Biophys. J. 2005;89:2046–2058. doi: 10.1529/biophysj.104.058032. [DOI] [PMC free article] [PubMed] [Google Scholar]
- 43.Zhao Y, Kormos BL, Beveridge DL, Baranger AM. Molecular Dynamics Simulation Studies of a Protein-RNA Complex with a Selectively Modified Binding Interface. Biopolymers. 2006;81:256–269. doi: 10.1002/bip.20408. [DOI] [PubMed] [Google Scholar]
- 44.Kormos BL, Baranger AM, Beveridge DL. Do Collective Atomic Fluctuations Account for Cooperative Effects? Molecular Dynamics Studies of the U1A-RNA Complex. J. Am. Chem. Soc. 2006;128:8992–8993. doi: 10.1021/ja0606071. [DOI] [PMC free article] [PubMed] [Google Scholar]
- 45.Kormos BL, Baranger AM, Beveridge DL. A study of collective atomic fluctuations and cooperativity in the U1A-RNA complex based on molecular dynamics simulations. J. Struct. Biol. 2007;157:500–513. doi: 10.1016/j.jsb.2006.10.022. [DOI] [PMC free article] [PubMed] [Google Scholar]
- 46.Zhao Y, Baranger AM. Design of an adenosine analogue that selectively improves the affinity of a mutant U1A protein for RNA. J. Am. Chem. Soc. 2003;125:2480–2488. doi: 10.1021/ja021267w. [DOI] [PubMed] [Google Scholar]
- 47.Katsamba PS, Myszka DG, Laird-Offringa IA. Two functionally distinct steps mediate high affinity binding of U1A protein to U1 hairpin II RNA. J. Biol. Chem. 2001;276:21476–21481. doi: 10.1074/jbc.M101624200. [DOI] [PubMed] [Google Scholar]
- 48.Law MJ, Chambers EJ, Katsamba PS, Haworth IS, Laird-Offringa IA. Kinetic analysis of the role of the tyrosine 13, phenylalanine 56 and glutamine 54 network in the U1A/U1 hairpin II interaction. Nucleic Acids Res. 2005;33:2917–2928. doi: 10.1093/nar/gki602. [DOI] [PMC free article] [PubMed] [Google Scholar]
- 49.Onufriev A, Bashford D, Case DA. Modification of the Generalized Born Model Suitable for Macromolecules. J. Phys. Chem. B. 2000;104:3712–3720. [Google Scholar]
- 50.Onufriev A, Bashford D, Case DA. Exploring protein native states and large-scale conformational changes with a modified generalized Born model. Proteins: Struct., Funct., Bioinf. 2004;55:383–394. doi: 10.1002/prot.20033. [DOI] [PubMed] [Google Scholar]
- 51.Dill KA. Additivity principles in biochemistry. J. Biol. Chem. 1997;272:701–704. doi: 10.1074/jbc.272.2.701. [DOI] [PubMed] [Google Scholar]
- 52.Smith PE, van Gunsteren WF. When are Free Energy Components Meaningful. J. Phys. Chem. 1994;98:13735–13740. [Google Scholar]
- 53.Agumeh M, Anunciado D, Knee J, Baranger AM. Investigation of the Dynamics of a Helix in the U1A Protein By Time-Resolved Anisotropy Measurements. 2007. Manuscript in preparation. [DOI] [PMC free article] [PubMed]
- 54.Kranz JK, Lu J, Hall KB. Contribution of the tyrosines to the structure and function of the human U1A N-terminal RNA binding domain. Protein Sci. 1996;5:1567–1583. doi: 10.1002/pro.5560050812. [DOI] [PMC free article] [PubMed] [Google Scholar]
- 55.LeCuyer KA, Behlen LS, Uhlenbeck OC. Mutagenesis of a stacking contact in the MS2 coat protein-RNA complex. EMBO J. 1996;15:6847–6853. [PMC free article] [PubMed] [Google Scholar]
- 56.Deardorff JA, Sachs AB. Differential Effects of Aromatic and Charged Residue Substitutions in the RNA Binding Domains of the Yeast Poly(A)-binding Protein. J. Mol. Biol. 1997;269:67–81. doi: 10.1006/jmbi.1997.1013. [DOI] [PubMed] [Google Scholar]
- 57.Anderson EM, Halsey WA, Wuttke DS. Site-Directed Mutagenesis Reveals the Thermodynamic Requirements for Single-Stranded DNA Recognition by the Telomere-Binding Protein Cdc13. Biochemisty. 2003;42:3751–3758. doi: 10.1021/bi027047c. [DOI] [PubMed] [Google Scholar]
- 58.Butterfield SM, Cooper WJ, Waters ML. Minimalist Protein Design: A β-Hairpin Peptide That Binds ssDNA. J. Am. Chem. Soc. 2005;127:24–25. doi: 10.1021/ja045002o. [DOI] [PubMed] [Google Scholar]
- 59.Huang C-Y, Hsu C-H, Sun Y-J, Wu H-N, Hsiao C-D. Complexed crystal structure of replication restart primosome protein PriB reveals a novel single-stranded DNA-bonding mode. Nucleic Acids Res. 2006;34:3878–3886. doi: 10.1093/nar/gkl536. [DOI] [PMC free article] [PubMed] [Google Scholar]
- 60.Zeeb M, Max KEA, Weininger U, Löw C, Sticht H, Balbach J. Recognition of T-rich single-stranded DNA by the cold shock protein Bs-CspB in solution. Nucleic Acids Res. 2006;34:4561–4571. doi: 10.1093/nar/gkl376. [DOI] [PMC free article] [PubMed] [Google Scholar]
- 61.Friedman RA, Honig B. A Free Energy Analysis of Nucleic Acid Base Stacking in Aqueous Solution. Biophys. J. 1995;69:1528–1535. doi: 10.1016/S0006-3495(95)80023-8. [DOI] [PMC free article] [PubMed] [Google Scholar]
- 62.Williamson JR. Induced fit in RNA-protein recognition. Nat. Struct. Biol. 2000;7:834–837. doi: 10.1038/79575. [DOI] [PubMed] [Google Scholar]
- 63.Leulliot N, Varani G. Current Topics in RNA-Protein Recognition: Control of Specificity and Biological Function through Induced Fit and Conformational Capture. Biochemisty. 2001;40:7947–7956. doi: 10.1021/bi010680y. [DOI] [PubMed] [Google Scholar]
- 64.Berman HM, Westbrook J, Feng Z, Gilliland G, Bhat TN, Weissig H, Shindyalov IN, Bourne PE. The Protein Data Bank. Nucleic Acids Res. 2000;28:235–242. doi: 10.1093/nar/28.1.235. [DOI] [PMC free article] [PubMed] [Google Scholar]
- 65.Kelley LA, Gardner SP, Sutcliffe MJ. An Automated Approach for Clustering an Ensemble of NMR-Derived Protein Structures into Conformationally-Related Subfamilies. Protein Eng. 1996;9:1063–1065. doi: 10.1093/protein/9.11.1063. [DOI] [PubMed] [Google Scholar]
- 66.Pearlman DA, Case DA, Caldwell JW, Ross WS, Cheatham TE, III, DeBolt S, Ferguson D, Seibel G, Kollman P. AMBER, a package of computer programs for applying molecular mechanics, normal mode analysis, molecular dynamics and free energy calculations to simulate the structural and energetic properties of molecules. Comput. Phys. Commun. 1995;91:1–41. [Google Scholar]
- 67.Case DA, Darden TA, Cheatham TE, III, Simmerling CL, Wang J, Duke RE, Luo R, Merz KM, Wang B, Pearlman DA, Crowley M, Brozell S, Tsui V, Gohlke H, Mongan J, Hornak V, Cui G, Beroza P, Schafmeister C, Caldwell JW, Ross WS, Kollman P. AMBER 8. University of California; San Francisco: 2004. [Google Scholar]
- 68.Kollman PA, Dixon R, Cornell W, Fox T, Chipot C, Pohorille A. The development/application of a ‘minimalist’ organic/biochemical molecular mechanic force field using a combination of ab initio calculations and experimental data. In: Wilkinson A, Weiner P, van Gunsteren WF, editors. Computer Simulation of Biomolecular Systems. Vol. 3. Kluwer; London: 1997. pp. 83–96. [Google Scholar]
- 69.Jorgensen WL, Chandrasekhar J, Madura JD, Impey RW, Klein ML. Comparison of Simple Potential Functions for Simulating Liquid Water. J. Chem. Phys. 1983;79:926–936. [Google Scholar]
- 70.Schlitter J. Estimation of Absolute and Relative Entropies of Macromolecules Using the Covariance Matrix. Chem. Phys. Lett. 1993;215:617–621. [Google Scholar]
- 71.Dixit SB, Andrews DQ, Beveridge DL. Induced Fit and the Entropy of Structural Adaptation in the Complexation of CAP and lambda Repressor with Cognate DNA Sequences. Biophys. J. 2005;88:3147–3157. doi: 10.1529/biophysj.104.053843. [DOI] [PMC free article] [PubMed] [Google Scholar]
- 72.Hawkins GD, Cramer CJ, Truhlar DG. Pairwise Solute Descreening of Solute Charges from a Dielectric Medium. Chem. Phys. Lett. 1995;246:122–129. [Google Scholar]
- 73.Hawkins GD, Cramer CJ, Truhlar DG. Parametrized models of aqueous free energies of solvation based on pairwise descreening of solute atomic charges from a dielectric medium. J. Phys. Chem. 1996;100:19824–19839. [Google Scholar]
- 74.Tsui V, Case DA. Theory and Applications of the Generalized Born Solvation Model in Macromolecular Simulations. Biopolymers (Nucleic Acid Sciences) 2001;56:257–291. doi: 10.1002/1097-0282(2000)56:4<275::AID-BIP10024>3.0.CO;2-E. [DOI] [PubMed] [Google Scholar]
- 75.Jayaram B, Sprous D, Beveridge DL. Solvation Free Energy of Biomacromolecules: Parameters for a Modified Generalized Born Model Consistent with the AMBER Force Field. J. Phys. Chem. B. 1998;102:9571–9576. [Google Scholar]
- 76.Sitkoff D, Sharp KA, Honig B. Accurate Calculation of Hydration Free Energies Using Macroscopic Solvent Models. J. Phys. Chem. 1994;98:1978–1988. [Google Scholar]
- 77.Still WC, Tempczyk A, Hawley RC, Hendrickson T. Semianalytical Treatment of Solvation for Molecular Mechanics and Dynamics. J. Am. Chem. Soc. 1990;112:6127–6129. [Google Scholar]
- 78.Connolly ML. Analytical Molecular Surface Calculation. J. Appl. Crystallogr. 1983;16:548–558. [Google Scholar]
- 79.Weiser J, Shenkin PS, Still WC. Approximate Atomic Surfaces from Linear Combinations of Pairwise Overlaps (LCPO) J. Comput. Chem. 1999;20:217–230. [Google Scholar]
- 80.Frisch MJ, Trucks GW, Schlegel HB, Scuseria GE, Robb MA, Cheeseman JR, Montgomery J, J.A., Vreven T, Kudin KN, Burant JC, Millam JM, Iyengar SS, Tomasi J, Barone V, Mennucci B, Cossi M, Scalmani G, Rega N, Petersson GA, Nakatsuji H, Hada M, Ehara M, Toyota K, Fukuda R, Hasegawa J, Ishida M, Nakajima T, Honda Y, Kitao O, Nakai H, Klene M, Li X, Knox JE, Hratchian HP, Cross JB, Bakken V, Adamo C, Jaramillo J, Gomperts R, Stratmann RE, Yazyev O, Austin AJ, Cammi R, Pomelli C, Ochterski JW, Ayala PY, Morokuma K, Voth GA, Salvador P, Dannenberg JJ, Zakrzewski VG, Dapprich S, Daniels AD, Strain MC, Farkas O, Malick DK, Rabuck AD, Raghavachari K, Foresman JB, Ortiz JV, Cui Q, Baboul AG, Clifford S, Cioslowski J, Stefanov BB, Liu G, Liashenko A, Piskorz P, Komaromi I, Martin RL, Fox DJ, Keith T, Al-Laham MA, Peng CY, Nanayakkara A, Challacombe M, Gill PMW, Johnson B, Chen W, Wong MW, Gonzalez C, Pople JA. Gaussian 03. Gaussian, Inc.; Wallingford, CT: 2004. [Google Scholar]
- 81.Møller C, Plesset MS. Note on an Approximation Treatment for Many-Electron Systems. Phys. Rev. 1934;46:618–622. [Google Scholar]
- 82.Head-Gordon M, Pople JA, Frisch MJ. MP2 energy evaluation by direct methods. Chem. Phys. Lett. 1988;153:503–506. [Google Scholar]
- 83.Sæbø S, Almlöf J. Avoiding the integral storage bottleneck in LCAO calculations of electron correlation. Chem. Phys. Lett. 1989;154:83–89. [Google Scholar]
- 84.Frisch MJ, Head-Gordon M, Pople JA. A direct MP2 gradient method. Chem. Phys. Lett. 1990;3:275–280. [Google Scholar]
- 85.Frisch MJ, Head-Gordon M, Pople JA. Semi-direct algorithms for the MP2 energy and gradient. Chem. Phys. Lett. 1990;166:281–289. [Google Scholar]
- 86.Head-Gordon M, Head-Gordon T. Analytic MP2 frequencies without fifth-order storage. Theory and application to bifurcated hydrogen bonds in the water hexamer. Chem. Phys. Lett. 1994;220:122–128. [Google Scholar]
- 87.Hehre WJ, Radom L, Schleyer P. v. R., Pople JA. Ab Initio Molecular Orbital Theory. Wiley; New York: 1986. [Google Scholar]
- 88.Miertš S, Scrocco E, Tomasi J. Electrostatic interaction of a solute with a continuum. A direct utilization of AB initio molecular potentials for the prevision of solvent effects. Chem. Phys. 1981;55:117–129. [Google Scholar]
- 89.Miertš S, Tomasi J. Approximate evaluations of the electrostatic free energy and internal energy changes in solution processes. Chem. Phys. 1982;65:239–245. [Google Scholar]
- 90.Cossi M, Barone V, Cammi R, Tomasi J. Ab initio study of solvated molecules: a new implementation of the polarizable continuum model. Chem. Phys. Lett. 1996;255:327–335. [Google Scholar]
- 91.Mennucci B, Tomasi J. Continuum solvation models: A new approach to the problem of solute's charge distribution and cavity boundaries. J. Chem. Phys. 1997;106:5151–5158. [Google Scholar]
- 92.Mennucci B, Cances E, Tomasi J. Evaluation of Solvent Effects in Isotropic and Anisotropic Dielectrics and in Ionic Solutions with a Unified Integral Equation Method: Theoretical Bases, Computational Implementation, and Numerical Applications. J. Phys. Chem. B. 1997;101:10506–10517. [Google Scholar]
- 93.Cammi R, Mennucci B, Tomasi J. Second-Order Møller-Plesset Analytical Derivatives for the Polarizable Continuum Model Using the Relaxed Density Approach. J. Chem. Phys. A. 1999;103:9100–9108. [Google Scholar]
- 94.Cossi M, Barone V, Robb MA. A direct procedure for the evaluation of solvent effects in MC-SCF calculations. J. Chem. Phys. 1999;111:5295–5302. [Google Scholar]
- 95.Cammi R, Mennucci B, Tomasi J. Fast Evaluation of Geometries and Properties of Excited Molecules in Solution: A Tamm-Dancoff Model with Application to 4-Dimethylaminobenzonitrile. J. Phys. Chem. A. 2000;104:5631–5637. [Google Scholar]
- 96.Cossi M, Barone V. Solvent effect on vertical electronic transitions by the polarizable continuum model. J. Chem. Phys. 2000;112:2427–2435. [Google Scholar]
- 97.Cossi M, Barone V. Time-dependent density functional theoty for molecules in liquid solutions. J. Chem. Phys. 2001;115:4708–4717. [Google Scholar]
- 98.Cossi M, Rega N, Scalmani G, Barone V. Polarizable dielectric model of solvation with inclusion of charge penetration effects. J. Chem. Phys. 2001;114:5691–5701. [Google Scholar]
- 99.Cossi M, Scalmani G, Rega N, Barone V. New developments in the polarizable continuum model for quantum mechanical and classical calculations on molecules in solution. J. Chem. Phys. 2002;117:43–54. [Google Scholar]
- 100.Cossi M, Rega N, Scalmani G, Barone V. Energies, structures, and electronic properties of molecules in solution with the C-PCM solvation model. J. Comput. Chem. 2003;24:669–681. doi: 10.1002/jcc.10189. [DOI] [PubMed] [Google Scholar]
- 101.Boys SF, Bernardi F. The calculation of small molecular interactions by the differences of separate total energies. Some procedures with reduced errors. Mol. Phys. 1970;19:553–566. [Google Scholar]