Abstract
Contrast between tagged and nontagged myocardium was investigated using rapid gradient echo segmented k-space CINE MRI. The transient behavior of magnetization was measured in stationary and moving phantoms using gradient recalled acquisition in steady-state GRASS and spoiled GRASS (SPGR) sequences with TR ≈ 7 ms and TE ≈ 2.5 ms. Bloch equation simulations were used to compute theoretical results. Understanding the transient behavior of magnetization is important because tags only persist in the myocardium during the nonequilibrium transition to steady state. The transition to steady state for both SPGR and GRASS is reproducible after one heartbeat, and including unprocessed data from the first heartbeat leads to image artifacts. In a moving phantom, simulations and experimental results showed that GRASS and SPGR are essentially equivalent. Tag-tissue contrast in SPGR was very sensitive to imaging tip angle. The optimum tip angle for the scanning parameters used in this study was 11°.
Keywords: MRI, tagging, optimization, fast-scan
INTRODUCTION
Over the past several years, MRI presaturation tagging techniques have been developed for the measurement of myocardial strain (1-4). Recent shifts from standard spin-echo imaging toward breath-hold rapid gradient echo imaging (5) have alleviated motion artifacts from patient breathing and blood flow. As a result, image acquisition takes place during the transition toward steady state, characteristic of rapid gradient echo imaging (6). The nonequilibrium state of magnetization during acquisition is what provides contrast between the tags and myocardium. Not only will tag inversion affect tag-tissue contrast, but also the imaging tip angle (α), the type of pulse sequence, and the presence of in-plane myocardial motion.
To better understand tag-tissue contrast, the transient behavior of the magnetization signal was measured in a phantom on a Signa scanner and characterized with Bloch equation simulations, for conditions used during breath-hold cardiac tagged MRI.
METHODS
Pulse Sequence
Figure 1 shows a rapid gradient echo pulse sequence previously described (5) for a Signa 1.5T scanner (version 4.7), capable of both gradient recalled acquisition in steady state GRASS and spoiled GRASS (SPGR) modes. Spoiling in SPGR was achieved with a phase cycling method (7).
FIG. 1.
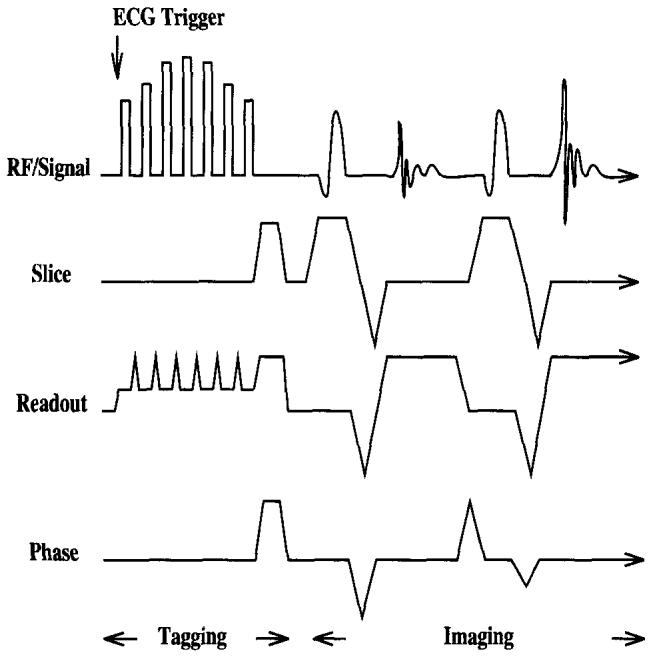
GRASS/SPGR tagging pulse sequence as coded for Signa. Tagging pulses are followed by a train of imaging pulses. Two phase encoding steps are shown.
Tagging was ECG triggered, followed immediately by image acquisition. Parallel line tagging patterns were produced with a DANTE/SPAMM hybrid sequence (2, 5, 8) diagrammed in Fig. 1.
The raw data for CINE MRI was sampled using the segmented k-space approach described by Atkinson and Edelman (9). N movie frames were captured over 8 to 16 heartbeats. During each heartbeat, 4 to 16 ky lines of k-space were filled, with the same lines filled in each movie frame. Lines of k-space were interleaved to reduce ghost artifacts from amplitude modulation in the phase encoding direction as the magnetization moved toward the steady state (5).
Experiments
Tag Contrast Experiments
A stationary phantom (T1 = 685 ms, T2 = 73 ms) made from agarose (1.5% wt) and CuSO4 (1.25 mM) was used to emulate the relaxation characteristics of the myocardium (10).
The approach to steady-state of the sample during the application of a series of RF pulses was measured for GRASS and SPGR (TR = 7.3 ms, TE = 2.7 ms, α = 20°, slice = 1 cm), with and without a nonselective preinversion pulse. The phase encoding gradient was disabled and data was collected over 4 “R-R” intervals (1200 ms duration each) of 64 repetitions each, to simulate cardiac gating. The signal was calculated from the magnitude of the complex echo data after noise correction (11) and normalization to the signal of a fully relaxed magnetization vector after a 90° pulse.
Tag contrast data was acquired by imaging the sample over eight cine frames with eight phase encoding steps/frame after an axial tag was applied (full width at half maximum of 6 mm, TR = 6.5 ms, TE = 2.4 ms, slice = 1 cm, Ny = 128). The contrast was calculated as the signal difference between the nontagged and tagged regions of the phantom. Tag intensity was calculated from the average signal along the center line of the tag, and the nontagged intensity from the average signal in a nontagged region of interest (ROI). Contrast was measured for tags with flip angles of 180° and 90°. Figure 2 is a sagittal image of the phantom, with an axial tag.
FIG. 2.
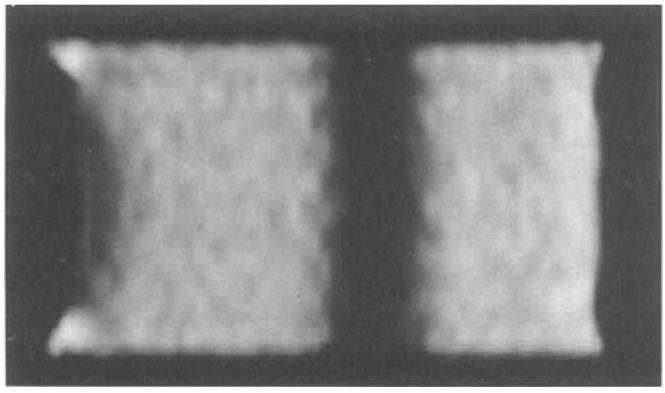
Sagittal image of stationary agarose phantom in its 8th cine phase. A 6-mm axial tag is seen in the center of the image.
Experiments to Measure the Effect of Motion
The pulse sequence described in the Pulse Sequence section was also used to measure the effect of motion. Measurements of the transition of the magnetization to steady state were made when the phantom was at velocities ranging from 2 to 10 cm/s to simulate velocities found in the heart. A linear pull rig with a sliding carriage attached to a Harvard pump was used to produce near sinusoidal velocities in the Bo direction, which was also chosen as the readout direction (12).
A microswitch trigger gated the scanner to the motion of the phantom, and images were acquired over the most constant velocity interval of the motion. The velocity was adjusted by changing the throw arm of the Harvard pump, while maintaining the same cycle frequency (1 Hz).
The approach to steady state of the moving sample was measured for GRASS and SPGR (TR = 7.3 ms, TE = 2.7 ms, α = 20°). The slice selection gradient was disabled to prevent signal enhancement from “wash-in” effects. The phase encoding gradient was disabled and data was collected for 64 repetitions. Signal was calculated in the same manner as described in the Tag Contrast Experiments section.
The velocity was measured from a CINE sequence of 16 images collected 29 ms apart with four phase encoding steps/cine frame (TR = 7.3 ms, TE = 2.7 ms). As well, the velocity was calculated kom an analytical description of the motion available from the piston geometry of the Pump.
Simulations
Tag Contrast Simulations
A Bloch equation simulation program was written to calculate the transient behavior of the magnetization for GRASS and SPGR. It characterized the signal intensity from each repetition during the approach to steady state for magnetization vectors with and without tagging pulses. Tagging pulses were simulated as simple, nonselective inversion pulses. From this information, the contrast between tags and tissue could be calculated for various imaging tip angles and tag pulse tip angles.
Longitudinal magnetization recovery between R-R intervals was modeled to account for incomplete T1 recovery during the dead time before the next R-R interval. The simulations assumed that the phase encoding was properly rewound and that the magnetization was defocused with a 2π phase shift across a pixel at the completion of the readout gradient. All slice selection pulses of the sequence (asymmetrical sinc with apodizing Hamming window and trapezoidal gradient) were simulated to generate the actual slice profile. The RF phase spoiling method (7) used in this pulse sequence was accounted for in the SPGR simulations.
Velocity Simulations
The above simulations were adapted to account for velocity by using the following equation, describing the position of the sample in the magnet, as a function of time:
where f is the cycle frequency in Hz, t is time in seconds, r is the adjustable throw arm length of the Harvard pump in cm, and l is the length of the rigid arm of the Harvard pump (20.2 cm).
RESULTS
Tag Contrast
Approaches to steady state for both preinverted and noninverted magnetization are shown in Fig. 3 for GRASS, and Fig. 4 for SPGR, along with Bloch equation simulations. These figures are plots of the signal magnitude, showing the nonmonotonic trajectory of the inverted magnetization signal. There is excellent agreement between experimental data and computer simulations, demonstrating the accuracy of the Bloch equation calculations.
FIG. 3.
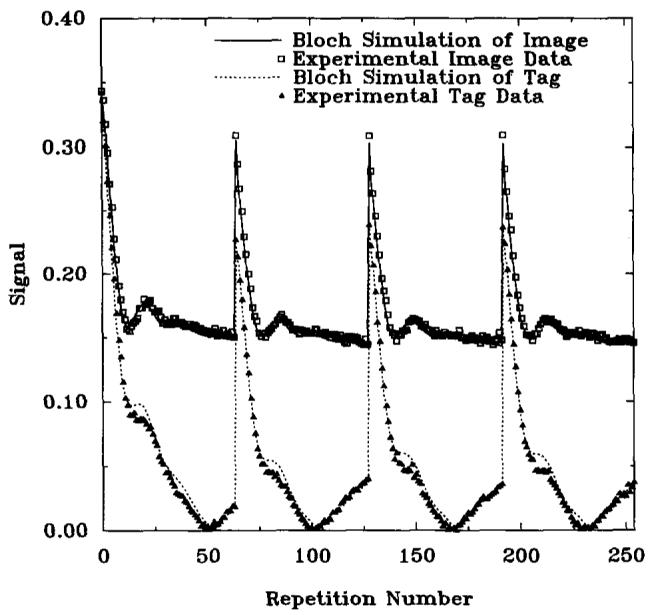
Approach to steady-state with GRASS sequence over 4 R-R intervals (1200 ms each). Recovery times during which no RF pulses were played (733 ms) are not shown in the graphs. Magnitude plots of simulation results (lines) and experimental data (points) with and without a 180° preinversion pulse are shown. TR = 7.3 ms, TE = 2.7 ms, α = 20°, slice thickness = 1 cm.
FIG. 4.
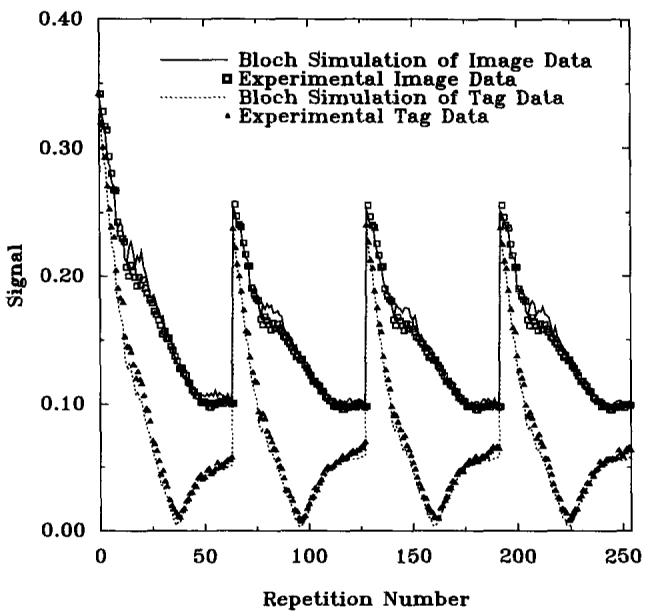
Approach to steady-state with SPGR sequence over 4 R-R intervals (1200 ms each). Magnitude plots of simulation results (lines) and experimental data (points) with and without a 180° preinversion pulse are shown. TR = 7.3 ms, TE = 2.7 ms, α = 20°, slice thickness = 1 cm.
The signal difference between image and tag (180°) for the last phase of the cine animation is shown in Fig. 5, as a function of imaging tip angle. In the last cine frame, it was found that 180° tags yielded maximum contrast at all imaging tip angles, for both GRASS and SPGR. The last cine frame was chosen, because the signal difference between tissue and tags is lowest in this frame.
FIG. 5.
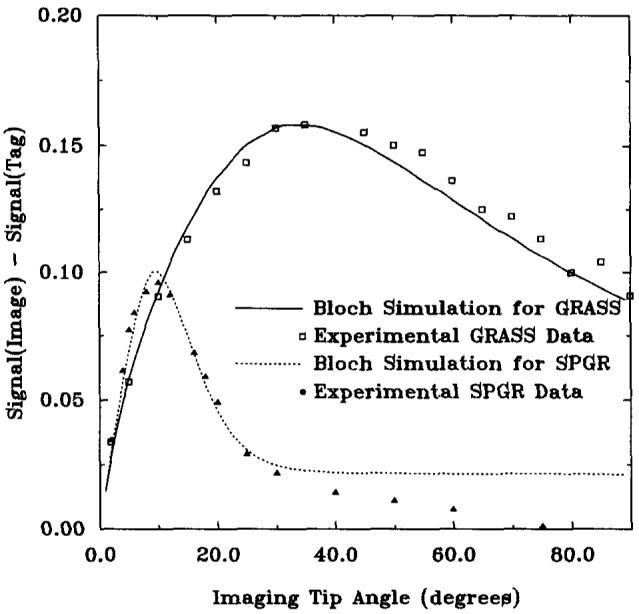
Contrast versus imaging tip angle for GRASS and SPGR sequences for the last cine frame. Simulated and experimental data are shown for a 180° tagging pulse. TR = 6.5 ms, TE = 2.4 ms, slice thickness = 1 cm.
For the last image of the CINE acquisition, the maximum contrast for GRASS occurs at an imaging tip angle of 35°, and at 11° for SPGR. The GRASS contrast was approximately 1.5 times greater than that of SPGR, and the peak was much broader. In-plane myocardial motion greatly affected the GRASS signal, however, as is shown in the Effect of Motion section.
First Heartbeat Artifacts
The transition to steady state of the signal is highly reproducible after the first heartbeat (Figs. 3 and 4). Inclusion of data from the first heartbeat in the image reconstruction algorithm produces ghost artifacts. Figure 6 shows SPGR images acquired with and without the data collected during the first R-R interval.
FIG. 6.
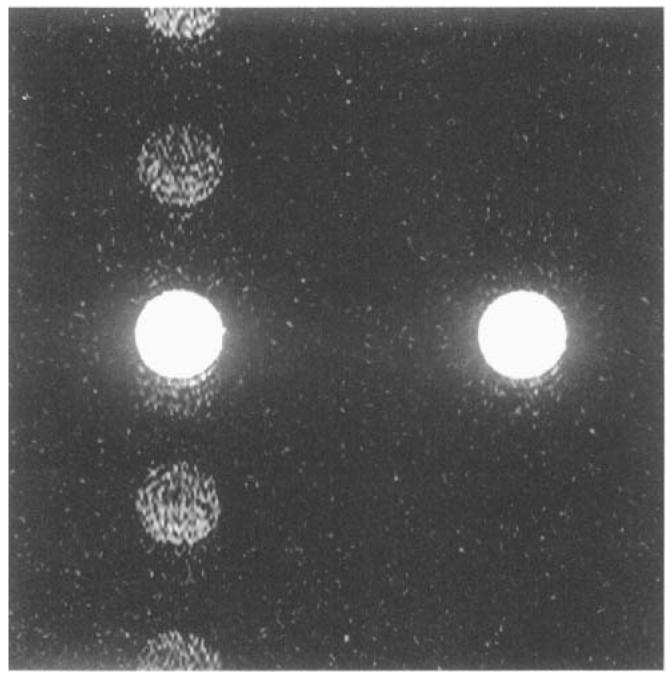
256 × 128 SPGR image of the agarose phantom, with 32 phase encoding steps/heartbeat over 4 R-R intervals (left). Ghost artifacts are seen in the phase encoding direction. The same image is shown on the right, except that five R-R intervals of data were collected. Data from the first interval were ignored in the image reconstruction, eliminating ghost artifacts from this image. Field of view (FOV) = 20 cm, slice = 5 mm, BW = ±32 kHz, TR = 7.4 ms, TE = 3.0 ms, and α = 45°.
Effect of Motion
Figure 7 shows the approach to steady state for GRASS in stationary and moving phantoms. Also shown in this figure is the approach to steady state for SPGR at zero velocity. It is clear that the GRASS pulse sequence is producing a response very similar to SPGR in the moving sample. Simulations showed that velocities as low as 6 to 7 mm/s resulted in GRASS steady-state signals comparable with SPGR. The same experiments were repeated for SPGR, and it was found that motion had little effect on the SPGR signal as shown in Fig. 8.
FIG. 7.
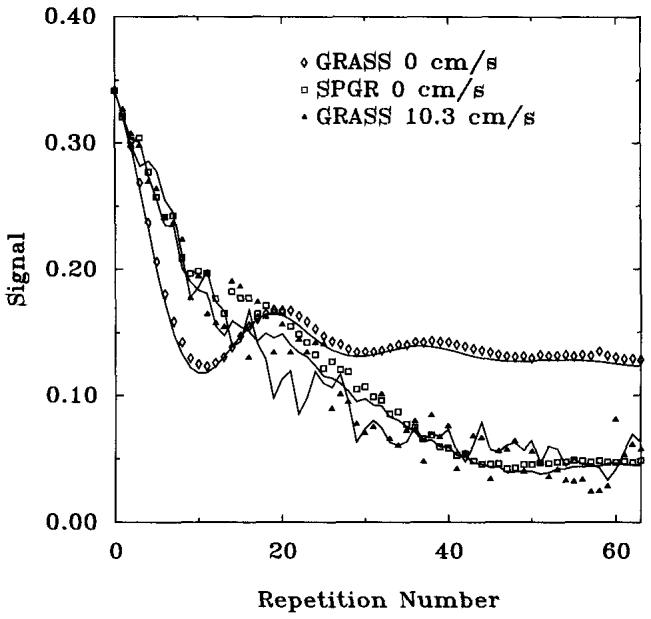
Approach to steady-state for GRASS in a sample with velocity = 0, 10.3 cm/s, and SPGR with velocity = 0 cm/s. TR = 7.3 ms, TE = 2.7 ms, α = 20°, nonselective RF pulses. The lines are Bloch equation calculations, and the points are experimental data.
FIG. 8.
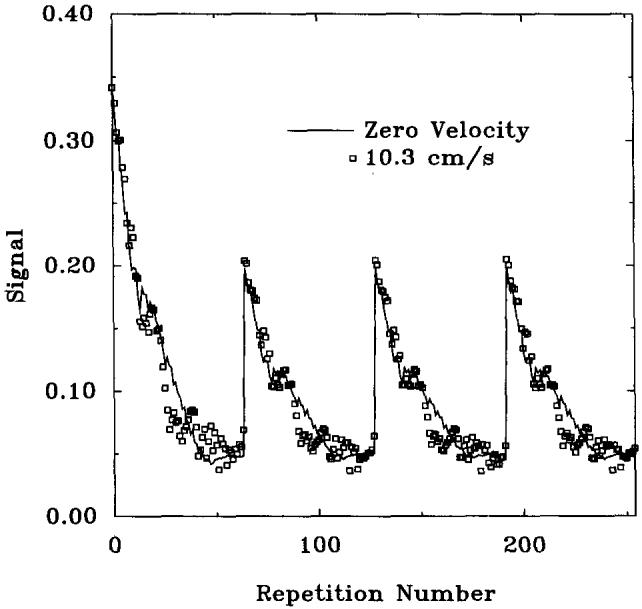
Experimental approach to steady-state with SPGR at velocity = 0, 10.3 cm/s. TR = 7.3 ms, TE = 2.7 ms, α = 20°, nonselective RF pulses.
DISCUSSION
Tag Contrast
As seen in Figs. 3 and 4, the transient response of the magnetization is highly reproducible after the first R-R interval. The data collected during the first R-R interval, however, has a higher signal amplitude. This has important ramifications for image reconstruction because ghost artifacts will appear as a result of amplitude modulation of the signal in the phase direction. Exclusion of the data collected during the first heartbeat is a simplistic solution that significantly reduces ghosting artifacts during a fast gradient echo cardiac imaging sequence, as evidenced in Fig. 6. More sophisticated postprocessing techniques that attenuate the signal amplitude from the first heartbeat would alleviate this problem without the need to collect a “dummy” heartbeat.
In the stationary sample the tag-tissue contrast is greater for GRASS than SPGR. The contrast also remains high over a broader range of imaging tip angles for GRASS. Myocardial motion, however, introduces velocity spoiling in GRASS sequences (13), causing the GRASS transient behavior to approximate that of SPGR, especially near steady state. Although the steady-state signals are similar, the transition of SPGR toward steady state is much smoother than GRASS in the moving phantom.
These measurements suggest that spoiled gradient echo imaging techniques should be used to capture motion of the heart with velocities greater than 6 to 7 mm/s. There is little difference in the steady-state signal between GRASS and SPGR for moving objects, but the smoother transition to steady state of SPGR makes this the preferred imaging technique. It is important to optimize the imaging tip angle for SPGR because the maximum contrast to noise ratio (CNR) occurs on a sharp peak. For T1 values expected in the heart and TR = 7–10 ms, the imaging tip angle should be on the order of 10–15°, to maximize CNR, based on simulation and experimental results.
In addition, SPGR does not require a rewinding lobe, as is the case for GRASS. Removal of this lobe reduces the TR of the sequence and increases the efficiency (6), increasing SNR for a constant scan time, as well as improving time resolution for capturing physiologic processes.
ACKNOWLEDGMENTS
The authors thank Ergin Atalar for assistance with the segmented k-space pulse sequence.
This research was supported by the National Institutes of Health grants HL45683 and HL45090.; S.B. Reeder is supported with a Whitaker Foundation Graduate Fellowship in Biomedical Engineering.
REFERENCES
- 1.Zerhouni EA, Parish DM, Rogers WJ, Yang A, Shapiro EP. Human heart: tagging with MR imaging-a method for noninvasive assessment of myocardial motion. Radiology. 1988;169:59. doi: 10.1148/radiology.169.1.3420283. [DOI] [PubMed] [Google Scholar]
- 2.Axel L, Dougherty L. MR imaging of motion with spatial modulation of magnetization. Radiology. 1989;171:841–849. doi: 10.1148/radiology.171.3.2717762. [DOI] [PubMed] [Google Scholar]
- 3.McVeigh ER, Zerhouni EA. Noninvasiv measurement of transmural gradients in myocardial strain with MR imaging. Radiology. 1991;180:677–683. doi: 10.1148/radiology.180.3.1871278. [DOI] [PMC free article] [PubMed] [Google Scholar]
- 4.Moore CC, O'Dell WG, McVeigh ER, Zerhouni EA. Calculation of three-dimensional left ventricular strains from beplanar tagged MR images. J. Magn. Reson. Imaging. 1992;2:165–175. doi: 10.1002/jmri.1880020209. [DOI] [PMC free article] [PubMed] [Google Scholar]
- 5.McVeigh ER, Atalar E. Cardiac tagging with breath hold CINE MRI. Magn. Reson. Med. 1992;28:318–327. doi: 10.1002/mrm.1910280214. [DOI] [PMC free article] [PubMed] [Google Scholar]
- 6.McVeigh ER, Atalar E. The Physics of MRI. American Association of Physicists in Medicine; New York: 1993. Balancing contrast, resolution and signal-to-noise ratio. [Google Scholar]
- 7.Crawley AP, Wood ML, Henkelman RM. Elimination of transverse coherences in FLASH MRI. Magn. Reson. Med. 1988;8:248–260. doi: 10.1002/mrm.1910080303. [DOI] [PubMed] [Google Scholar]
- 8.Mosher TJ, Smith MB. A DANTE tagging sequence for the evaluation of translational sample motion. J. Magn. Reson. 1990;15:334–339. doi: 10.1002/mrm.1910150215. [DOI] [PubMed] [Google Scholar]
- 9.Atkinson DJ, Edelman RR. Cineangiography of the heart in a single breath hold with a segmented turboflash sequence. Radiology. 1991;178:357–360. doi: 10.1148/radiology.178.2.1987592. [DOI] [PubMed] [Google Scholar]
- 10.Wolf GL. Contrast agents for MRI. In: Marcus ML, editor. Cardiac Imaging. Saunders; Philadelphia: 1991. p. 799. [Google Scholar]
- 11.Hendelman RM. Measurement of signal intensities in the presence of noise in MR images. Med. Phys. 1985;12:232–233. doi: 10.1118/1.595711. [DOI] [PubMed] [Google Scholar]
- 12.Moore CC, Reeder SB, McVeigh ER. Photographic validation of tagged MRI in a deforming phantom. Radiology. doi: 10.1148/radiology.190.3.8115625. in press. [DOI] [PMC free article] [PubMed] [Google Scholar]
- 13.Henkelman RM, McVeigh ER, Crawley AP, Kucharczyk W. Very slow in-plane flow with gradient echo imaging. Magn. Reson. Imaging. 1989;7:383–393. doi: 10.1016/0730-725x(89)90487-6. [DOI] [PubMed] [Google Scholar]


