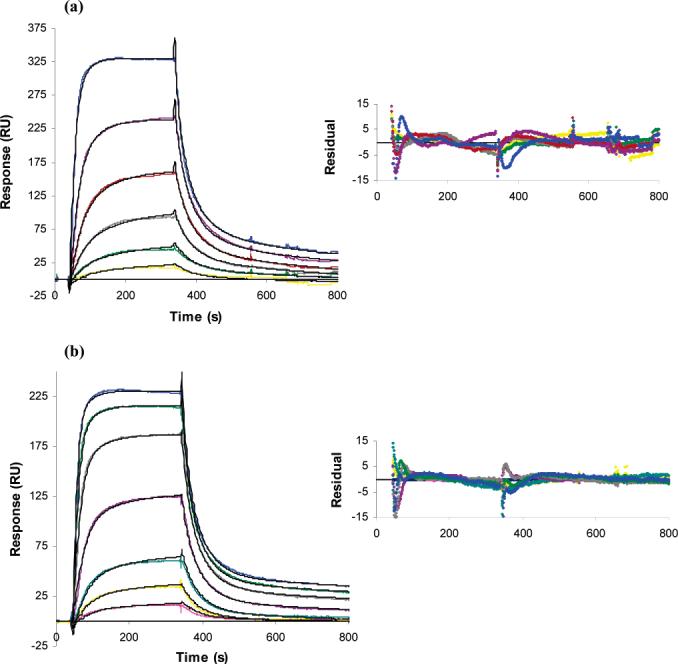
FIGURE 6.

Kinetic analysis of the interaction between InlB and heparin. (a) Independent sets of curves were globally fit to a model for two binding sites, or heterogeneous ligand. InlB solution concentrations were 0.313, 0.625, 1.25, 2.5, 5, 10, 15, and 20 nM. (b) Kinetic analysis of the interaction between InlB-ΔBΔGW1 and heparin. One representative set of fitted curves is shown using solution concentrations of 0.78, 1.56, 3.13, 6.25, 12.5, 18.8, 25, 32.2, and 50 nM.
