Abstract
To date there is no imaging modality for cardiac arrhythmias which remain the leading cause of sudden death in the United States (> 300 000/yr.). Electrocardiographic imaging (ECGI), a noninvasive modality that images cardiac arrhythmias from body surface potentials, requires the geometrical relationship between the heart surface and the positions of body surface ECG electrodes. A photographic method was validated in a mannequin and used to determine the three-dimensional coordinates of body surface ECG electrodes to within 1 mm of their actual positions. Since fluoroscopy is available in the cardiac electrophysiology (EP) laboratory where diagnosis and treatment of cardiac arrhythmias is conducted, a fluoroscopic method to determine the heart surface geometry was developed based on projective geometry, epipolar geometry, point reconstruction, b-spline interpolation and visualization. Fluoroscopy-reconstructed hearts in a phantom and a human subject were validated using high-resolution computed tomography (CT) imaging. The mean absolute distance error for the fluoroscopy-reconstructed heart relative to the CT heart was 4 mm (phantom) and 10 mm (human). In the human, ECGI images of normal cardiac electrical activity on the fluoroscopy-reconstructed heart showed close correlation with those obtained on the CT heart. Results demonstrate the feasibility of this approach for clinical noninvasive imaging of cardiac arrhythmias in the interventional EP laboratory.
Index Terms: Cardiac arrhythmias, cardiac electrophysiology, cardiac imaging, cardiac mapping, electrocardiographic imaging, epipolar geometry, fluoroscopy, heart modeling
I. Introduction
Cardiac arrhythmias remain the leading cause of death and disability with over 300 000 annual cases of sudden death in the United States alone.1 Despite this fact, a noninvasive imaging modality for cardiac electrical function and arrhythmias does not yet exist in clinical practice. Standard electrocardiographic techniques infer information about the cardiac electrical activity from electrocardiograms (ECGs) measured on the body surface, far away from the heart. These methods are very limited in their ability to detect and localize electrophysiological processes in the heart (e.g., arrhythmogenic foci or regions with abnormal electrophysiological properties). With advances in electronics and computers, it has become practical to record ECG potentials from many sites on the body surface simultaneously [1], [2]. The resulting body surface potential maps (BSPM), while containing more information than the standard ECG, provide a very low-resolution projection of cardiac electrical events due to the smoothing effect of the torso volume conductor [3]. Moreover, each body surface ECG reflects the electrical activity in the entire heart [4], so that geometrical relationships and locations of cardiac events are not preserved in the BSPM. In contrast, measurements made directly on the heart surface provide a high-resolution image with accurate localization of the underlying cardiac electrophysiological processes in normal and pathophysiological states [5], [6]. It is therefore crucial to image cardiac electrical activity on the heart surface for the purpose of electrophysiological diagnosis and guidance of arrhythmia therapy.
A noninvasive imaging modality, electrocardiographic imaging (ECGI) [3], [7]–[10], that images cardiac electrical activity on the heart surface from body surface potential measurements has been under development in our laboratory. To date we have demonstrated in a human shaped torso-tank experimental setup the ability of ECGI to 1) reconstruct epicardial potentials during normal sinus rhythm [7], 2) reconstruct epicardial potentials, electrograms and activation sequences (isochrones) during single and dual site pacing and locate the pacing sites (representing ectopic arrhythmogenic foci) with high accuracy [8], [9], 3) localize and characterize abnormal electrophysiological substrates associated with myocardial infarction [11], [12], 4) map reentrant arrhythmias [12], [13], and 5) characterize regions with repolarization heterogeneities [14], [15].
In order to apply ECGI, the geometrical relationship between the heart surface and the positions of the recording body surface ECG electrodes is required, in addition to the recorded body surface potentials. More specifically, an epicardial envelope [8] containing the heart forms the surface on which cardiac electrical activity is imaged using ECGI. In the clinical environment, the geometrical information can be acquired using standard imaging modalities such as computed tomography (CT) or magnetic resonance imaging. However, it is highly desirable to develop a fluoroscopy-based method for ECGI because fluoroscopy is available in the cardiac electrophysiology (EP) laboratory where EP diagnostic procedures and interventions for arrhythmia management are conducted. This paper addresses the problem of acquiring the geometrical information necessary for application of ECGI in humans. It describes 1) a fluoroscopy-based method to reconstruct an epicardial envelope around the heart surface and 2) a photography-based method to localize the three-dimensional (3-D) coordinates of body surface ECG electrodes. Results are validated in phantom and human studies through comparison with CT images. We also conduct an initial evaluation of this approach in the context of ECGI, by comparing potentials imaged on the fluoroscopy-reconstructed envelope to potentials imaged on the CT-reconstructed epicardium.
II. Methods
A. Theoretical Approach
1) Pinhole Model
A camera or an X-ray system can be described by the basic pinhole model [16] that represents central projection, a mapping from a 3-D scene onto a two-dimensional (2-D) image (Fig. 1). Let the center of projection (the focal point, e.g., camera center or X-ray source) be the origin o of a Euclidean coordinate system and the image plane that at z = d, then under the pinhole model, the image of an object point m(x, y, z) is formed by the intersection of a ray drawn from the center through m and the image plane (Fig. 1). Using similar triangles, the point m(x, y, z) is mapped to the image point q(xd/z, yd/z) on the image plane. Using homogeneous coordinates, central projection can be described by a linear matrix multiplication equation
Fig. 1.
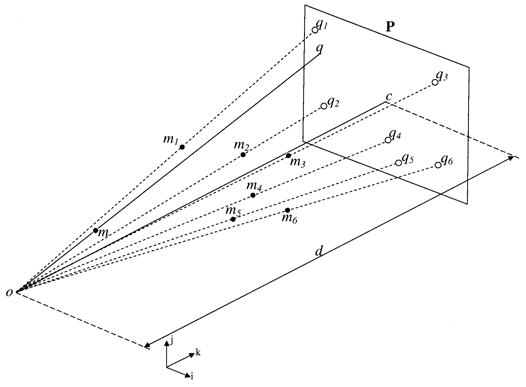
The pinhole model. The camera or X-ray source forms the center of projection and the image plane is at z = d. The point q on the image plane represents the projection of the object point m (i, j, and k represent unit vectors in the x, y, and z directions).
| (1) |
where q = (u, v, 1)T represents the homogeneous coordinates vector of the image point q, m = (x, y, z, 1)T the homogeneous coordinates vector of the object point m, s the scaling factor, and P the 3 × 4 projection matrix describing the perspective projection.
The ray from the center of projection to the image plane is called the principal axis (line oc in Fig. 1), and the image of the center of projection on the image plane is called the principal point (point c in Fig. 1).
2) Single View Calibration
Equation (1) represents a simplistic expression of the projection matrix under central projection. However, in a real world application, the camera or X-ray source coordinate system is not aligned with the 3-D scene coordinate system and the image points are not referenced to the principal point. Therefore, the projection matrix is represented in the general form P = KR [I| − t] and (1) becomes
| (2) |
In (2), K is a matrix that represents the internal parameters of the camera (focal length and principal point coordinates), R and t represent the external parameters (rotation and translation between the 3-D scene and camera coordinate systems).
In single-view calibration techniques [17], the objective is to determine the projection matrix P given a set of points in the scene with known 3-D coordinates (mi, Fig. 1) and their corresponding 2-D image points (qi, Fig. 1). For each point in the scene, mi, and its image point qi (2) provides
| (3) |
Expanding (3) and using homogeneous coordinates we obtain
| (4) |
Performing the matrix multiplication and substituting for s we obtain
| (5) |
The above linear system of two equations with 12 unknowns (p11, p12 … p34) is obtained for each object point and its corresponding image. Stacking the system of equations for six or more points in the scene and with some matrix manipulation, the problem can be expressed in matrix form as shown in (6) at the bottom of the next page.
The projection vector (p11, p12, p13 … p34)T and consequently the projection matrix P is obtained by determining the eigenvalue decomposition of the matrix BTB and selecting the eigenvector associated with the minimum eigenvalue as the solution. Note that homogeneous equations of the form Ax = 0 are generally solved using the least squares technique to minimize ||Ax|| subject to ||x|| = 1. It is shown that the solution x is the eigenvector corresponding to the smallest eigenvalue of the matrix ATA [17]. In order to minimize the effect of noise, the coordinates of the image and scene points are normalized [17] (referenced to their centroid and isotropically scaled by the maximum coordinate) prior to single view calibration.
3) Epipolar Geometry
In many instances, the scene is imaged from two views simultaneously (stereovision or biplane fluoroscopy) or sequentially (a moving camera around the scene). The geometry relating two views is described by the epipolar constraint [18]. It is independent of the scene and depends only on the camera intrinsic parameters and relative relationship between the two views. Fig. 2 represents the epipolar geometry of two views described by projection matrices P1 and P2, respectively. The image points q1 and q2 on I1 and I2, respectively, are termed corresponding image points as they represent the images of the same object point m in the scene. These points are constrained by the epipolar geometry; given an image point in I1, it defines an epipolar line in I2 on which the corresponding image point must lie. All epipolar lines in I2 intersect at the epipole (e21, Fig. 2); the image of the camera center or X-ray source for the first view (f1, Fig. 2) on I2. Similarly, all epipolar lines in I1 intersect at the epipole (not shown); the image of the camera center or X-ray source for the second view (f2, Fig. 2) on I1.
Fig. 2.
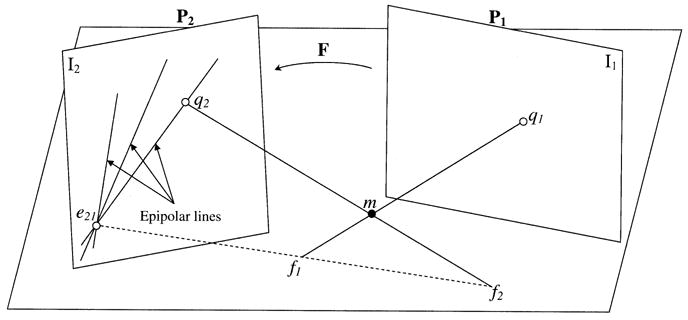
Epipolar geometry of two views. The corresponding image points q1 and q2 of the object point m are in the plane (m, f1, f2). The intersections of the plane (m, f1, f2) with the image planes form the epipolar lines on which q1 and q2 lie.
Analytically, the epipolar geometry is represented by F, a 3 × 3 matrix called the fundamental matrix, that relates the homogeneous coordinates of corresponding image points in two views
| (6) |
| (7) |
The fundamental matrix F can be determined from a set of corresponding image points, without prior knowledge of the scene or the projection matrices [19]. Conversely, if the projection matrices for the first and second views are known, F can be derived from these matrices and the epipole in the second view (taking the coordinate system for the first view as reference) [20]
| (8) |
where P1 is the projection matrix for the first view, the pseudoinverse of the projection matrix for the second view and [e21]x the skew matrix formed from the epipole in the second image. The homogeneous coordinates of the epipole e21 are determined from e21 = P2f1, where f1 is determined by solving P1f1 = 0 (f1 is the eigenvector corresponding to the smallest eigenvalue of ).
4) Point Reconstruction From Two Views
Given the Euclidean calibrated projection matrices P1 and P2 for the first and second views, respectively, the homogeneous coordinates m = (x, y, z, t)T of a point m in the scene can be recovered from a pair of corresponding image points q1 = (u1, v1 1)T and q2 = (u2, v2 1)T by triangulation [21]. The following relationships hold for the first and second views:
| (9) |
| (10) |
Substituting for s1 and s2 and combining (9) and (10) for a pair of corresponding image points, we obtain the system
| (11) |
where p1, p2, and p3 represent the first, second, and third rows of the projection matrix , and represent the first, second, and third rows of the projection matrix P2. The homogeneous coordinates m = (x, y, z, t)T are determined by the eigenvector corresponding to the smallest eigenvalue of the matrix DTD in (11). The 3-D Euclidean coordinates (x/t, y/t, z/t) of the point m are then obtained.
B. Fluoroscopy-Based Approach for Determining Heart Geometry
In this section, we describe an algorithm to reconstruct the heart surface geometry from two or more biplane fluoroscopic projections. The algorithm combines principles from projective geometry, epipolar geometry, point reconstruction, surface interpolation and 3-D visualization. Note that distortion correction is not implemented on the acquired fluoroscopic images. The flowchart for the algorithm is shown in Fig. 3. The different steps are described below.
Fig. 3.
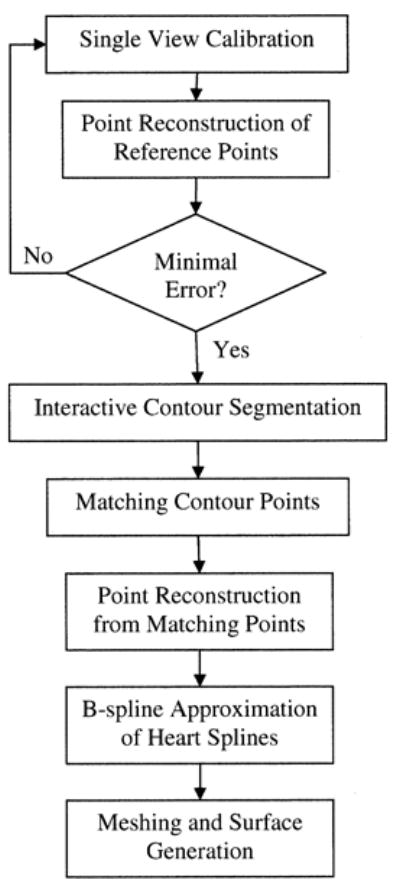
Flowchart of the fluoroscopy-based algorithm for reconstructing the heart-surface (envelope).
1) Single-View Calibration
A V-shaped calibration object containing twenty lead markers and a planar board containing more than fifty lead markers are used for calibration. The calibration object and the board are made of acrylic material in order to render them X-ray transparent. Using a V-shaped calibration object ensures that at least five noncoplanar lead markers can be seen in anterior, lateral and oblique views. This is a necessary condition for performing single view calibration [16]. During fluoroscopy the planar board is placed under the mattress below the subject’s back, while the calibration object is supported above the subject’s torso (the subject is lying in the supine position). Biplane fluoroscopy (Hicor Bicor, Siemens, 30 frames/s) is acquired. Care is taken to make sure that sufficient number of lead markers (more than 6) appear in each view. Both views need not reveal the same markers. The coordinates of the lead markers from the scene are acquired using a 3-D digitizing mechanical arm (Microscribe G2L, Immersion Corporation). The image coordinates of the markers in the fluoroscopic projections are digitized offline on a computer. Knowing the image coordinates of the lead markers and their corresponding 3-D coordinates in the scene, we perform single view calibration to obtain the projection matrix for each view. Once the projection matrices are obtained, the location of the lead markers observed in both views are reconstructed back in the scene using point reconstruction (11). If the reconstructed lead markers (reference points) were within 5 mm of their actual digitized 3-D coordinates, then the calibration is considered correct, otherwise single view calibration is repeated. This constitutes a self-test for the calibration process.
2) Heart Contour Segmentation
Multiframe animated images from biplane fluoroscopic projections are displayed for each view. The user identifies the outer boundary of the beating heart and delineates the contour interactively on a single frame. Since the objective of ECGI is to image cardiac electrical activity on an envelope around the heart, it suffices to take the outermost contour.
3) Matching Corresponding Contour Points
The fundamental matrix F relating both views is derived from the projection matrices P1, P2 and the epipole e21 (8). In the first view, each point q1 = (u1, v1 1)T (yellow circle, Fig. 4, view 1) on the heart contour defines an epipolar line in the second view determined by l2 = Fq1. The intersection of the epipolar line l2 with the heart contour in the second image determines the corresponding (matching) contour point, q2 (white circle, Fig. 4, view 2). Similarly, q2 defines an epipolar line in the first view determined by l1 = FTq2. Consequently, a set of four matching contour points can be extracted from a pair of epipolar lines (Fig. 5). For frontier points (yellow diamond, Fig. 4) in the first view, the epipolar line in the second view is tangent to the heart contour and the user visually selects a corresponding point as the tangent point between the epipolar line and the heart contour.
Fig. 4.
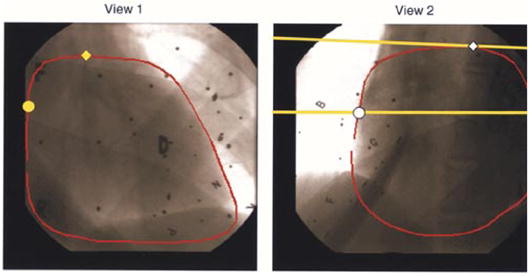
RAO 40° (view 1, left) and LAO 50° (view 2, right) views of acquired biplane fluoroscopic images. The heart contour (red) is delineated in each view. Yellow circle in RAO 40° represents a given point on the heart contour. Yellow line represents the corresponding epipolar line in LAO 50°. White circle represents the corresponding point. Yellow diamond in LAO 40° represents a frontier point whose corresponding point is shown as a white diamond in LAO 50°. Black dots and letters are images of the lead markers in the scene.
Fig. 5.
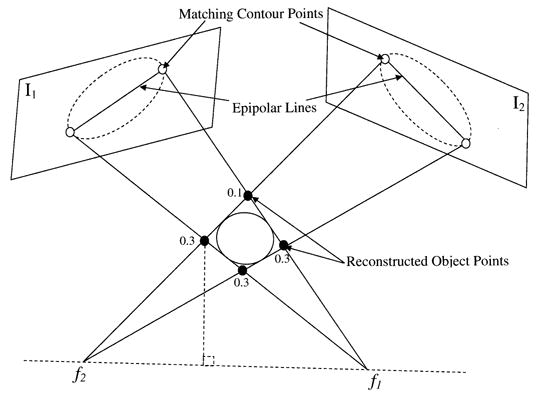
Given four matching contour points (white circles) from two biplane fluoroscopic images, four object points (black circles) are reconstructed using point reconstruction. Weights are assigned to the reconstructed points based on their distance from the line f1f2. A spline is then approximated using the weighted points. This process is repeated for all contour points resulting in a set of 3-D splines.
4) Point Reconstruction From Corresponding Points
For a pair of matching contour points, the 3-D coordinates of the object point are reconstructed according to (11). A total of four object points are reconstructed in space (Fig. 5). In the case of a pair of corresponding frontier points, a single object point is reconstructed.
5) B-Spline Approximation of Heart Splines
The coordinates of the focal point f1 for the first view are determined by solving the homogeneous equation P1f1 = 0. Similarly, the coordinates of the focal point f2 are determined. The distance of each of the reconstructed 3-D points from the line f1f2 (Fig. 5) is computed and the farthest point is assigned a 0.1 weight with the remaining three assigned 0.3. The weighted 3-D points (V0, V1, V2, V3) approximate a b-spline. This is performed as follows: 1) eight control vertices (V0, V1, V2, V3, V0, V1, V2, V3) are formed to generate a closed curve, 2) a quadratic spline is approximated from the control vertices using eleven knots (double knots at the end points enforce function continuity). The resulting spline, generated using the SPMAK function in MATLAB (Mathworks, Inc.), is tangent to the polygon lines joining (V0, V1, V2, V3).
Using the assigned weights, the point farthest from line f1f2 has the smallest effect on the shape of the spline whereas the three points closer to the line f1f2 have a greater influence. Using phantom studies we found that these empirically determined weights resulted in the most accurate approximations of the heart and confined the reconstructed splines within the torso. Other methods (not shown), using uniform weights or weights inversely proportional to the distance from the centroid of the four reconstructed points resulted in less accurate surface reconstructions.
6) Surface Generation and Visualization
Steps 3–5 are repeated for all contour points resulting in a set of 3-D splines. The 3-D convex hull of the splines is determined and a surface is meshed according to the following algorithm. The centroid of all splines (3-D points) is computed. All points are projected unto a unit sphere centered at the centroid. The convex hull of the points on the unit sphere is determined. The connectivity information returned by the convex hull is used to triangulate the original set of points resulting in a meshed and closed surface. In addition to simple meshing of 3-D points, interpolation or fitting of the given points to result in a smooth surface is also possible. The degree of discretization or smoothness of the reconstructed heart surface is controlled by interpolation or fitting. This is implemented by transforming the rectangular coordinates of the input points to spherical coordinates and interpolating or fitting a surface through the spherical points (Fig. 6). The fitting algorithm is based on a bicubic spline least squares fit. We used the NAG (NAG Ltd. Oxford, U.K.) foundation toolbox (functions E02DFF and E02DEF for bicubic spline fitting) to implement the algorithm in MATLAB. The algorithm is outlined as follows (Fig. 6).
Fig. 6.
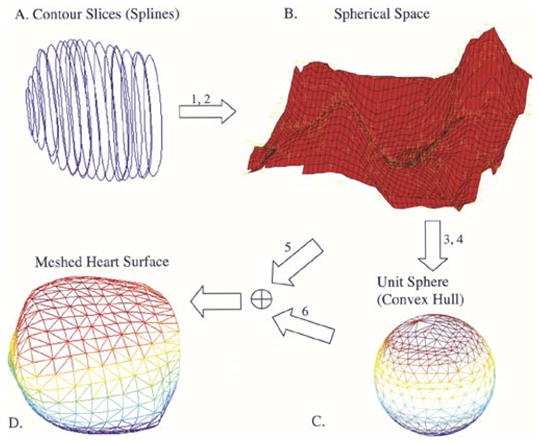
Meshing algorithm. (a) Three-dimensional reconstructed splines. (b) Surface is fitted or interpolated through the transformed spherical coordinates corresponding to the 3-D splines. (c) Convex hull of the projected points on the unit sphere returns the connectivity information for the mesh. (d) Meshed heart surface.
Given 3-D points compute corresponding spherical coordinates:
interpolate or fit spherical points;
project onto unit sphere;
compute convex hull on unit sphere;
compute corresponding cartesian coordinates of interpolated or fitted spherical points;
use connectivity information (from 4) and points (from 5) to mesh the 3-D surface.
Once the surface is meshed we use MATLAB visualization commands to render the meshed surface in three dimensions. The triangulated surface elements are also used in the boundary element formulation [22] for ECGI.
7) Algorithm to Determine Body Surface ECG Electrode Positions
An algorithm to determine body-surface ECG electrode positions from stereo photographs has been developed. It is based on point reconstruction techniques. The calibration object (see Single View Calibration) is placed in the scene and two photographs are acquired sequentially using a digital camera (SONY DSC-S85). The absolute position of the camera or the relative relationship between the two sequentially acquired digital photographs is not required. The 3-D coordinates of the scene points (lead markers on the calibration object) are digitized (Microscribe G2L) in addition to four or more points on the torso. Single view calibration is performed to obtain the projection matrices for each photograph. The electrodes in each photograph are identified. Corresponding electrodes in a pair of photographs are matched by inspection and their corresponding 3-D coordinates are determined using point reconstruction.
C. Validation in a Phantom Study
1) Reconstruction of Heart Geometry
The fluoroscopy-based algorithm for determining heart surface geometry was validated using a realistic plastic heart model. The phantom heart was imaged using biplane fluoroscopy at various dual angles: anterior posterior (AP) 0°, left anterior oblique (LAO) 70°; right anterior oblique (RAO) 10°, LAO 70°; RAO 20°, LAO 70°; RAO 30°, LAO 60°; RAO 40°, LAO 50°; RAO 50°, LAO 40°. The heart surface was reconstructed from each pair of biplane angles. The phantom heart geometry was also acquired using an ultra fast spiral CT scanner (Philips Mx8000) at a sampling interval of 3.2 mm and a pitch of 0.5. The heart contour in each CT slice was segmented using deformable model segmentation [23]. The segmented cross sectional contours were then meshed to generate the CT heart. Four lead markers were affixed on the plastic heart model. The 3-D coordinates of the four lead markers were digitized during fluoroscopy using the Microscribe G2L digitizer. Also, the 3-D coordinates of the same markers were segmented from the CT slices. The four markers were then used to register the fluoroscopy reconstructed heart with the CT heart.
2) Three–Dimensional Localization of Body Surface ECG Electrode Positions
Accurate localization of the recording electrodes on the body surface is crucial for successful application of ECGI. A mannequin with ninety two visible markers (simulating actual electrodes) on the anterior surface was used for this study (see Fig. 10). The V-shaped calibration object was placed over the mannequin. Eight markers on the calibration object and six markers on the mannequin were digitized using a mechanical digitizer (Microscribe G2L) and used for single view calibration of each picture in stereo photographs. A total of three pairs of stereoscopic photographs were taken with a digital camera. Taken in pairs, the photographs were calibrated and the 3-D coordinates of corresponding markers were determined using point reconstruction. These were compared with the actual coordinates digitized using the mechanical digitizer (Microscribe G2L).
Fig. 10.
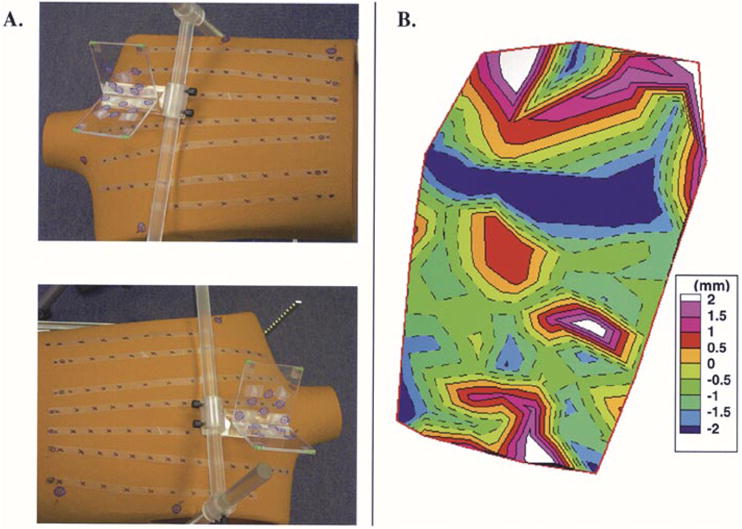
Localization of body surface ECG electrode positions using photography. (a) Stereo photographs of the mannequin with the calibration object (transparent structure) in view. (b) Signed distance error map for reconstructed electrode locations relative to actual measured (digitized) locations.
D. Validation in a Human Study
The fluoroscopy -based algorithm for reconstructing the heart surface geometry was validated in a human subject. Written informed consent was obtained and the study was approved by the Investigational Review Board at University Hospitals, Cleve-land, OH. The subject’s heart was imaged using biplane fluoroscopy (RAO 40°, LAO 50°), while the marker board was situated under the subject’s back with the V-shaped calibration object supported over the chest (the subject was lying in the supine position). The lead markers in the scene were digitized (Microscribe G2L) and used to calibrate each fluoroscopic view separately. Because of the low quality of the fluoroscopic images, the manually segmented heart contour was enlarged by 10% to ensure that the reconstructed envelope surrounded the heart surface. The fluoroscopy-reconstructed heart was validated in comparison with the CT heart imaged using ECG-gated axial CT scanning at a resolution of 0.6 mm and a pitch of 1. Four lead markers were affixed on the subject’s chest. The 3-D coordinates of the four markers were digitized (Microscribe G2L) during fluoroscopy. Also, the 3-D coordinates of the same markers were segmented from the CT slices. Care was taken to ensure that during fluoroscopy and CT scanning the patient was imaged in the supine position and during breath hold to minimize motion artifact (due to the chest and diaphragm). The four markers were used to register the fluoroscopy reconstructed and CT hearts in the same reference frame.
E. Error Analysis
Signed (positive implies outside; negative implies inside) distance measure is used to quantify the differences between the fluoroscopy-reconstructed heart and the gold standard CT heart. The distance error is computed as follows:
For each node, Nr , on the fluoroscopy-reconstructed heart:
compute the 3-D Euclidean distance to each node on the gold standard CT heart;
select the minimum Euclidean distance as the error, Er , associated with node Nr ;
denote the nearest node to Nr on the gold standard CT heart by NNg ;
compute the dot product between the vector joining the centroid of the gold standard CT heart and NNg with the vector joining NNg and Nr ;
assign the sign of the dot product to the error measure, Er .
Mean, maximum, minimum, and standard deviation of the signed distance error are computed over the entire surface of the fluoroscopy-reconstructed heart.
F. Application of Fluoroscopy-Reconstructed Heart Geometry to Electrocardiographic Imaging in a Human Subject
Noninvasive ECGI was performed in a human subject during normal heart rhythm. We acquired body surface potentials from 224 ECG electrodes using a previously described mapping system and an electrode vest [24] [Fig. 7(c)]. Recorded ECGs were amplified and bandpass filtered between 0.5 and 500 Hz. The heart was imaged using CT [Fig. 7(a)] as well as biplane fluoroscopy [Fig. 7(b)]. The fluoroscopy-based algorithm was used to reconstruct an envelope around the subject’s heart. We also constructed the heart geometry from the CT slices. The locations of the body surface ECG electrodes were digitized using a 3-D mechanical digitizer (Microscribe G2L). Consequently, we formed two data sets describing the subject’s geometry: 1) CT-constructed heart with digitized body surface electrodes [Fig. 7(d)] and 2) Fluoroscopy-reconstructed heart envelope with digitized body surface electrodes [Fig. 7(e)]. Using the boundary element method, the transfer matrices relating epicardial (for CT) or heart envelope (for fluoroscopy) potentials to body surface potentials were derived [22]. The recorded body surface potentials were used to compute potentials on the CT-constructed epicardium [Fig. 7(f)] and the fluoroscopy-reconstructed envelope [Fig. 7(g)] during normal cardiac electrical activation, using ECGI methodology [10]. We compared the imaged potentials on these two surfaces to evaluate the accuracy of the ECGI/fluoroscopy approach relative to the gold standard ECGI/CT approach. ECGI methodology was extensively validated and published previously [7]–[15], [25]. Briefly, body surface potentials were related to heart surface potentials through Green’s second theorem. By discretizing the heart and body surfaces, we wrote
Fig. 7.
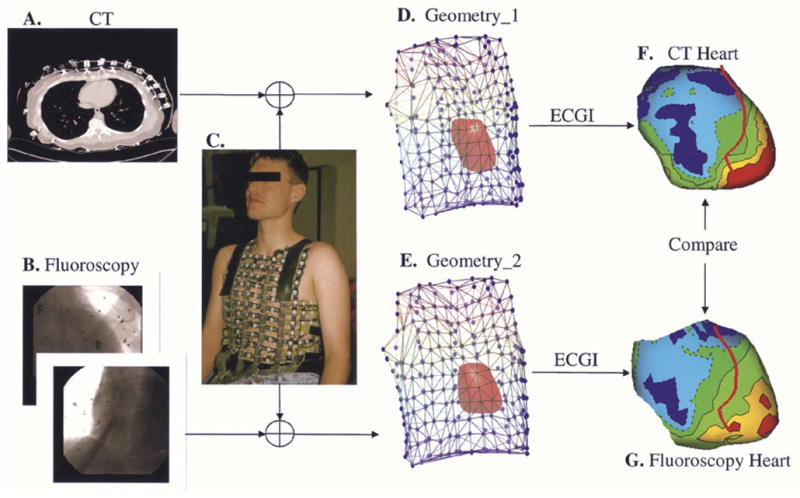
Evaluation of the fluoroscopy reconstructed heart in the context of ECGI. (a) CT image showing electrode locations and heart cross section. (b) Biplane fluoroscopic images. (c) Body surface vest for potential mapping. (d) Geometry data set derived from CT and body surface vest. (e) Geometry data set derived from fluoroscopy and body surface vest. (f) Example of imaged potentials on the CT constructed epicardium. (g) Example of imaged potentials on the fluoroscopy reconstructed heart envelope.
| (12) |
Where vT represented the vector of body surface potentials, vE the vector of heart surface potentials, and A the transfer matrix describing the geometrical relationship between the heart surface and positions of body surface ECG electrodes. Because of the ill posed nature of the problem Tikhonov regularization [26] was employed to minimize the following functional:
| (13) |
where λ represented the regularization parameter determined using the L-Curve [27] method.
III. Results
A. Validation of the Fluoroscopy-Reconstructed Heart Geometry – Phantom Study
Table I summarizes the results for the fluoroscopy-reconstructed phantom heart. For each pair of biplane angles, minimum, maximum, mean and standard deviation of the absolute distance errors relative to the CT heart are computed. In all cases, the mean distance error is approximately 4 mm. Fig. 8 shows results for selected biplane angles; AP, LAO 70° (left column); RAO 20°, LAO 70° (second column); and RAO 30°, LAO 60° (right column). The reference CT heart as segmented and constructed from the CT slices is shown in the top left column. The middle row shows the signed distance error maps for the fluoroscopy-reconstructed heart. Negative values indicate that the region of the fluoroscopy-reconstructed heart is interior to the CT heart and positive values indicate that it is exterior. The last row overlays the CT heart on the signed distance error map. In addition to biplane fluoroscopy, the algorithm for determining the heart geometry can be extended to multiple plane fluoroscopy. Fig. 9 shows the fluoroscopy-reconstructed heart from four views (AP, LAO 70° and RAO 30°, LAO 60°) in comparison to CT. Here, two sets of 3-D splines are reconstructed from each pair of biplane angles and the convex hull of all splines is obtained and meshed. Note that somewhat improved distance errors (mean decreased to 3.8 mm) are obtained suggesting that incorporation of four views can improve slightly the reconstructed heart geometry. Table I, last row summarizes the results for the four views case.
TABLE I.
Summary of Errors for Phantom Study
| Two Views (°) | Absolute Distance Error (mm) | ||||
|---|---|---|---|---|---|
| RAO | LAO | Mean | Min | Max | Standard Deviation |
| 0 | 70 | 4.00 | 0.26 | 15.00 | 2.47 |
| 10 | 70 | 4.06 | 0.16 | 14.89 | 2.37 |
| 20 | 70 | 4.68 | 0.14 | 15.81 | 2.90 |
| 30 | 60 | 4.44 | 0.17 | 15.46 | 2.82 |
| 40 | 50 | 4.78 | 0.16 | 15.92 | 3.76 |
| 50 | 40 | 4.07 | 0.06 | 12.52 | 2.51 |
|
| |||||
| Four Views (°) | |||||
| RAO 0, LAO 70; RAO 30, LAO 60 | 3.80 | 0.19 | 10.49 | 2.05 | |
Fig. 8.
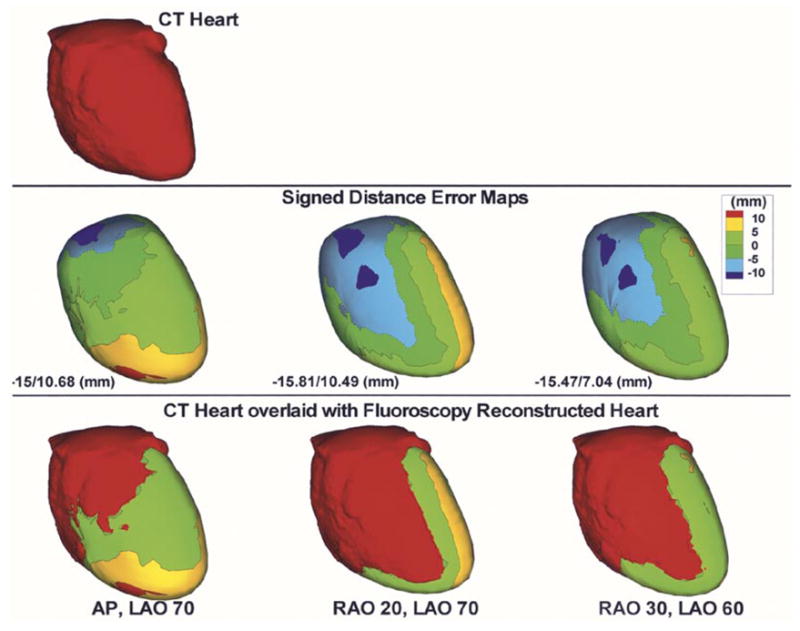
Reconstructed phantom heart from biplane fluoroscopic views. CT heart (top) is shown for reference. Signed distance error maps (middle row) are shown for AP, LAO 70° (left column); RAO 20°, LAO 70° (second column) and RAO 30°, LAO 60° (right column). Maximum negative and maximum positive distance error values are displayed for each case. CT heart overlaid with the distance error map is also shown (bottom row).
Fig. 9.
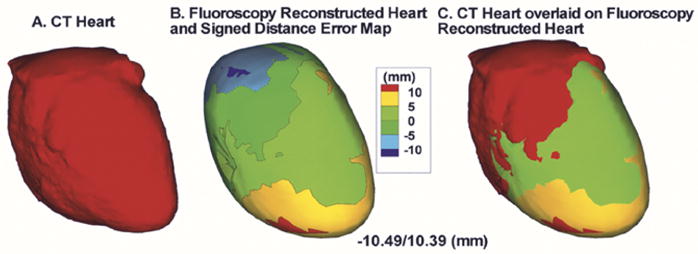
Reconstructed phantom heart from four fluoroscopic views. (a) CT heart. (b) Signed distance error map. Maximum negative and maximum positive distance errors are displayed. (c) CT heart overlaid with signed distance error map.
B. Validation of ECG Electrodes Localization – Phantom Study
In a phantom study, point reconstruction techniques were employed to reconstruct the electrode positions from stereo photographs [Fig. 10(a)]. The electrode markers (black “x” marks) affixed on the anterior surface of the mannequin were identified in each image and matched. We obtained the projection matrix for each photograph using single view camera calibration. The reconstructed electrode positions were compared with the actual digitized coordinates from the scene. Fig. 10(b) shows the signed distance error map for the reconstructed electrodes on the anterior surface of the mannequin. The mean absolute distance error was 1 mm.
C. Validation of Fluoroscopy-Reconstructed Heart Geometry – Human Study
Fig. 11, left column, shows the signed distance error map for the fluoroscopy-reconstructed epicardial envelope in a human subject. The CT heart (right column) was used as gold standard for comparison. Anterior (top row) and posterior (bottom row) views are shown. Positive values indicate that the fluoroscopy-reconstructed epicardial envelope is exterior to the CT heart surface, while negative values indicate that it is interior. The average absolute distance error is 10 mm. Inset shows the histogram of nodes on the fluoroscopy reconstructed epicardial envelope versus absolute distance (0, 5, 10, 15, and 20 mm) from the CT heart. Note that more than 70% of the nodes on the fluoroscopy reconstructed envelope are within 10-mm distance from the CT heart.
Fig. 11.
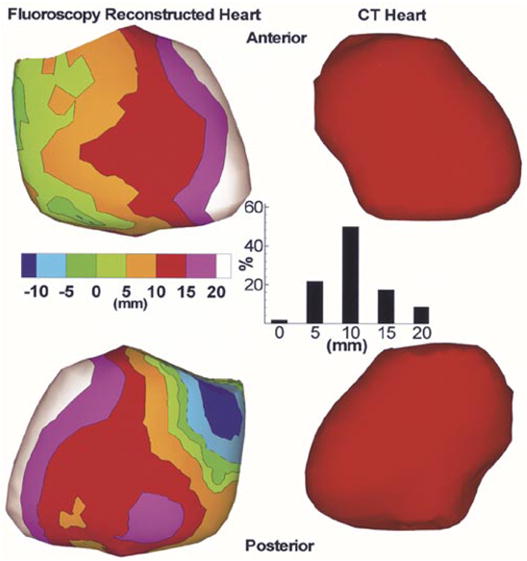
Left: Signed distance error maps for anterior (top) and posterior (bottom) views of a fluoroscopy reconstructed envelope in a human subject. The CT heart (right) is shown for reference. Inset shows the histogram of nodes on the fluoroscopy reconstructed envelope versus absolute distance (0, 5, 10, 15, and 20 mm) from the CT heart.
D. Noninvasive Imaging of Cardiac Electrical Activity in a Human Subject
We evaluate the fluoroscopy-based algorithm in the context of ECGI. Fig. 12 shows epicardial potentials imaged noninvasively using the fluoroscopy-reconstructed epicardial envelope (left image) and using the CT heart (right image) at 25 ms following the onset of ventricular excitation (QRS onset). Note the close similarity between the two potential maps. The potential minimum (dark blue) associated with right ventricular (RV) breakthrough (arrival of the activation front to the RV epicardial surface) [3] is reconstructed in both hearts, albeit with reduced amplitude on the fluoroscopy-reconstructed epicardial envelope. In addition, the overall potential patterns in both hearts reveal a global potential gradient from base to apex (negative potentials in green to positive potentials in red). The correlation coefficient (a measure of pattern similarity) between the potentials on the fluoroscopy reconstructed envelope and the nearest points on the CT heart is CC = 0.70.
Fig. 12.
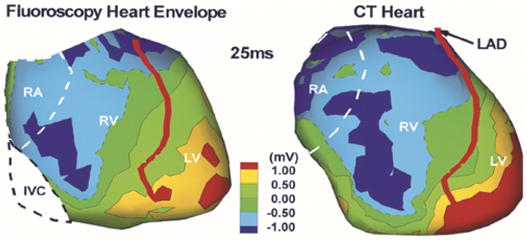
Noninvasively imaged epicardial potential map in a human subject using the fluoroscopy-reconstructed envelope (left) and CT heart (right). Image is obtained 25 ms after QRS onset. RA, right atrium; RV, right ventricle; LV, left ventricle; LAD, left anterior descending coronary artery.
IV. Discussion
The goal of this paper is to develop methods for determining subject specific geometry (heart geometry and body surface ECG electrode positions) for clinical application of ECGI in the EP laboratory, where procedures for diagnosis, treatment and monitoring of rhythm disorders of the heart are conducted. Fluoroscopy is readily available in the EP laboratory and is therefore the method of choice for determining heart surface geometry. Stereo photography is used to determine the positions of the body surface ECG electrodes.
A. Characteristics of the Fluoroscopy-Based Approach for Determining Heart Geometry
The method presented in this paper makes use of calibration objects (planar board and a V-shaped calibration object with affixed lead markers) to obtain the projection matrices describing each view in biplane fluoroscopy. Different from Hoffmann et al. [28], [29] where a calibration object is imaged following acquisition of biplane images in a patient, here both the patient and calibration objects are imaged simultaneously eliminating possible errors due to sequential imaging. While the methods of Chen et al. [30] and Hoffmann et al. [31] do not use a calibration object to obtain the imaging geometry relating the two views of a biplane sequence, they do require a priori knowledge of the imaging system parameters including the source-to-image intensifier distance, the distance between the two focal points and/or the distance between two 3-D points in the scene. Recently, a new method to reconstruct the location of known sparse objects from a single projection has been developed [32]. However, this method requires the use of an a priori model of the imaged object whose location and orientation are iteratively modified to align the viewing lines with the measured single projection. In contrast to other methods [28]–[32] that use an iterative nonlinear optimization technique to reconstruct 3-D points in space, the method presented in this paper is linear and involves simple numerical algorithms. Other methods that reconstruct the 3-D structure and shape of smooth objects from their occluding contours [33]–[36] require the acquisition of multiple images from a camera rotating around the object. Acquisition of such a large number of fluoroscopic projections is impractical during cardiac EP procedures and exposes the patient to high radiation. The method presented in this paper requires only two fluoroscopic projections, does not require information about the imaging system or the geometrical relationship between the two projections, does not involve any a priori assumptions about the heart geometry, and minimizes radiation exposure to the patient by requiring at most two sets of biplane fluoroscopic projections.
B. Accuracy and Sensitivity
The geometrical information required for application of ECGI includes: 1) localization of the body surface ECG electrode positions and 2) reconstruction of an epicardial envelope around the heart on which cardiac electrical activity is imaged. The point reconstruction technique to localize body surface recording electrodes using stereo photography is validated in a phantom study (mannequin with visible markers). The electrode positions are reconstructed to within 1 mm of their actual locations. This is well within the diameter (5 mm) of the electrodes used in our ECGI multielectrode vest [10]. In previous experiments, we demonstrate that 10-mm error in body surface electrode positions still provides acceptable ECGI images [7], [11], [13], [15]. Therefore, an error of 1 mm in localizing the body surface electrodes is very adequate for generating accurate ECGI images in the clinical setting.
While it is essential to obtain accurate body surface electrode positions, the epicardial envelope can be anywhere between the body surface and the heart (provided it does not intersect electrically active cardiac tissue, since ECGI methodology assumes a source-free volume between the body surface and the epicardial envelope) [10]. The location of the envelope does not affect the accuracy of the results obtained using ECGI, however, it influences how closely the results approximate the actual electrical activity on the heart surface, with loss of spatial resolution as distance from the heart increases. In a previous study using a canine heart in a human-shaped torso tank, we verified that an envelope 10 mm from the heart surface provides a very close approximation to the electrical activity recorded directly from the epicardium [8]. Results from the phantom study show that the distance errors for the fluoroscopy-reconstructed heart are on average 4 mm relative to the CT heart, while for the human study, the distance errors are on average 10 mm. Based on the previous canine study, such accuracy is adequate for imaging important characteristics of the heart electrical activity using ECGI.
The fluoroscopy-based reconstruction of the heart surface geometry is insensitive to the choice of biplane imaging angles. This is evident from the fact that for the fluoroscopy reconstructed phantom heart the average distance error remains 4 mm for all biplane angles. This renders the method usable with any combination of biplane angles used in a cardiac EP procedure and makes the approach very practical and robust.
C. Initial Evaluation of Fluoroscopy-Based Heart Reconstruction for Electrocardiographic Imaging in a Human Subject
Using the fluoroscopy-based algorithm for determining heart surface geometry, we conduct an initial evaluation of ECGI in a human subject to noninvasively image cardiac electrical activity during normal sinus rhythm. As shown in Fig. 12, the fluoroscopy reconstructed envelope on which the ECGI potential image is overlaid is sufficiently proximal to the heart to reflect details of the underlying cardiac electrical activity. This is shown in comparison with the ECGI image obtained using CT. Noninvasively imaged potentials on the fluoroscopy reconstructed epicardial envelope approximate those on the CT-constructed epicardium. Importantly, properties of physiological significance such as potential patterns, gradients, and minima associated with epicardial breakthrough are captured in the fluoroscopy reconstructed ECGI image.
V. Limitations
In order to achieve reliable reconstructions of the 3-D heart surface geometry from two or more fluoroscopic projections, it is required that the heart projects entirely within the image. One way to achieve this requirement is to use maximum magnification in the imaging system for both projections. While increasing the magnification might result in larger noise, it is possible to minimize its effect by normalization of the image and scene coordinates prior to single view calibration [17]. While no distortion correction is implemented on the acquired fluoroscopic images, we predict that minor improvements can result with distortion correction. Others [37] have reported errors to within 6 mm for 3-D reconstruction of coronary bypass grafts without distortion correction. This error is within the 10 mm distance error seen in our human study. In addition, current state of the art flat panel detectors provide distortion free fluoroscopic projections. The diaphragm obstructs the view of the apical and right lateral regions of the heart in the right anterior oblique and anterior posterior projections. This problem can be overcome by extrapolating the heart contour in the diaphragm portion of the image. Extrapolation can be improved by playing the multiframe fluoroscopic projections in an animated movie. Using animation, the outer boundary as well as an extrapolation of the heart contour behind the diaphragm region is more accurately delineated. Moreover, heart contour segmentation would be improved whenever dye is injected as part of an interventional electrophysiological procedure, resulting in more accurate visualization of the heart and vasculature. Validation of the photographic method to localize body surface ECG electrodes in humans was not conducted here, as visual access to the back electrodes requires the design of a partially transparent bed. However, once such visual access is available, the photographic method, as validated in the phantom study, is adaptable and applicable to humans without any modification.
Acknowledgments
The authors would like to acknowledge the assistance of C. Fugate and S. Frame in acquiring and analyzing the X-ray fluoroscopic images; L. Ciancibello for his assistance in acquiring and transferring the CT imaging data and K. Ryu for his assistance in body surface potential mapping.
The work of Y. Rudy was supported by the National Institutes of Health (NIH) NHLBI under Grant R37 HL-33343 and Grant R01 HL-49054. The Associate Editor responsible for coordinating the review of this paper and recommending its publication was S. Aylward. Asterisk indicates corresponding author.
References
- 1.Kavuru MS, Vesselle H, Thomas CW. Advances in body surface potential mapping (BSPM) instrumentation. In: Liebman J, Plonsey R, Rudy Y, editors. Pediatric and Fundamental Electrocardiography. Dordrecht, The Netherlands: Martinus Nijhoff; 1987. p. 361. [Google Scholar]
- 2.He YH, Ghanem RN, Waldo AL, Rudy Y. An interactive graphical system for automated mapping and display of cardiac rhythms. J Electrocardiol. 1999;32:225–241. [PubMed] [Google Scholar]
- 3.Rudy Y. The electrocardiogram and cardiac excitation. In: Sperelakis N, Kurachi Y, Terzic A, Cohen MV, editors. Heart Physiology and Pathophysiology. San Diego, CA: Academic; 2000. pp. 133–148. [Google Scholar]
- 4.Plonsey R, Barr RC. Bioelectricity: A Quantitative Approach. 2. New York: Kluwer Academic/Plenum; 2000. [Google Scholar]
- 5.Spach MS, Barr RC. Ventricular intramural and epicardial potential distributions during ventricular activation and repolarization in the intact dog. Circ Res. 1975;37:243–257. doi: 10.1161/01.res.37.2.243. [DOI] [PubMed] [Google Scholar]
- 6.Spach MS, Barr RC, Lanning CF, Tucek PC. Origin of body surface QRS and T wave potentials from epicardial potential distributions in the intact chimpanzee. Circulation. 1977;55:268. doi: 10.1161/01.cir.55.2.268. [DOI] [PubMed] [Google Scholar]
- 7.Rapport BM, Rudy Y. Noninvasive recovery of epicardial potentials in a realistic heart-torso geometry. Normal sinus rhythm. Circ Res. 1990;66:1023–1039. doi: 10.1161/01.res.66.4.1023. [DOI] [PubMed] [Google Scholar]
- 8.Oster HS, Taccardi B, Lux RL, Ershler PR, Rudy Y. Noninvasive electrocardiographic imaging: Reconstruction of epicardial potentials, electrograms, and isochrones and localization of single and multiple electrocardiac events. Circulation. 1997;96:1012–1024. doi: 10.1161/01.cir.96.3.1012. [DOI] [PubMed] [Google Scholar]
- 9.Oster HS, Taccardi B, Lux RL, Ershler PR, Rudy Y. Electrocardiographic imaging: Noninvasive characterization of intramural myocardial activation from inverse-reconstructed epicardial potentials and electrograms. Circulation. 1998;97:1496–1507. doi: 10.1161/01.cir.97.15.1496. [DOI] [PubMed] [Google Scholar]
- 10.Rudy Y, Burnes JE. Noninvasive electrocardiographic imaging. Ann Noninvasive Electrocardiol. 1999;4:340–359. [Google Scholar]
- 11.Burnes JE, Taccardi B, MacLeod RS, Rudy Y. Noninvasive ECG imaging of electrophysiologically abnormal substrates in infarcted hearts: A model study. Circulation. 2000;101:533–540. doi: 10.1161/01.cir.101.5.533. [DOI] [PubMed] [Google Scholar]
- 12.Burnes JE, Taccardi B, Ershler PR, Rudy Y. Noninvasive electrocardiographic imaging of substrate and intramural ventricular tachycardia in infarcted hearts. J Amer Coll Cardiol. 2001;38:2071–2078. doi: 10.1016/s0735-1097(01)01653-9. [DOI] [PMC free article] [PubMed] [Google Scholar]
- 13.Burnes JE, Taccardi B, Rudy Y. A noninvasive imaging modality for cardiac arrhythmias. Circulation. 2000;102:2152–2158. doi: 10.1161/01.cir.102.17.2152. [DOI] [PMC free article] [PubMed] [Google Scholar]
- 14.Burnes JE, Ghanem RN, Waldo AL, Rudy Y. Imaging dispersion of myocardial repolarization—I: Comparison of body-surface and epicardial measures. Circulation. 2001;104:1299–1305. doi: 10.1161/hc3601.094276. [DOI] [PubMed] [Google Scholar]
- 15.Ghanem RN, Burnes JE, Waldo AL, Rudy Y. Imaging dispersion of myocardial repolarization—II: Noninvasive reconstruction of epicardial measures. Circulation. 2001;104:1306–1312. doi: 10.1161/hc3601.094277. [DOI] [PubMed] [Google Scholar]
- 16.Faugeras O. Three Dimensional Computer Vision: A Geometric Viewpoint. Cambridge, MA: MIT Press; 1993. [Google Scholar]
- 17.Hartley R, Zisserman A. Multiple View Geometry in Computer Vision. Cambridge, U.K: Cambridge Univ. Press; 2000. [Google Scholar]
- 18.Zhang ZY. Determining the epipolar geometry and its uncertainty: A review. Int J Comput Vision. 1998;27:161–195. [Google Scholar]
- 19.Hartley RI. In defense of the eight-point algorithm. IEEE Trans Pattern Anal Machine Intell. 1997 June;19:580–593. [Google Scholar]
- 20.Xú G, Zhang Z. Epipolar Geometry in Stereo, Motion, and Object Recognition: A Unified Approach. Dordrecht, The Netherlands: Kluwer Academic; 1996. [Google Scholar]
- 21.Rothwell C, Faugeras O, Csurka G. A comparison of projective reconstruction methods for pairs of views. Comput Vision Image Understanding. 1997;68:37–58. [Google Scholar]
- 22.Brebbia CA, Telles JCF, Wrobel LC. Boundary Element Techniques: Theory and Applications in Engineering. Berlin, Germany: Springer-Verlag; 1984. [Google Scholar]
- 23.Kass M, Witkin A, Terzopoulos D. Snakes – Active contour models. Int J Comput Vision. 1987;1:321–331. [Google Scholar]
- 24.Laurita K, Sun G, Thomas CW, Kavuru M, Liebman J, Waldo AL. Interactive cardiac mapping. I. Data acquisition; Proc 11th Annu Int Conf IEEE, Engineering in Medicine and Biology Soc; 1989. pp. 204–205. [Google Scholar]
- 25.Rudy Y, Oster HS. The electrocardiographic inverse problem. Crit Rev Biomed Eng. 1992;20:25–45. [PubMed] [Google Scholar]
- 26.Tikhonov AN, Arsenin VY. Solutions of Ill-Posed Problems. New York: Wiley; 1977. [Google Scholar]
- 27.Hansen PC, Oleary DP. The use of the L-curve in the regularization of discrete Ill-posed problems. SIAM J Scientific Computing. 1993;14:1487–1503. [Google Scholar]
- 28.Hoffmann KR, Williams BB, Esthappan J, Chen SY, Carroll JD, Harauchi H, Doerr V, Kay GN, Eberhardt A, Overland M. Determination of 3D positions of pacemaker leads from biplane angiographic sequences. Med Phys. 1997;24:1854–1862. doi: 10.1118/1.598158. [DOI] [PubMed] [Google Scholar]
- 29.Esthappan J, Harauchi H, Hoffmann KR. Evaluation of imaging geometries calculated from biplane images. Med Phys. 1998;25:965–975. doi: 10.1118/1.598275. [DOI] [PubMed] [Google Scholar]
- 30.Chen SY, Metz CE. Improved determination of biplane imaging geometry from two projection images and its application to three-dimensional reconstruction of coronary arterial trees. Med Phys. 1997;24:633–654. doi: 10.1118/1.598129. [DOI] [PubMed] [Google Scholar]
- 31.Hoffmann KR, Metz CE, Chen Y. Determination of 3-D imaging geometry and object configurations from two biplane views: An enhancement of the Metz-Fencil technique. Med Phys. 1995;22:1219–1227. doi: 10.1118/1.597559. [DOI] [PubMed] [Google Scholar]
- 32.Hoffmann KR, Esthappan J. Determination of three-dimensional positions of known sparse objects from a single projection. Med Phys. 1997;24:555–564. doi: 10.1118/1.597938. [DOI] [PubMed] [Google Scholar]
- 33.Ahuja N, Ponce J. Structure and motion estimation from dynamic silhouettes under perspective projection. Int J Comput Vision. 1999;31:31–50. [Google Scholar]
- 34.Berger MO. 3-D surface reconstruction using occluding contours. Int J Comput Vision. 1997;22:219–233. [Google Scholar]
- 35.Weiss R. Robust shape recovery from occluding contours using a linear smoother. Int J Comput Vision. 1998;28:27–44. [Google Scholar]
- 36.Mohr R. Global three-dimensional surface reconstruction from occluding contours. Comput Vision Image Understanding. 1996;64:62–96. [Google Scholar]
- 37.Dorsaz PA, Dorsaz L, Doriot PA. The effect of image distortion on 3-D reconstruction of coronary bypass grafts from angiographic views. IEEE Trans Med Imag. 2000 July;19:759–762. doi: 10.1109/42.875203. [DOI] [PubMed] [Google Scholar]


