Abstract
Triacylglycerols are neutral lipids present in all mammalian cells as energy reserves and diacylglycerols as intermediates in phospholipid biosynthesis and as signaling molecules. The molecular species of triacylglycerols and diacylglycerols present in mammalian cells are quite complex and previous investigations revealed multiple isobaric species having molecular weights at virtually every even mass between 600-900 daltons, making it difficult to assess changes of individual molecular species after cell activation. A method has been developed using tandem mass spectrometry and neutral loss scanning to quantitatively analyze changes in those glyceryl ester molecular species containing identical fatty acyl groups. This was carried out by neutral loss scanning of 18 common fatty acyl groups where the neutral loss corresponded to the free carboxylic acid plus NH3. Deuterium labeled internal standards were used to normalize the signal for each nominal [M+NH4]+ ion undergoing this neutral loss reaction. This method was applied in studies of triacylglycerols in RAW 264.7 cells treated with the toll-like receptor 4 ligand Kdo2-lipid A. A 50:1-TAG containing 18:1 was found to increase significantly over a 24 hr time course after Kdo2-lipid A exposure whereas an isobaric 50:1-TAG containing 16:1 did not change relative to controls.
Keywords: triacylglycerols, diacylglycerols, mass spectrometry, neutral loss, electrospray ionization, MS3, Kdo2-lipid A, RAW 264.7 molecular species
Introduction
The neutral glycerolipids are relatively simple chemical structures in that they are made up of free fatty acids esterified to the three carbinol oxygen atoms of glycerol. Triacylglycerols (TAGs) and diacylglycerols (DAGs) are at the center of some of the most complex biochemical systems that drive signal transduction, phospholipid biosynthesis, energy production, and fuel storage in an organism [1]. TAGs are present in most mammalian cells within identifiable structures called lipid droplets [2] more recently called adiposomes [3]. In the past, these subcellular organelles were thought to be reservoirs of TAGs, cholesterol, and cholesterol esters and metabolically inactive. A much different picture has emerged where these intracellular organelles have been found to be actively linked to many cellular processes such as membrane transport within the cell [4]. Evidence has accumulated that the extraordinary rise in type II diabetes, in particular with individuals below the age of 30, is directly or indirectly related to elevation of TAGs in the diet [5,6]. TAGs are hydrolyzed by lipases such as hormone sensitive lipase [7] as well as adipose triglyceride lipase [8] to form 1,2- and 2,3- DAGs. Additional intake of these metabolites now is considered to have a beneficial effect on the lipid metabolism in rats as well as in humans [4,8]. DAGs also arise from hydrolysis of phospholipids such as phosphatidylinositol by phospholipase C [9] and phosphatidylcholine by phospholipase D and a phosphatase [10]. TAGs are present in all cells in various amounts with the adipocyte being the cell with the largest quantity since it is a specialized cell for the storage of this type of lipid [11,12]. Also, there is evidence that cells can transport TAGs from intracellular lipid bodies to the cell membrane by means of the adiposome [3].
TAGs exist as a complex mixture of unique molecular species of lipids within cells and the analysis of these lipids has historically presented a considerable challenge [13-15]. Much of our present understanding of the role of TAGs comes from measurement of either the total quantity of TAG present in cells, or fatty acids that can be released from TAGs after isolation and saponification rather than knowledge of changes in unique TAG molecular species. In recent years there has been renewed interest in the development of mass spectrometric methods using electrospray ionization and atmospheric pressure chemical ionization to analyze TAGs at the molecular species level [16-19]. We recently reported a strategy using MS3 to analyze TAGs from a complex mixture as the NH4+ adduct ions generated by electrospray ionization [20]. This method was used to identify positional isomers of unique molecular species at the level of individual esterified fatty acyl groups present within the macrophage derived cell line, called RAW 264.7 cells, with the estimated total of unique molecular species being well over 500.
Han and Gross reported advances in TAG analysis by investigation of Li+ adducts of TAGs by neutral loss mass spectrometry using a triple quadrupole mass spectrometer [21]. The [M+Li]+ ions of TAGs underwent the characteristic loss of two neutral types, RCOOH or RCOOLi, for each fatty acyl group present and so neutral loss experiments scanning for these losses could be used to determine the composition of unique fatty acyl groups in a complex mixture of TAGs. The combination of several neutral loss scans was used to determine a complete fatty acyl profile of the TAGs present, from which a list of molecular species was proposed. The [M+NH4]+ ions of TAGs undergo the characteristic loss of a single neutral species RCOOH + NH3, for each fatty acyl group present and so neutral loss mass spectrometry can also be similarly used for analysis of ammoniated adducts of TAGs.
The major challenge in the analysis of a complex mixture of naturally occurring TAGs is how to best assess relative amounts and/or changes in individual molecular species. One confounding factor is that ionization efficiencies between different molecular species and the extent of acyl loss (RCOOH+NH3) could vary for each fatty acyl group [17,22]. Analyses of other classes of lipids using mass spectrometry typically engage a method to quantify the molecular abundance of the lipid species of interest, which involves simultaneous analysis of one or more internal standards [23,24]. Unfortunately, the quantification of TAG molecular species using such an approach would be confounded by the number of molecular species present in a typical cell, which does not leave regions in the mass spectrum into which the ion from the internal standard can appear that does not interfere with an endogenous component, such as its abundant carbon-13 isotope or alkali adduct ions. Here we report a method which involves placing stable isotope labeled TAG and DAG internal standards within the mass spectral regions of TAG and DAG molecular ions in the neutral loss scan for 18 of the common fatty acyl groups found in mammalian cells. This method also permitted a precise measurement of changes in abundance of specific molecular species characterized by molecular weight and containing a specific fatty acyl group. This method was used to analyze the effect on the neutral glyceryl lipid molecular species following activation of an important receptor of the innate immune system, called the toll-like receptor 4 which is present on the surface of cells (plasma membrane) by the ligand Kdo2-lipid A [25].
Materials and Methods
Materials
Stable isotope internal standards contained the labeled [1,1,2,3,3]-D5 glycerol backbone and had the following fatty acyl composition: D5-14:0/14:0 DAG, D5-15:0/15:0 DAG, D5-16:0/16:0 DAG, D5-17:0/17:0 DAG, D5-19:0/19:0, D5-20:0/20:0 DAG, D5-20:2/20:2 DAG, D5-20:4/20:4 DAG, D5-20:5/20:5 DAG, D5-14:0/16:1/14:0 TAG, D5-15:0/18:1/15:0 TAG, D5-16:0/18:0/16:0 TAG, D5-17:0/17:1/17:0 TAG, D5-19:0/12:0/19:0 TAG, D5-20:0/20:1/20:0 TAG, D5-20:2/18:3/20:2 TAG, D5-20:4/18:2/20:4 TAG, and D5-20:5/22:6/20:5 TAG (Avanti Polar Lipids, Alabaster, AL). All were greater than 95 atom% excess D5. Discovery DSC-Si silica solid phase extraction cartridges (1 mL, 100 mg) were purchased from Supelco (Bellefonte, PA). All solvents were HPLC or Optima grade and obtained from Fisher Scientific (Fair Lawn, NJ) and 96 well plates were obtained from Eppendorf (Westbury, NY). Cell media and buffers were obtained from Mediatech, Inc. (Herndon, VA).
Cell culture and Kdo2-lipid A induction protocol
The cells used in this study were RAW 264.7 macrophage-like cells derived from tumors induced in male BALB/c mice by the Abelson murine leukemia virus. RAW 264.7 cells were obtained from ATCC laboratories (Manassas, VA) for use by the Lipid MAPS consortium. The cells were grown in 150 cm2 flasks in 30 mL of high glucose Dulbecco's modified Eagles medium containing 10% fetal bovine serum and 1% penicillin/streptomycin in a 5% CO2, humidified atmosphere maintained at 37°C. The cells were divided each time they reached 80% confluency.
Cells (5 × 10⁶) were seeded in 100 mm tissue culture plates with 5 mL of the growth medium for each sample in the Kdo2-lipid A stimulation. These plates were incubated for 30 hr to achieve approximately 80% confluency. Cells were stimulated by the addition of 5 μL of Kdo2-lipid A suspended in Dulbecco's phosphate buffered saline (DPBS) (100 μg/mL) to the medium for a final concentration of 100 ng/mL. An equal amount of DPBS was also added to each control sample. The treated and corresponding control samples were then incubated for 0.5, 1, 2, 4, 8, 12, and 24 hr. Cells were then washed twice with 3 mL of 4°C DPBS and harvested in 500 μL of DPBS. A 10% aliquot of the cell suspension was reserved for DNA [26] and ice-cold methanol (1.25 mL) was added to the remaining suspension. A volume containing 600 pmol each of the D5-labeled internal standards in toluene/methanol (1:1) was added (Table 2) and the samples stored at 4°C.
Table 2.
[1,1,2,3,3-D5]glycerol labeled glyceryl lipids used for neutral loss mass spectrometric analysis.
| TAG | m/z | DAG | m/z |
|---|---|---|---|
| Fatty Acyl Composition | [M+NH4]+ | Fatty Acyl Composition | [M+NH4]+ |
| 19:0/12:0/19:0a | 857.83 | 19:0/19:0 | 675.66 |
| 14:0/16:1/14:0 | 771.73 | 20:0/20:0 | 703.70 |
| 15:0/18:1/15:0 | 827.78 | 14:0/14:0 | 535.51 |
| 16:0/18:0/16:0 | 857.83 | 15:0/15:0 | 563.54 |
| 17:0/17:1/17:0 | 869.83 | 16:0/16:0 | 591.57 |
| 20:4/18:2/20:4 | 949.80 | 17:0/17:0 | 619.60 |
| 20:0/20:1/20:0 | 995.97 | 20:2/20:2 | 695.63 |
| 20:2/18:3/20:2 | 955.84 | 20:4/20:4 | 687.57 |
| 20:5/22:6/20:5 | 993.77 | 20:5/20:5 | 683.54 |
The acyl order as indicated: sn-1/sn-2/sn-3.
Extraction and isolation of neutral lipids
The total lipid extract from each sample in the time course experiment was obtained using a modified Bligh and Dyer extraction method substituting CH2Cl2 for CHCl3 [27]. Briefly, CH2Cl2 (0.625 mL) was added to each sample and the mixture vortexed to form a monophasic solution. To this monophase, a solution of D5-DAG and D5-TAG internal standards was added (600 pmol each in a single solution). An additional 0.5 mL of H2O and 0.625 mL of CH2Cl2 were added and samples vortexed before centrifugation at 1000 × g for 5 min. The lower organic phase was removed to a clean tube and dried under N2. Glyceryl lipids were separated following the method described by Ingalls et al. [28]. A silica SPE cartridge (DSC-Si, 100 mg) was washed with 4 mL isooctane/ethyl acetate (80:1). The sample, dissolved in 1 mL isooctane/ethyl acetate (75:25), was applied to the cartridge. Glyceryl lipids were eluted with 5 mL isooctane/ethyl acetate (75:25). The samples were then dried under N2 and stored until analysis. An aliquot of this sample was electrosprayed into the mass spectrometer using the solvent system acetonitrile/isopropanol/water/CH2Cl2 (45/45/5/5, v/v/v/v) containing a final concentration of 10 mM ammonium acetate (NH4OAc) to maintain excellent solubility of lipids and stability of the nanoelectrospray.
TLC separation of RAW Triacylglycerols
For studies involving MS3 identification of TAG molecular species that required a large quantity of cell-derived TAGs, the total lipid extract from 200 × 106 RAW cells was dissolved in 100 μL, CH2Cl2. This lipid extract was spotted onto an activated, prewashed Silica Gel G TLC plate (Alltech, Deerfield, IL). Separation was accomplished with a solvent system composed of hexane/ethyl ether/acetic acid (80:20:1). When the solvent front advanced 15 cm, the plate was removed and allowed to dry. The area of the plate corresponding to TAGs was scraped and placed into a glass tube. The lipids were extracted from the scraped silica by vigorous mixing with 4 mL of methylene chloride. After centrifugation, the isolated TAGs were transferred to a clean glass tube and dried under a stream of nitrogen. The TAGs were dissolved by the electrospray solution previously described for direct mass spectrometric analysis.
Mass spectrometric analysis
Electrospray ionization mass spectrometry was carried out using a 4000 Q-Trap mass spectrometer (Applied Biosystems/MDS Sciex, Foster City, CA) equipped with a nanoMate chip-based ionization source (Advion, Ithaca, NY). An aliquot (30 μL) of each sample was added to the polypropylene sampling vial immediately before the nanoMate collected and positioned the sample at the chip nozzle and spray continued for up to 1 hr. Experiments were performed in positive ion mode with ionization parameters of 0.3 psi (pressure) and 1.38 kV, and vented head-space which gave a spray rate approximately 220 nL/min. Neutral loss experiments were carried out by scanning the first quadrupole and third quadrupole simultaneously, with the third quadrupole at a negative mass offset to the first by a value equal to the mass of the neutral moiety lost upon collisional activation of the parent molecule in the second quadrupole. Each neutral loss spectrum was scanned from m/z 500 – 1000 over 6 sec and then the scan was repeated 30 times (3.0 min total time). The experiments were carried out with a collision energy of 35 V.
Data Processing
For each sample, the data from 18 neutral loss experiments were processed with the Lipid Profiler prototype software [29] to identify and quantify detected DAG and TAG species. Briefly, the software processes each observed ion, resolves the overlapping isotope patterns, and removes the isotope peaks. The m/z values of mono-isotopic peaks are matched against a list of masses which are computed from the information in an underlying Lipid Profiler database and correspond to [M+NH4]+ ions of DAGs and TAGs. In order to obtain quantitative information, the D5-internal standard signal is extracted in parallel with the other data from each neutral loss experiment. After correction of the mono-isotopic peak areas for the isotope distribution of assigned DAGs or TAGs, the responses relative to the appropriate internal standard are stored in textual result files.
Reporting of unlikely DAG and TAG molecular species was minimized with additional routines incorporated in the Format Lipid Results script which reviewed the original results and removed any assignments that required that an uncommon fatty acyl substituent be a part of the glycerolipid molecule.
Results
Collision induced dissociation of TAGs and DAGs
As previously described [13], relatively stable ammonium adduct ions [M+NH4]+ of TAGs were readily generated during electrospray ionization when ammonium acetate was present in the solvent system. Decomposition of the [M+NH4]+ ions of TAGs by collisional activation during a tandem mass spectrometric experiment revealed those acyl groups present within each [M+NH4]+ as described earlier. The MS/MS spectrum of 1-palmitoyl-2-oleoyl-3-linoleoyl glycerol, 16:0/18:1/18:2, (m/z 874.8, Figure 1A) is typical of the characteristic decomposition processes of the [M+NH4]+ ions of TAGs which showed the neutral loss of 273 (16:0 + NH3), 297 (18:2 + NH3), and 299 (18:1 + NH3) u to form ions at m/z 601, 577, and 575 respectively. Table 1 lists the neutral losses that are characteristic for each of the fatty acyl esters present in TAGs and DAGs when the [M+NH4]+ ions were collisionally activated in the tandem quadrupole mass spectrometer.
Figure 1.
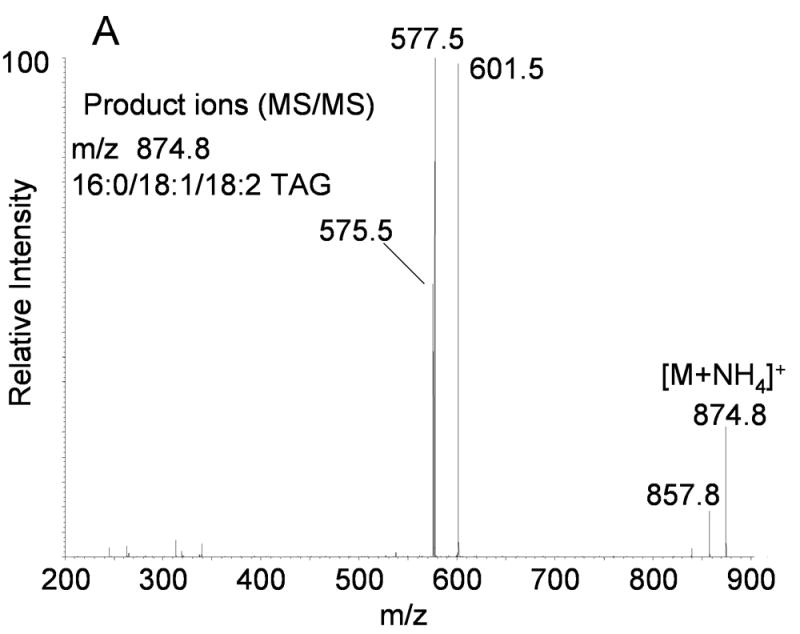
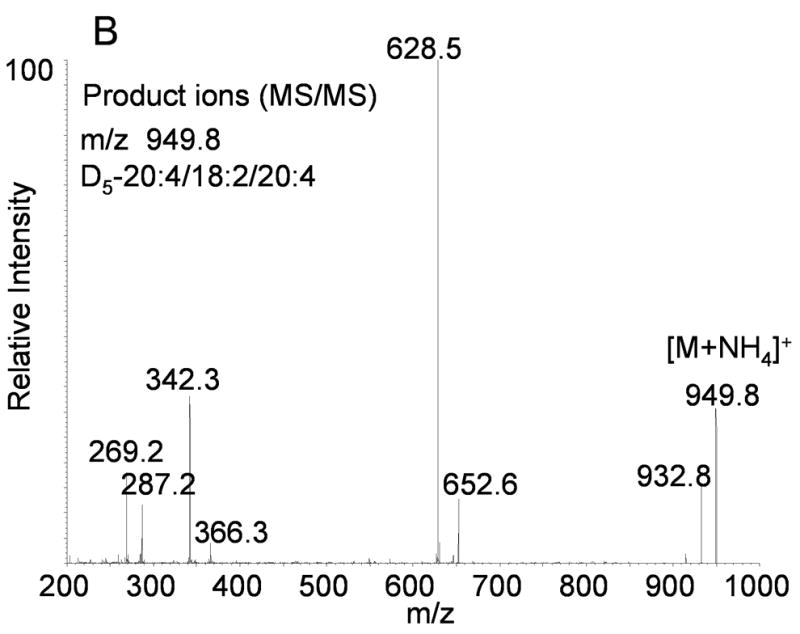
(A) Positive ion electrospray ionization of synthetic 1-hexadecanoyl-2-oleoyl-3-linoleoyl glycerol (16:0/18:1/18:2-TAG) followed by collision induced dissociation of the [M+NH4]+ at m/z 874.8. Abundant product ions correspond to neutral loss of each fatty acyl group as a free carboxylic acid and ammonia (NH3). (B) Positive ion electrospray ionization of synthetic [1,1,2,3,3]-D5-1-arachidonoyl-2-linoleoyl-3- arachidonoyl glycerol (D5-20:4/18:2/20:4-TAG) followed by collision induced dissociation of the [M+NH4]+ at m/z 949.8. Abundant product ions correspond to neutral loss of each fatty acyl group as a free carboxylic acid and ammonia (NH3).
Table 1.
Neutral loss mass corresponding to common fatty acyl groups esterified to TAG and DAG molecular species after collisional activation and observed by MS/MS.
| Fatty Acyl Substituenta | Neutral Loss (NL)b |
|---|---|
| RCOOH + NH3 | |
| 12:0 | 217 |
| 14:0 | 245 |
| 15:0 | 259 |
| 16:1 | 271 |
| 16:0 | 273 |
| 17:1 | 285 |
| 17:0 | 287 |
| 18:3 | 295 |
| 18:2 | 297 |
| 18:1 | 299 |
| 18:0 | 301 |
| 19:0 | 315 |
| 20:5 | 319 |
| 20:4 | 321 |
| 20:2 | 325 |
| 20:1 | 327 |
| 20:0 | 329 |
| 22:6 | 345 |
Designation of total carbon atoms in the fatty acyl group: total number of double bonds.
Neutral loss mass as RCOOH + NH3 corresponding to the mass of the fatty acyl group as a free carboxylic acid plus the mass of ammonia.
Collisional activation of a D5-TAG, where the five deuterium atoms were present on the glycerol backbone, showed identical neutral loss characteristics with the same nominal fatty acid masses indicative of the esterified acyl groups on the TAG. For example, collisional activation of D5-1-arachidonoyl-2-linoleoyl-3-arachidonoyl glycerol (m/z 949.8, [M+NH4]+), had a neutral loss of 297 u (linoleic acid + NH3) observed at m/z 652.6 whereas the loss of arachidonic acid plus ammonia neutral loss of 321u (NL 321) was observed at m/z 628.5 (Figure 1B). The loss of the proton along with the carboxyl moiety of the sn-1 or sn-2 fatty acyl group was derived from the ammonium ion rather than from the glycerol backbone [13]. The value of the neutral loss for such deuterium labeled analogs was identical to that for the naturally occurring fatty acyl group (as fatty acids) and therefore the deuterium labeled analogs would be detected in a neutral loss scan along with all other TAGs containing the same esterified fatty acyl group (e.g., containing 20:4 or 18:2). Table 2 lists the D5-TAG and D5-DAG internal standards used in this study.
Ammoniated adducts of DAGs were also readily formed during the electrospray process when ammonium acetate was present in the mobile phase. The MS/MS spectrum of the [M+NH4]+ ion from 18:0/18:0-DAG observed at m/z 642.5 (Figure 2A), similarly showed a rather simple and characteristic product ion mass spectrum which involved the neutral loss of the acyl group as a free carboxylic acid and ammonia. Two rather abundant ions were observed, one corresponding to the above described loss of the neutral fatty acyl groups as the fatty acid plus NH3 as well as an ion corresponding to the loss of H2O plus NH3, which was observed at m/z 607.6 (loss of 35 u). Collisional activation of a D5-glycerol backbone labeled diacylglycerol (D5-16:0/16:0) had very similar product ion spectrum (Figure 2B). There was an abundant loss of the fatty acyl group observed following collisional activation of [M+NH4]+ at m/z 591 yielding the product ion 318.5 (neutral loss of 16:0 acid + NH3). Furthermore, the loss of water plus ammonia (35 u) was also observed at m/z 556, indicating that all protons involved in the loss of water as well as neutral ammonia were derived from the ammonium ion and there was no loss of the deuterium atoms from the glycerol backbone. Again, the mass of fatty acyl loss (as fatty acid plus NH3) was identical whether derived from the deuterium labeled diacylglycerol (deuterium atoms on the glycerol backbone) or the naturally occurring diacylglycerol. For the case of DAGs the neutral loss scan defined one fatty acyl group and the mass of the observed ion defines the possible second fatty acyl group and thus unique molecular species are identified by the [M+NH4]+ observed mass and neutral loss signal.
Figure 2.
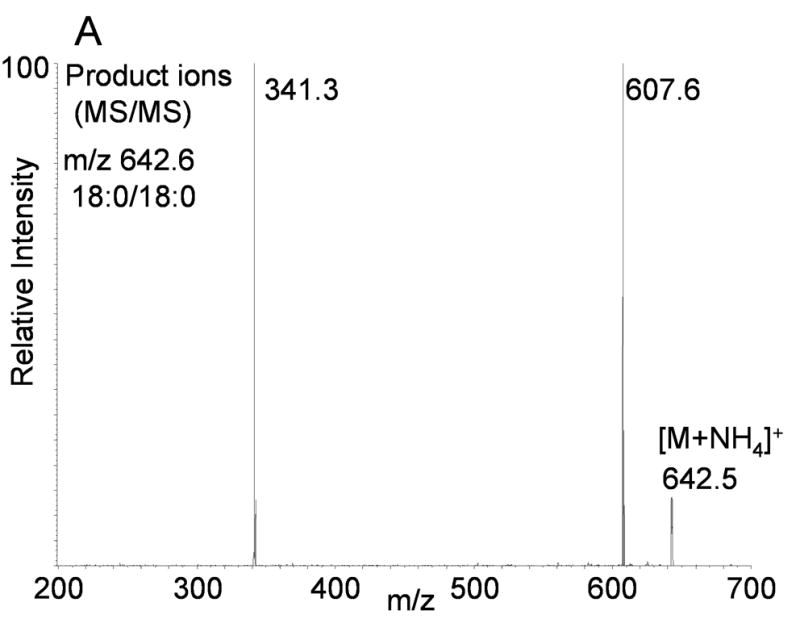
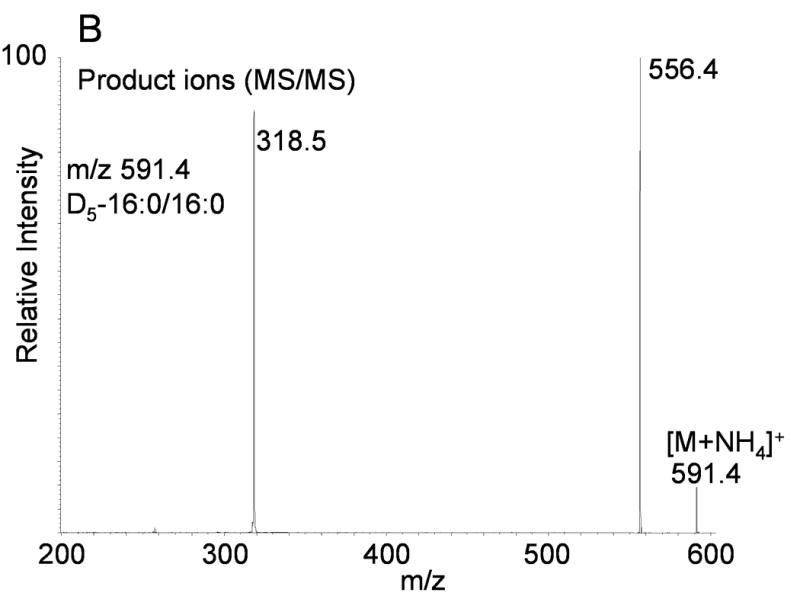
(A) Positive ion electrospray ionization of synthetic 1,2-stearoyl-2-glycerol (18:0/18:0-DAG) followed by collision induced dissociation of the [M+NH4]+ at m/z 642.5. Abundant product ion corresponds to neural loss of water plus ammonia and each fatty acyl group as the identical carboxylic acid and ammonia (NH3). (B) Positive ion electrospray ionization of synthetic [1,1,2,3,3]-D5-1,2-palmitoyl-glycerol (D5-16:0/16:0-DAG) followed by collision induced dissociation of the [M+NH4]+ at m/z 591.4 Abundant product ions correspond to neural loss of water plus ammonia and each fatty acyl group as the identical carboxylic acid and ammonia (NH3).
Relative quantitation of fatty acyl substituents in DAGs and TAGs
Mass spectral analysis of [M+NH4]+ observed during electrospray ionization of TLC purified TAGs isolated from RAW 264.7 cells revealed a complex mixture of species (Figure 3A). DAGs were also present as a complex mixture of molecular species even after separation of each glycerol lipid class by thin layer chromatography (data not shown). In spite of this level of both chromatographic and mass spectral separation, each [M+NH4]+ was composed of numerous isobaric, yet distinct components. For example, the ion at m/z 876.8, corresponding to TAGs 52:2 (calculated fatty acyl carbon atoms: total number of double bonds), was previously reported to contain over 15 distinct species having unique fatty acyl groups and not counting positional isomers [20]. In part, this can be observed by MS/MS of m/z 876.8 (Figure 3B) which revealed the abundant loss of 273 and 299 u at m/z 603 and 577 (corresponding to fatty acyl groups 16:0 and 18:1, respectively) with minor losses of 245, 271, 285, 297, 301, 313, 325, and 327 u ( in toto, corresponding to the presence of fatty acyl groups 14:0, 16:1, 16:0, 18:1, 18:0, 19:1, 20:2, and 20:1, respectively, in less abundant molecular species).
Figure 3.
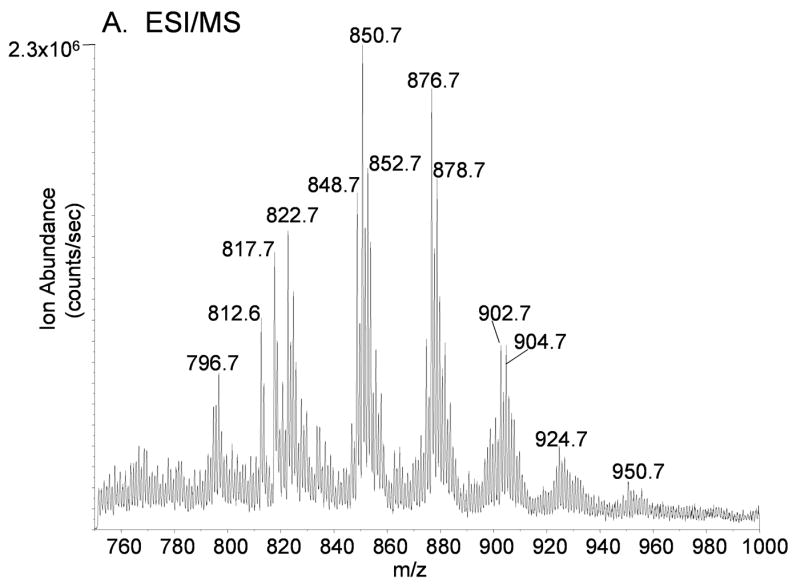
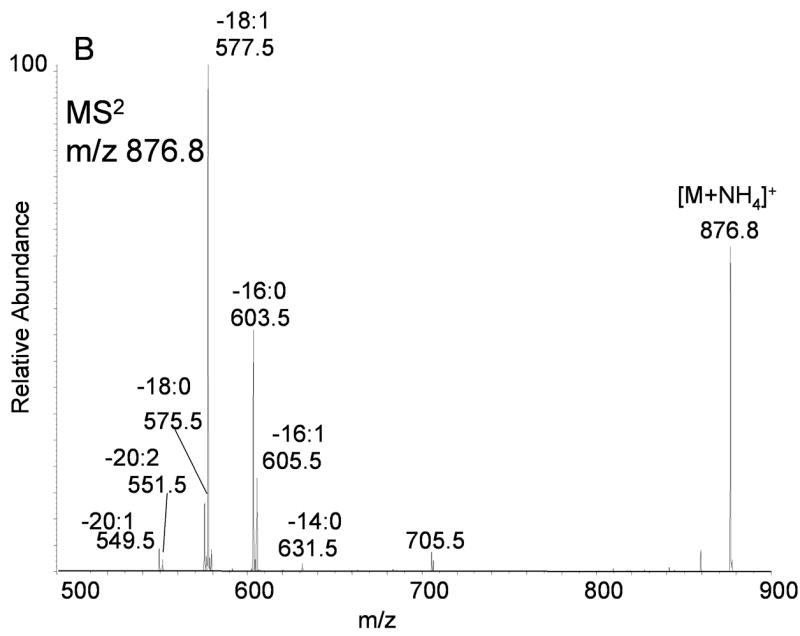
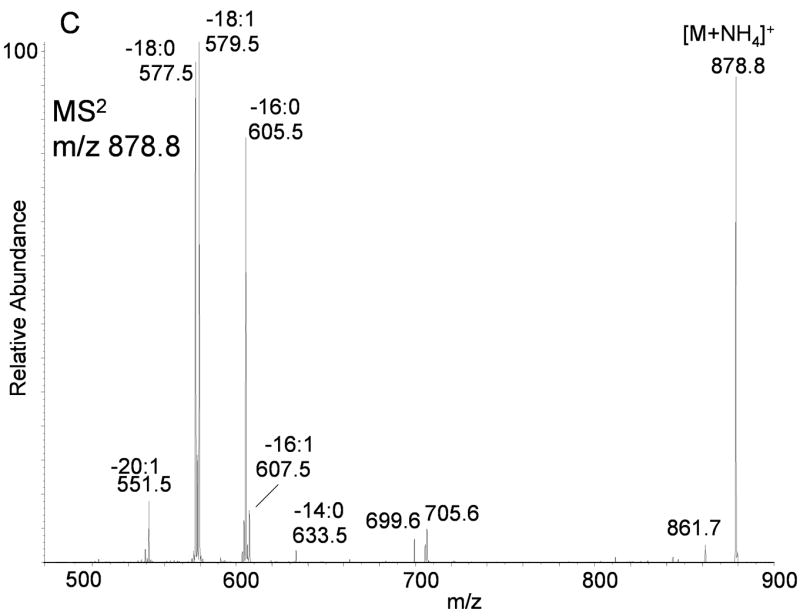
(A) Positive ion electrospray ionization of RAW 264.7 cell glyceryl lipids extracted from 2 × 10⁸ cells followed by TLC purification. No D5-internal standards were present in this sample. The electrospray mobile phase contained 10 mM NH4OAc so that the ammonium adduct ion for each molecular species of TAGs and DAGs predominated. (B) Collision induced dissociation of m/z 876.8 corresponding to the [M+NH4]+ for 52:2-TAG molecular species present in the RAW cell glyceryl lipid extract. Each product ion corresponds to neural loss each fatty acyl group plus ammonia (NH3) present in these isobaric molecular species of TAGs. (C) Collision induced dissociation of m/z 878.8 corresponding to the [M+NH4]+ for 52:1-TAG molecular species present in the RAW cell glyceryl lipid extract. Each product ion corresponds to the neutral loss of each fatty acyl group plus ammonia (NH3) present in these isobaric molecular species of TAGs.
Determination of the two additional fatty acyl components that make up each molecular species at each [M+NH4]+ requires MS3 analysis of each of the major MS/MS product ions, but the identity of the three fatty acyl groups are constrained by the calculated total fatty acyl carbon atoms and total number of double bonds. For the example, the [M+NH4]+ present in this mixture of TAGs observed at m/z 876.8, corresponded to a family of 52:2 TAG species. The MS2 product ions corresponding to the eight different fatty acyl groups described above were subjected to MS3 analysis and observed product ions compared to expected product ions for fatty acyl groups 2:0 to 25:2 (Table 3). These ions included RC≡O+, [RC≡O+−H2O], R′ + 74, and [R′ + 74−H2O] as previously described (20). The neutral losses from suspected RC≡O+ and/or R′ + 74 ions in the MS3 mass spectra, the third fatty acyl group was determined (Table 3). In this way, molecular species within this single [M+NH4]+ could be determined. The RAW 264.7 cells had 11 separate molecular species contributing to the abundance of m/z 876.8 (Table 4). A somewhat fewer number of unique molecular species (4) were present within m/z 878.8 by this MS3 analysis (Table 4).
Table 3.
Mass losses and observed mass-to-charge ratio for MS/MS and MS3 experiments of TAG and DAG molecular species.
| R1 (MS2)a | R2 Observed MS3 Product Ion Type | R3 (Mass Loss from observed MS3 ion) | |||||
|---|---|---|---|---|---|---|---|
| Neutral Loss | |||||||
| RCOOH + NH3 | RC=O | RCO−H2O | R′ + 74 | R′ + 74 − H2O | RC=O | R′ + 74 | |
| 2:0 | 77 | 43 | 25 | 117 | 99 | 116 | 42 |
| 3:0 | 91 | 57 | 39 | 131 | 113 | 130 | 56 |
| 4:0 | 105 | 71 | 53 | 145 | 127 | 144 | 70 |
| 5:0 | 119 | 85 | 67 | 159 | 141 | 158 | 84 |
| 6:0 | 133 | 99 | 81 | 173 | 155 | 172 | 98 |
| 7:0 | 147 | 113 | 95 | 187 | 169 | 186 | 112 |
| 8:0 | 161 | 127 | 109 | 201 | 183 | 200 | 126 |
| 9:0 | 175 | 141 | 123 | 215 | 197 | 214 | 140 |
| 10:0 | 189 | 155 | 137 | 229 | 211 | 228 | 154 |
| 11:0 | 203 | 169 | 151 | 243 | 225 | 242 | 168 |
| 12:0 | 217 | 183 | 165 | 257 | 239 | 256 | 182 |
| 13:0 | 231 | 197 | 179 | 271 | 253 | 270 | 196 |
| 14:0 | 245 | 211 | 193 | 285 | 267 | 284 | 210 |
| 14:1 | 243 | 209 | 191 | 283 | 265 | 282 | 208 |
| 15:0 | 259 | 225 | 207 | 299 | 281 | 298 | 224 |
| 15:1 | 257 | 223 | 205 | 297 | 279 | 296 | 222 |
| 16:0 | 273 | 239 | 221 | 313 | 295 | 312 | 238 |
| 16:1 | 271 | 237 | 219 | 311 | 293 | 310 | 236 |
| 16:2 | 269 | 235 | 217 | 309 | 291 | 308 | 234 |
| 17:0 | 287 | 253 | 235 | 327 | 309 | 326 | 252 |
| 17:1 | 285 | 251 | 233 | 325 | 307 | 324 | 250 |
| 17:2 | 283 | 249 | 231 | 323 | 305 | 322 | 248 |
| 18:0 | 301 | 267 | 249 | 341 | 323 | 340 | 266 |
| 18:1 | 299 | 265 | 247 | 339 | 321 | 338 | 264 |
| 18:2 | 297 | 263 | 245 | 337 | 319 | 336 | 262 |
| 18:3 | 295 | 261 | 243 | 335 | 317 | 334 | 260 |
| 18:4 | 293 | 259 | 241 | 333 | 315 | 332 | 258 |
| 19:0 | 315 | 281 | 263 | 355 | 337 | 354 | 280 |
| 19:1 | 313 | 279 | 261 | 353 | 335 | 352 | 278 |
| 19:2 | 311 | 277 | 259 | 351 | 333 | 350 | 276 |
| 20:0 | 329 | 295 | 277 | 369 | 351 | 368 | 294 |
| 20:1 | 327 | 293 | 275 | 367 | 349 | 366 | 292 |
| 20:2 | 325 | 291 | 273 | 365 | 347 | 364 | 290 |
| 20:3 | 323 | 289 | 271 | 363 | 345 | 362 | 288 |
| 20:4 | 321 | 287 | 269 | 361 | 343 | 360 | 286 |
| 20:5 | 319 | 285 | 267 | 359 | 341 | 358 | 284 |
| 20:6 | 317 | 283 | 265 | 357 | 339 | 356 | 282 |
| 21:0 | 343 | 309 | 291 | 383 | 365 | 382 | 308 |
| 21:1 | 341 | 307 | 289 | 381 | 363 | 380 | 306 |
| 21:2 | 339 | 305 | 287 | 379 | 361 | 378 | 304 |
| 22:0 | 357 | 323 | 305 | 397 | 379 | 396 | 322 |
| 22:1 | 355 | 321 | 303 | 395 | 377 | 394 | 320 |
| 22:2 | 353 | 319 | 301 | 393 | 375 | 392 | 318 |
| 22:3 | 351 | 317 | 299 | 391 | 373 | 390 | 316 |
| 22:4 | 349 | 315 | 297 | 389 | 371 | 388 | 314- |
| 22:5 | 347 | 313 | 295 | 387 | 369 | 386 | 312 |
| 22:6 | 345 | 311 | 293 | 385 | 367 | 384 | 310 |
| 23:0 | 371 | 337 | 319 | 411 | 393 | 410 | 336 |
| 23:1 | 369 | 335 | 317 | 409 | 391 | 408 | 334 |
| 23:2 | 367 | 333 | 315 | 407 | 389 | 406 | 332 |
| 24:0 | 385 | 351 | 333 | 425 | 407 | 424 | 350 |
| 24:1 | 383 | 349 | 331 | 423 | 405 | 422 | 348 |
| 24:2 | 381 | 347 | 329 | 421 | 403 | 420 | 346 |
| 25:0 | 399 | 365 | 347 | 439 | 421 | 438 | 364 |
| 25:1 | 397 | 363 | 345 | 437 | 419 | 436 | 362 |
| 25:2 | 395 | 361 | 343 | 435 | 417 | 434 | 360 |
Neutral loss mass from [M+NH4]+ corresponding to triacylglycerol or diacylglycerol molecular species product ions (MS/MS experiment).
Table 4.
Identified triacylglycerol molecular species by MS3 analysis of product ions formed by collisional activation of m/z 876.8 (52:2) and m/z 878.8 (52:1) in RAW 264.7 cells.
| m/z 876.8 (52:2) | m/z 878.8 (52:1) |
|---|---|
| 14:0/16:1/22:1 | 12:0/18:0/22:1 |
| 14:0/18:1/20:1 | 14:1/18:0/20:0 |
| 14:0/20:1/18:1 | 16:1/18:0/18:0 |
| 16:1/16:1/20:0 | 16:0/18:0/18:1 |
| 16:1/18:0/18:1 | |
| 16:0/14:0/22:2 | |
| 16:0/16:0/20:2 | |
| 16:0/18:0/18:2 | |
| 16:0/18:1/18:1 | |
| 16:0/22:1/14:1a | |
| 20:1/16:0/16:1 |
Low abundance
In order to assess whether or not any one of the distinct species within the parent ion was changing in relative abundance to other TAG species, it would be necessary to assess which of the corresponding isobaric molecular species indicated in the MS/MS spectrum was in fact changing. Our approach to address this issue has been to use the neutral loss scan that contained information as to the relative abundance of each component that constituted a particular [M+NH4]+ which contained one fatty acyl group. The neutral loss scan for 16:0 in this TAG extract (Figure 4) revealed those [M+NH4]+ which contain molecular species corresponding to each esterified fatty acyl group sampled by the neutral loss mass. Thus the ions at m/z 876.8 and 878.8 appeared in the neutral loss scan for 16:0 (Figure 4). Since these two precursor ions were not from the same molecular species, the relative abundances of these neutral loss precursor ions contain separate abundance information as Figures 3B and 3C suggested.
Figure 4.
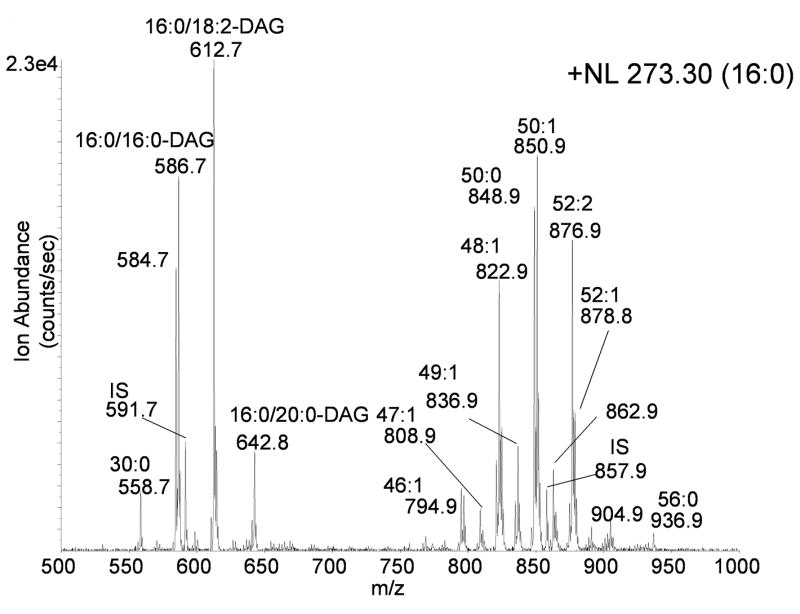
Glyceryl lipids containing palmitic acid (16:0) as revealed by the neutral loss scan for 273.3u during electrospray ionization of neutral lipids from control RAW 264.7. The identity of abundant [M+NH4]+ ions are indicated by the abbreviations for each fatty acyl group present in the diacylglycerol ions and the total number of fatty acyl carbon atoms and total number of fatty acyl double bonds present in triacylglycerol molecular species. The glyceryl lipids were isolated from RAW 264.7 cells (approximately 5 × 10⁶ cells) after treatment for 1 hr with Kdo2-lipid A to which a stock solution of D5-TAG and D5-DAG internal standards (600 pmol each internal standard) was added prior to extraction.
There was an unexpected ion in this neutral loss 273 scan at m/z 773.0, which likely arose from the 13C2-isotope ion for the internal standard d5-14:0/16:1/14:0, which generated a [M+NH4]+ at m/z 771.7, actually seen in the neutral loss scan for 16:1 neutral loss of 271u (NL 271) (data not shown). Such ions were observed in those cases where the neutral loss scan was two mass units higher than an abundant ion containing a fatty acyl group with one more double bond than the measured neutral loss scan was present in the mixture. This neutral loss was easily recognized in all cases and could be removed from further investigation.
One could assess how molecular species changed over a series of experiments, if there was a signal (neutral loss) derived from a TAG species that was constant throughout the entire experiment and report abundance relative to the constant D5-TAG. Thus, when collisional activation of [M+NH4]+ for the internal standard D5-16:0/18:0/16:0 (m/z 857.8) was analyzed, a signal in the neutral loss scan 273 u (16:0) would be observed. In the RAW cell neutral loss experiment for 273 u, an ion at m/z 857.8 was observed (Figure 4). From previous work of Evans [17,22], it was clear that absolute abundances of each neutral loss of RCOOH + NH3 from a synthetic TAG (and DAG) depended significantly on acyl position on the glycerol backbone, number of fatty acyl carbon atoms, and number of double bonds in the fatty acyl group. Thus it would not be valid to assume the abundance of each ion appearing in the neutral loss scan unambiguously indicated the quantitative measure of each component relative to the abundance of others. However, it would be a good assumption that major ion transitions come from the more abundant species.
Nevertheless, if serial experiments are performed there is quantitative information in the observed abundance of neutral loss transitions that could be used to follow changes that occur in the population of molecular species. In these cases, only two assumptions need to be made. The first is that in the experimental series being studied, the exact molecular species detected by the specific neutral loss, changes in abundance and not in structure. The second assumption is that the unique molecular species observed in the neutral loss, form the fragment ions in a reproducible fashion. There is evidence that this does occur in that the position of the acyl group largely determines abundance of the neutral fragment (17,22); therefore, if position of the fatty acyl group does not change, then abundance of the fragment ion will not change. Specifically, the relative yield of neutral loss 273 from the species 16:0/18:1/18:1 from m/z 876.8 (Figure 3B) would be constant relative to the yield of neutral loss 273 from the internal standard D5-16:0/18:0/16:0 observed at m/z 857.8. For naturally occurring complex mixtures of TAGs and DAGs, a single neutral loss ion will be a composite of a small number of unique molecular species; for example, neutral loss 273 from m/z 876.8 contains four species (Table 3), but in this case the abundance of the major ions from MS/MS studies (Figure 3B) or from MS3 data [20], indicate a single major component makes up the majority of this neutral loss of 273u (NL 273) ion and that is likely 16:0/18:0/18:1. Therefore, changes observed in the neutral loss for this ion would largely reflect changes in this unique molecular species. Thus, if an identical quantity of each internal standard was added to each extract of an experimental series, then each of the molecular species containing specific fatty acyl substituents could be followed quantitatively as they changed throughout the course of the experiment.
In order to test this hypothesis, a synthetic TAG (16:0/18:2/18:1) was added in precise quantities to equal aliquots of the TAG/DAG extract of RAW cells to which the mixture of D5-TAG internal standards had been added. The quantity of 16:0/18:2/18:1 added was 0, 0.11, 0.23, and 0.57 pmol in triplicate to separate aliquots of RAW extract for a total of 12 separate samples. After neutral loss scanning for 273 (16:0), 297 (18:2), and 299 (18:1), the signals for m/z 874 were analyzed along with the signals for the three separate D5-internal standards containing these three fatty acyl groups (16:0/18:0/16:0, m/z 857.8; 20:4/18:2/20:4, m/z 949.8; and 15:0/18:1/15:0, m/z 827.8, respectively). Each of these spiked samples generated a linear relationship for ratios of the ion abundance at m/z 874.8 divided by the abundance of the internal standard, even though three separate internal standards were used to assess the change in abundance of this single molecular species of TAG (Figure 5).
Figure 5.
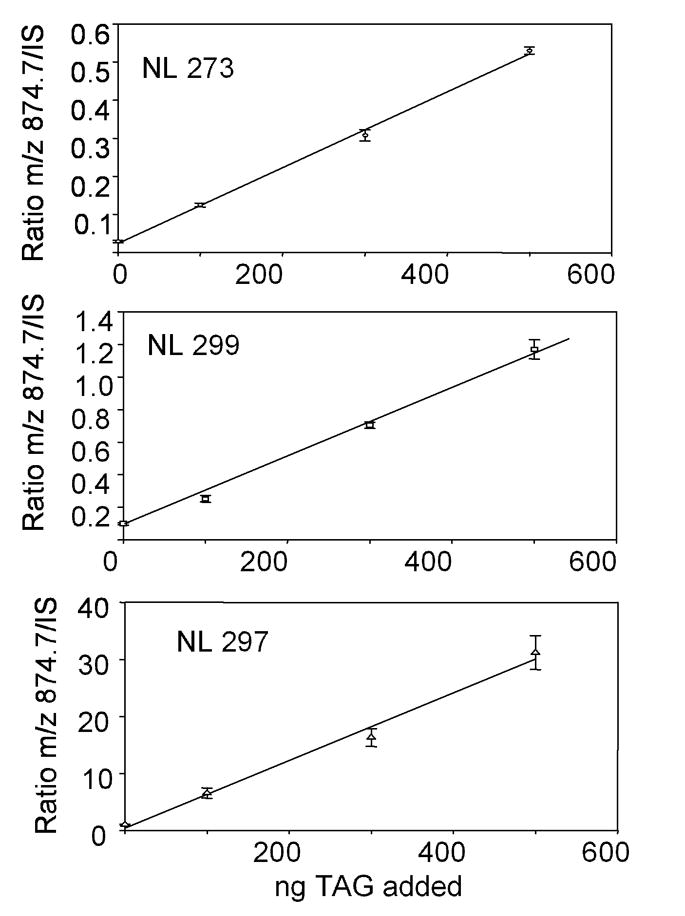
A quantity of synthetic 16:0/18:1/18:2-TAG (spike) was added to an aliquot of the RAW glyceryl lipid extract along with a constant amount of the internal standard mixture of D5-TAG molecular species. The abundance of the [M+NH4]+ at m/z 874.4 obtained in the neutral loss scan for (A) palmitate, neutral loss of 273u (NL 273), (B) oleate, neutral loss of 299u (NL 299), and (C) linoleate, neutral loss of 297u (NL 297) was divided by the abundance of the [M+NH4]+ from each internal standard and plotted as to the amount of synthetic spike added (n=3, SEM).
Simultaneous analysis of DAGs and TAGs in RAW cells by neutral loss MS
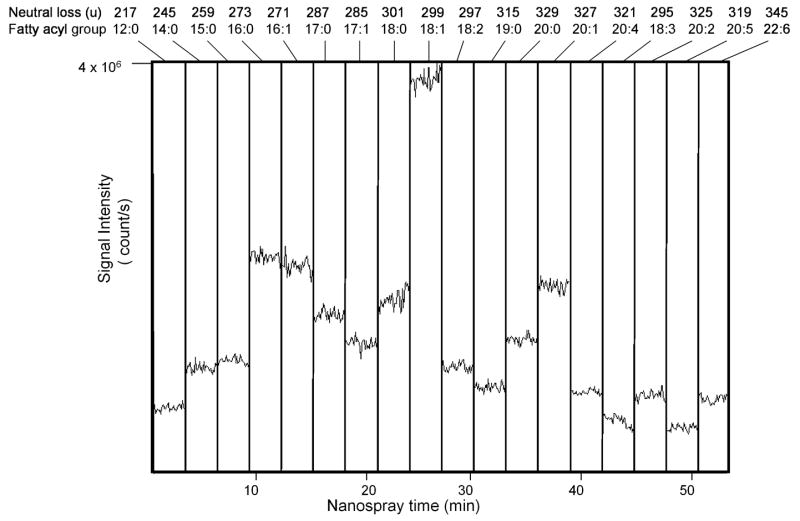
Neutral loss mass spectrometry was used to monitor any potential changes in the glyceryl lipid profile of RAW 264.7 cells upon induction by Kdo2-lipid A. The time course of induction used in this study was 0, 0.5, 2, 4, 8, 12 and 24 hr with untreated controls taken at each time point. The cell pellets were extracted by the method of Bligh and Dyer [27] and to this extract a mixture of D5-TAG and D5-DAG internal standards was added (Table 2). Each experimental condition was analyzed using the neutral loss mass spectrometric approach (Figure 6) and since D5-glyceryl labeled internal standards were present, each neutral loss ion observed could be normalized with respect to the internal standard neutral loss abundance. The abundance of all ions satisfying the unique precursor-product ion requirements for each 18 different neutral losses could be plotted relative to nanoelectrospray time (Figure 6). In this way, the relative abundance of each fatty acyl group in the total mixture could be easily observed. For example, between 9 and 12 min of nanoelectrospray time, the neutral loss of 273u was being performed to assess the abundance of those species containing 16:0 fatty acyl groups (neutral loss of C15H31COOH + NH3). The summation of these 30 scans could be viewed as a neutral loss mass spectrum, showing those precursor ions containing 16:0 fatty acyl groups (Figure 4).
Figure 6.
Abundance of [M+NH4]+ ions measured in sequential neutral loss scans of the glyceryl lipid extract from approximately 8 × 10⁶ RAW 264.7 cells to which 600 pmol of each D5-TAG and D5-DAG internal standard was added prior to extraction. Positive ion nanoelectrospay ionization was employed using the Nanomate interface on an aliquot of the sample. The setting for each neutral loss is indicated above each segment. The abundance (cps, counts per second) of the summed ion current for each neutral loss appears on the ordinate while the lapsed time of nanospray is on the abscissa.
After automatic identification of each TAG and DAG species at each of the 18 different neutral loss experiments as to total carbon atoms:double bonds and correction for 13C-isotopes using Lipid Profiler [29], the relative changes of a molecular species that contained a specific fatty acyl substituent could be assessed as a function of cell culture time and whether or not they were stimulated with Kdo2-lipid A. A specific example is the TAG 50:1 which contains only one monosaturated fatty acyl group with the most abundant isobaric molecular species containing either 18:1 or 16:1, but not both. Following stimulation and manipulation of the cells in the culture flask (control), there was a statistically nonsignificant reduction of the 18:1 containing species (Figure 7A) up to the first 4 hr of cell culture. The 18:1 containing 50:1-TAGs increased by almost 4-fold after an additional 20 hr culture only in the Kdo2-lipid A treated cells. This trend was not seen in the 16:1 containing 50:1 species (Figure 7B) which were less abundant and likely reflected turnover of TAGs in these tissue cultures with incorporation of oleate during turnover, an abundant free fatty acid in bovine serum, rather than palmitoleate. Only modest changes were observed for most other molecular species of TAGs during the 24 hr experiment paradigm (data not shown). One interesting observation was that one specific DAG increased at the early time point of Kdo2-lipid A treatment, consistent with activation of signal transduction pathways (Figure 7C) and phosphatidylinositol hydrolysis by a phospholipase C, activated by the toll-4 receptor and Kdo2-lipid A.
Figure 7.
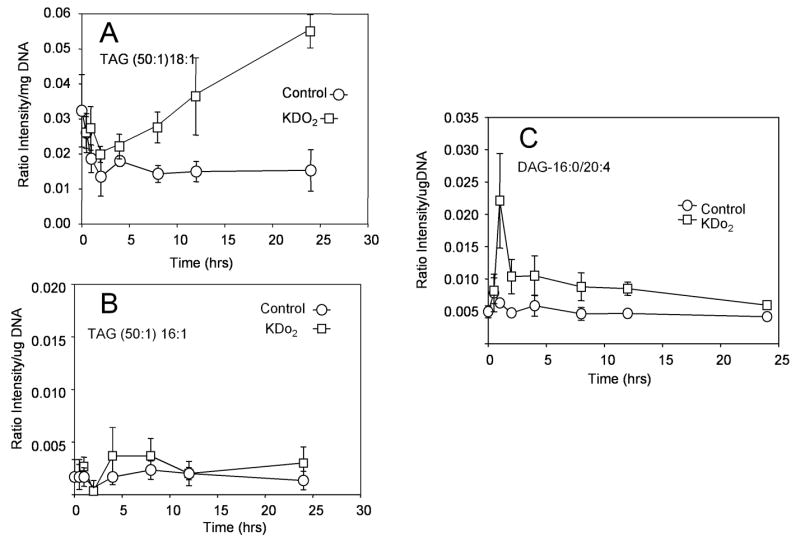
Time course of changes in absolute abundance of RAW 264.7 cell triacylglycerol and diacylglycerol molecular species following stimulation with either Kdo2-lipid A (100 nM) or not (Control) as measured by neutral loss experiments such as that in Figure 6. (A) Changes in abundance of those 50:1-TAG molecular species containing oleate (18:1). (B) Changes abundance of those 50:1-TAG molecular species containing palmitoleate (16:1). (C) Changes in abundance of those 36:4-DAG molecular species containing arachidonate (20:4). The other fatty acyl group for this DAG species would correspond to 16:0.
Discussion
The identification of neutral lipids, in particular TAGs, from biological samples has presented a considerable analytical challenge due to the complexity of the natural mixtures of molecular species particularly in cells that do not accumulate or store large quantities of neutral lipids. While approaches to separate species using HPLC are possible, a direct mass spectrometric method would eliminate the time required for on-line separation if some molecular species information could be obtained. Recent notable advances in the direct analysis of complex mixtures of TAGs have been reported. For example Wu, Rodgers and Marshall [30] recently described the complete chemical compositional characterization of various oils using ESI FT-ICR MS. We recently described a MS3 method for the direct analysis of complex mixtures of TAGs extracted from cells, using the additional dimension of mass isolation and fragmentation in MS3 experiments to define isobaric TAG molecular species in a biological extract at the level of individual esterified fatty acyl groups. We used this approach to identify molecular species of TAGs in RAW 264.7 cells; however, this required a sample extract from 2 × 10⁸ cells in order to obtain reasonable signal for the sequential product ions of MS3 experiments used to identify all fatty acyl substituents. In addition, Han and Gross reported [21] the identification of TAGs present in complex biological samples by analyzing Li+ adducts of TAGs using neutral loss mass spectrometry to identify fatty acyl chains present within each nominal [M+Li]+ ion.
Neutral loss mass spectrometry has the advantage of a high signal-to-noise ratio since only product ions which have undergone the neutral loss of interest are allowed to pass the third quadrupole and be detected. Furthermore, this single method can be used to detect both TAGs and DAGs in the presence of other molecular species. A list of characteristic neutral losses from ammoniated TAG and DAG molecular ions can easily be calculated for the fatty acyl groups commonly observed in biological sample and this information used to scan for all fatty acyl moieties of interest in a given biological sample (Table 2). In the case of DAGs, a single neutral loss spectrum provided enough information to uniquely identify the both fatty acyl substituents in a molecular species. For example, the ion at m/z 586.6 in Figure 4, had a molecular weight which corresponds to a DAG with 32 acyl carbons and no double bonds, denoted DAG (32:0), and underwent a neutral loss consistent with the presence of palmitic acid and NH3 yielding a product ion at m/z 313, consistent with a 16:0 containing monoacyl product ion. Therefore, the ion at m/z 586.6 was determined to be attributed to the DAG (16:0/16:0) molecular species. However, in the case of TAGs the situation is more complex so that only a fatty acyl profile across the complex mixture of glycerol lipids can be determined using such tandem mass spectrometric methods. Based on the fatty acyl profile, a list of possible TAGs molecular species present may be determined, which may be sufficient information to ascertain specific biochemical processes depending on the emphasis of the study, but as reported previously MS3 data is needed for unequivocal TAG identification [20]. It must be emphasized that the neutral loss approach only detects molecular species which contain the fatty acyl group of interest and so data from several neutral loss experiments are need for complete converge of the total neutral lipid profile. If a complete series of neutral loss experiments are carried out representative of the major fatty acyl groups present, redundant information is obtained based on the fact that each fatty acyl neutral loss would be an independent measure of the fate of isobaric TAGs.
While the experiments carried out here involved use of a sophisticated tandem quadrupole linear ion trap instrument equipped with a chip based nanoelectrospray interface, significantly less complex instruments can achieve the same results, but perhaps not at the same sensitivity. Previously, MS3 identification of TAG molecular species was demonstrated with normal electrospray on a linear ion trap [20]. Tandem quadrupole instruments can carry out the neutral loss scanning experiments which can be infused by normal electrospray or nanospray. The Lipid MAPS initiative has facilitated commercial development of the D5-TAG and D5-DAG internal standards so that others can readily obtain these tools for such quantitative analysis.
This approach of accurately measuring changes in specific molecular species of DAGs, and molecular species of a defined molecular weight containing a specific fatty acyl group (neutral loss scan) would be quite sensitive to TAG/DAG remodeling within a cell or tissue, but this technique would only constitute a first step in defining the role of a specific molecular species in cellular processes. In the example presented here, Kdo2-lipid A stimulation of RAW cells led to the identification of certain molecular species that quantitatively changed during the time course of toll-4 receptor stimulation. The next stage would be to uniquely identify those molecular species containing the fatty acyl group by MS3 as demonstrated here (Table 4) perhaps before and after stimulation. As previously reported, changes in fatty acyl position can significantly alter the ion yield of the loss of the fatty acyl group (17,22); thus, it would be expected that remodeling of a molecular species to an isomeric molecular species containing the same fatty acyl groups may even be detected if the fatty acyl group that undergoes the neutral loss moves from sn-1 (3) to sn-2. If remodeling of a TAG or DAG species takes place with substitution of different fatty acyl groups, there will be an increase or decrease in molecular weight with corresponding loss of neutral loss abundance or increase in neutral loss abundance.
Finally, we have found this neutral loss experiment to be quantitative as to changes in neutral lipid molecular species when stable isotope labeled internal standards were employed. The neutral loss observed for the standards described here occur at the same neutral mass loss as naturally occurring glyceryl lipids, since the isotope was placed on the glycerol carbon atoms which are not lost in the decomposition of the TAG/DAG ammonium adduct ions to the diglyceride/monoglyceride ion type.
Acknowledgments
This work was supported, in part, by the Lipid MAPS Large Scale Collaborative Grant from the National Institutes of Health (GM069338). PFJ acknowledges the receipt of a Heart Foundation Postgraduate Scholarship and a PORES Travel Scholarship.
Footnotes
Publisher's Disclaimer: This is a PDF file of an unedited manuscript that has been accepted for publication. As a service to our customers we are providing this early version of the manuscript. The manuscript will undergo copyediting, typesetting, and review of the resulting proof before it is published in its final citable form. Please note that during the production process errors may be discovered which could affect the content, and all legal disclaimers that apply to the journal pertain.
References
- 1.Coleman RA, Lee DP. Enzymes of triacylglycerol synthesis and their regulation. Prog Lipid Res. 2004;43:134–176. doi: 10.1016/s0163-7827(03)00051-1. [DOI] [PubMed] [Google Scholar]
- 2.Brown DA. Lipid droplets: proteins floating on a pool of fat. Curr Biol. 2001;5:R446–R449. doi: 10.1016/s0960-9822(01)00257-3. [DOI] [PubMed] [Google Scholar]
- 3.Liu P, Ying Y, Zhao Y, Mundy DI, Zhu M, Anderson RG. Chinese hamster ovary K2 cell lipid droplets appear to be metabolic organelles involved in membrane traffic. J Biol Chem. 2004;279:3787–3792. doi: 10.1074/jbc.M311945200. [DOI] [PubMed] [Google Scholar]
- 4.Zechner R, Strauss JG, Haemmerle G, Lass A, Zimmermann R. Lipolysis: pathway under construction. Curr Opin Lipidol. 2005;16:333–340. doi: 10.1097/01.mol.0000169354.20395.1c. [DOI] [PubMed] [Google Scholar]
- 5.Weiss R, Dziura J, Burgert TS, Tamborlane WV, Taksali SE, Yeckel CW, Allen K, Lopes M, Savoye M, Morrison J, Sherwin RS, Caprio S. Obesity and the metabolic syndrome in children and adolescents. N Engl J Med. 2004;350:2362–2374. doi: 10.1056/NEJMoa031049. [DOI] [PubMed] [Google Scholar]
- 6.Goodpaster BH, Wolf D. Skeletal muscle lipid accumulation in obesity, insulin resistance, and type 2 diabetes. Pediatr Diabetes. 2004;5:219–226. doi: 10.1111/j.1399-543X.2004.00071.x. [DOI] [PubMed] [Google Scholar]
- 7.Haemmerle G, Zimmermann R, Zechner R. Letting lipids go: hormone-sensitive lipase. Curr Opin Lipidol. 2003;14:289–297. doi: 10.1097/00041433-200306000-00009. [DOI] [PubMed] [Google Scholar]
- 8.Smirnova E, Goldberg EB, Makarova KS, Lin L, Brown WJ, Jackson CL. ATGL has a key role in lipid droplet/adiposome degradation in mammalian cells. EMBO reports. 2006;7:106–113. doi: 10.1038/sj.embor.7400559. [DOI] [PMC free article] [PubMed] [Google Scholar]
- 9.Oude Weernink PA, Han L, Jakobs KH, Schmidt M. Dynamic phospholipid signaling by G protein-coupled receptors. Biochim Biophys Acta. 2006 doi: 10.1016/j.bbamem.2006.09.012. in press. [DOI] [PubMed] [Google Scholar]
- 10.Becker KP, Hannun YA. Protein kinase C and phospholipase D: intimate interactions in intracellular signaling. Cell Mol Life Sci. 2005;62:1448–1461. doi: 10.1007/s00018-005-4531-7. [DOI] [PMC free article] [PubMed] [Google Scholar]
- 11.Large V, Peroni O, Letexier D, Ray H, Beylot M. Metabolism of lipids in human white adipocyte. Diabetes Metab. 2004;30:294–309. doi: 10.1016/s1262-3636(07)70121-0. [DOI] [PubMed] [Google Scholar]
- 12.Westerterp-Plantenga MS. Fat intake and energy-balance effects. Physiol Behav. 2004;83:579–585. doi: 10.1016/j.physbeh.2004.07.027. [DOI] [PubMed] [Google Scholar]
- 13.Ryhage R, Stenhagen E. Mass spectrometry in lipid research. J Lipid Res. 1960;1:361–390. [PubMed] [Google Scholar]
- 14.Hites RA. Mass spectrometry of triglycerides. Methods Enzymol. 1975;35:348–359. doi: 10.1016/0076-6879(75)35175-6. [DOI] [PubMed] [Google Scholar]
- 15.Hsu FF, Turk J. Structural characterization of triacylglycerols as lithiated adducts by electrospray ionization mass spectrometry using low-energy collisionally activated dissociation on a triple stage quadrupole instrument. J Am Soc Mass Spectrom. 1999;10:587–599. doi: 10.1016/S1044-0305(99)00035-5. [DOI] [PubMed] [Google Scholar]
- 16.Sjovall O, Kuksis A, Marai L, Myher JJ. Elution factors of synthetic oxotriacylglycerols as an aid in identification of peroxidized natural triacylglycerols by reverse-phase high-performance liquid chromatography with electrospray mass spectrometry. Lipids. 1997;32:1211–1218. doi: 10.1007/s11745-997-0155-4. [DOI] [PubMed] [Google Scholar]
- 17.Li X, Evans JJ. Examining the collision-induced decomposition spectra of ammoniaed triglycerides as a function of fatty acid chain length and degree of unsaturation. I. The OXO/YOY series. Rapid Commun Mass Spectrom. 2005;19:2528–2538. doi: 10.1002/rcm.2087. [DOI] [PubMed] [Google Scholar]
- 18.Byrdwell WC. Atmospheric pressure chemical ionization mass spectrometry for analysis of lipids. Lipids. 2001;36:327–346. doi: 10.1007/s11745-001-0725-5. [DOI] [PubMed] [Google Scholar]
- 19.Hvattum E. Analysis of triacylglycerols with non-aqueous reversed-phase liquid chromatography and positive ion electrospray tandem mass spectrometry. Rapid Commun Mass Spectrom. 2001;15:187–190. doi: 10.1002/1097-0231(20010215)15:3<187::AID-RCM211>3.0.CO;2-T. [DOI] [PubMed] [Google Scholar]
- 20.McAnoy AM, Wu CC, Murphy RC. Direct qualitative analysis of triacylglycerols by electrospray mass spectrometry using a linear ion trap. J Am Soc Mass Spectrom. 2005;16:1498–1509. doi: 10.1016/j.jasms.2005.04.017. [DOI] [PubMed] [Google Scholar]
- 21.Han X, Gross RW. Quantitative analysis and molecular species fingerprinting of triacylglyceride molecular species directly from lipid extracts of biological samples by electrospray ionization tandem mass spectrometry. Anal Biochem. 2001;295:88–100. doi: 10.1006/abio.2001.5178. [DOI] [PubMed] [Google Scholar]
- 22.Li X, Collins EJ, Evans JJ. Examining the collision-induced decomposition spectra of ammoniated triglycerides as a function of fatty acid chain length and degree of unsaturation. II. The PXP/YPY series. Rapid Commun Mass Spectrom. 2006;20:171–177. doi: 10.1002/rcm.2270. [DOI] [PubMed] [Google Scholar]
- 23.Murphy RC. Mass Spectrometry of Lipids: The Handbook of Lipid Research. Plenum Press; New York: 1993. [Google Scholar]
- 24.Sparagna GC, Johnson CA, McCune SA, Moore RL, Murphy RC. Quantitation of cardiolipin molecular species in spontaneously hypertensive heart failure rats using electrospray ionization mass spectrometry. J Lipid Res. 2005;46:1196–1204. doi: 10.1194/jlr.M500031-JLR200. [DOI] [PubMed] [Google Scholar]
- 25.Raetz CRH, Garrett TA, Reynolds CM, Shaw WA, Moore JD, Smith DC, Jr, Ribeiro AA, Murphy RC, Ulevitch RJ, Fearns C, Reichart D, Glass CK, Benner C, Subramaniam S, Harkewicz R, Cooper JA, Deems RA, Dennis EA. Purification and properties of Escherichia coli Kdo2-lipid A, a defined endotoxin that activates macrophages via TLR-4. J Lipid Res. 2006;47:1097–1111. doi: 10.1194/jlr.M600027-JLR200. [DOI] [PubMed] [Google Scholar]
- 26.Ahn SJ, Costa J, Emanuel JR. PicoGreen quantitation of DNA: effective evaluation of samples pre- or post-PCR. Nucleic Acids Res. 1996;24:2623–2625. doi: 10.1093/nar/24.13.2623. [DOI] [PMC free article] [PubMed] [Google Scholar]
- 27.Bligh EG, Dyer WJ. A rapid method of total lipid extraction and purification. Can J Biochem Physiol. 1959;37:911–917. doi: 10.1139/o59-099. [DOI] [PubMed] [Google Scholar]
- 28.Ingalls ST, Kriaris MS, Xu Y, DeWulf DW, Fserng KY, Hoppel CL. Method of isolation of non-esterified fatty acids and several other classes of plasma lipids by column chromatography on silica gel. J Chromatogr Biomed Appl. 1993;619:9–19. doi: 10.1016/0378-4347(93)80441-6. [DOI] [PubMed] [Google Scholar]
- 29.Ejsing CS, Duchoslav E, Sampaio J, Simons K, Bonner R, Thiele C, Ekroos K, Shevchenko A. Automated identification and quantification of glycerophospholipid molecular species by multiple precursor ion scanning. Anal Chem. 2006;78:6202–6214. doi: 10.1021/ac060545x. [DOI] [PubMed] [Google Scholar]
- 30.Wu Z, Rodgers RP, Marshall AG. Characterization of vegetable oils: detailed compositional fingerprints derived from electrospray ionization fourier transform ion cyclotron resonance mass spectrometry. J Agric Food Chem. 2004;52:5322–5328. doi: 10.1021/jf049596q. [DOI] [PubMed] [Google Scholar]


