

Summary
Synthetic oligonucleotides (oligos) represent an attractive alternative to cDNA amplicons for spotted microarray analysis in a number of model organisms, including Arabidopsis, C. elegans, Drosophila, human, mouse and yeast. However, little is known about the relative effectiveness of 60 –70-mer oligos and cDNAs for detecting gene expression changes. Using 192 pairs of Arabidopsis thaliana cDNAs and corresponding 70-mer oligos, we performed three sets of dye-swap experiments and used analysis of variance (ANOVA) to compare sources of variation and sensitivities for detecting gene expression changes in A. thaliana, A. arenosa and Brassica oleracea. Our major findings were: (1) variation among different RNA preparations from the same tissue was small, but large variation among dye-labellings and slides indicates the need to replicate these factors; (2) sources of variation were similar for experiments with all three species, suggesting these feature types are effective for analysing gene expression in related species; (3) oligo and cDNA features had similar sensitivities for detecting expression changes and they identified a common subset of significant genes, but results from quantitative RT-PCR did not support the use of one over the other. These findings indicate that spotted oligos are at least as effective as cDNAs for microarray analyses of gene expression. We are using oligos designed from −26 000 annotated genes of A. thaliana to study gene expression changes in Arabidopsis and Brassica polyploids.
Keywords: 70-mer oligo, analysis of variance (ANOVA), Arabidopsis, Brassica, dye-swap, microarray
Introduction
DNA microarrays provide an exceptional tool to measure and quantify the expression of thousands of genes in a single experiment (Schena et al., 1995; Schena et al., 1998). Current platforms for high-density microarrays include the direct synthesis of oligonucleotides (oligos) (usually 15–20-mers) on glass substrates using photolithography (Fodor et al., 1991), micromirror (Singh-Gasson et al., 1999) or inkjet devices (Hughes et al., 2001), or the deposition of DNA samples on to glass substrates using a spotting robot (Schena et al., 1995). Spotted microarrays have some advantages over direct synthesis microarrays, including greater versatility (researchers can make and design their own microarrays, selecting the DNA sources to spot) and lower cost, especially for studies involving a large number of experiments.
Amplified products of cDNA inserts from expressed sequence tags (ESTs) are commonly used as a source of samples for spotted microarrays (DeRisi et al., 1997; Schena et al., 1995), although several technical difficulties are often associated with using this source (Finkelstein et al., 2002). First, mismatches of cDNA clones and EST sequences in the database can be common, as high as 38% (Knight, 2001), due to tracking errors or contamination. Second, the tracking and quality tests of amplified products can be tedious and difficult to manage. Third, cDNAs may not distinguish among members of multigene families, related genes, and differentially spliced genes. Finally, current EST collections represent only 25–50% of the predicted genes in a genome.
An alternative source of DNA samples for spotted microarrays are long synthetic oligos (~50–70-mers) designed from ESTs or annotated genome sequences. Synthetic oligos have advantages over cDNAs because they avoid the need to track clones and amplicons, and they can be designed to have a uniform sequence length (ensuring more uniform hybridization) and high specificity for distinguishing related DNA sequences. Sets of long oligos have been developed using information from all annotated genes of complete genome sequences for several model organisms, including yeast, Drosophila, human, mouse, and Arabidopsis (http://www.operon.com/arrays/omad.php).
An important question regarding the use of oligos in microarray experiments is how they compare to cDNAs for detecting gene expression differences.Wang et al. (2003)compared cDNA and 70-mer oligos of 75 rat genes for the detection of gene expression differences in two rat tissues (Wang et al., 2003). The accuracy of the two feature types was compared to quantitative RT-PCR (QRT-PCR) for detecting expression differences, and the authors concluded that cDNAs more closely reflected results from QRT-PCR. Although they stated that oligos provided acceptable sensitivity and specificity for most genes studied, the authors did not compare oligos to cDNAs for their sensitivity in detecting expression differences on a per-gene basis (Black and Doerge, 2002; Black, 2002) (that is, determining the relative magnitudes of variation associated with each gene for each type of feature). Sensitivity is important for identifying significant fold-changes in gene expression studies, and it must be determined within the context of the design used for an experiment.
In this paper, we show the results of a microarray study comparing 192 pairs of oligo and cDNA features for analysing changes in gene expression in Arabidopsis and Brassica. Our objectives were to: (1) compare sources of variation associated with elements of the statistical design in the microarray experiments, (2) compare sources of variation for the experiments using the same set of features to detect gene expression in related species (A. thaliana, A. arenosa and B. oleracea), and (3) compare the sensitivity of cDNA and oligo features for detecting gene expression changes.
Results
We conducted three sets of dye-swap experiments. Within each set of experiments, we analysed individual dye-swap experiments separately by analysis of variance (ANOVA) including data for 183 of 192 genes (nine genes were omitted because of wrong clone identity). A set of 96 genes in the control plate was not analysed because the controls and data normalization were not needed in the linear model (Black and Doerge, 2002; Kerr and Churchill, 2001). The portions of variation attributed to factors in the model are reported as mean squares in bar plots for each set of experiments. For the third set of experiments comparing A. thaliana leaf and flower bud RNAs, we also show mean fold change for the 183 genes analysed, as well as the results from assaying the target DNA with oligo and cDNA features, separately. The changes in expression of some genes detected by these microarrays were compared to results from quantitative RT-PCR.
Comparison of the sources of variation for different RNA preparations
In the first set of experiments, three RNA preparations (RNA1, RNA2 and RNA3) from three bulk samples of A. thaliana leaves, and a bulk of the three preparations (RNA123) were used as targets in four dye-swap experiments: RNA1 vs. RNA2, RNA1 vs. RNA3, RNA2 vs. RNA3 and RNA123 vs. RNA123). Each experiment included three dye-swaps using six slides, providing a total of 13 176 data points per experiment (183 genes × 2 feature types ×2 dyes × 6 slides × 3 replicates per slide).
The portions of variation attributable to factors in the model were similar for all four experiments (shown as mean squares in Figure 1) and the unexplained portion of total variation (random error) was small in each experiment (13–20% of total sums of squares). The residual plots (data not shown) for the error variation demonstrate a non-random residual pattern for all four experiments that is due to larger residuals for smaller expression values (i.e. funnel shaped). Typically, smaller gene expression values have more variation in their intensities, and as such can only be accurately assessed via replication. The most significant sources of variation were due to slide (S), dye (D), feature type (F, oligo or cDNA), and gene (G) (Figure 1). The large slide and dye effects highlight the importance of including these factors (and their interactions with genes) in the model, because otherwise this variation would have contributed to random error and reduced our ability to detect significant fold changes in gene expression. The large gene effect (G) was expected because the 183 genes analysed were expected to have a wide range of expression levels. Feature type (oligo vs. cDNA) and FG (feature-by-gene interaction) also made a large and significant contribution to total variation. Inspection of mean log-fold changes for the four dye-swap experiments (data not shown) revealed that cDNAs had a greater signal than oligos for most genes (accounting for the significant feature effect), but for some genes cDNAs detected less signal than oligos (accounting for the significant FG effect). These results indicate that the two feature types detected significantly different levels of expression for some genes (to be addressed further below).
Figure 1.

Bar plots showing the mean squares from analysis of variance for the RNA1 vs. RNA2, RNA1 vs. RNA3, RNA2 vs. RNA3, and RNA123 vs. RNA123 microarray experiments. The parameters in the models (and the degrees of freedom) were: S = slide (5), D = dye labelling (1), T = target (1), F = feature type (1), G = gene (183), and the interactions of these effects.
The target effect (T, RNA sample vs. RNA sample) was small and significant only for RNA1 vs. RNA2 and RNA123 vs. RNA123, and the TG (target-by-gene interaction) effect was small and non-significant for all of the dye-swap experiments (Figure 1). The null hypothesis tests (T and TG combined) were non-significant for all of the four experiments and only four genes showed significant mean log-fold changes across all of the experiments (out of 183 × 2 × 4 = 1464 tests) using a significance level of 0.01. The target (T) effect was included in the hypothesis tests because the average target effect differed between RNA samples (for a full discussion see Black, 2002). These results indicate that the use of multiple RNA preparations accounted for very little variation in our experiments, and that testing a single bulk of multiple RNA preparations gave similar results to testing different single RNA preparations.
Comparison of sources of variation for targets from related species
In the second set of experiments, separate dye-swap experiments were conducted for targets from A. arenosa and B. oleracea using a single RNA preparation from leaves of each genotype. For each species, two dye-swaps were performed using four slides. The ANOVA revealed a similar partitioning of variation which was attributable to factors in the model (Figure 2) as was observed in the A. thaliana experiments (Figure 1). Slide effects (S) were large and significant in both experiments, as was the dye effect (D) in the A. arenosa experiment. The dye effect was not significant in the B. oleracea experiment, perhaps due to a chance sampling of similar dye labelling reactions. Large gene effects were observed for both the A. arenosa and B. oleracea experiments (Figure 2), similar to the A. thaliana experiments, suggesting that features based in A. thaliana gene sequences revealed a wide range of expression levels in the related species. The feature type (F) and the feature-by-gene interaction (FG) effects were significant in both experiments. Plots of the mean log-fold changes (data not shown) comparing the two feature types (cDNAs and oligos) were similar to those from the A. thaliana experiments, showing that cDNAs generally had higher signals than oligos, but cDNAs for some genes had a lower signal than oligos. The variation for the target effect (T) was small but significant for both experiments, the TG effects were not significant, and the null hypothesis tests were not significant. An important observation was that the unexplained portion of the total variation for these two experiments was small (11–13%) and similar to the A. thaliana experiments (13–20%), and the residual plots were similar for the two sets of experiments. Thus, the experiments using microarrays based on A. thaliana gene sequences had similar power for detecting significant effects on gene expression in all three species.
Figure 2.

Bar plots showing the means squares from analysis of variance for the Arabidopsis arenosa and Brassica oleracea microarray experiments. The parameters in the models (and the degrees of freedom) were: S = slide (3), D = dye labelling (1), T = target (1), F = feature type (1), G = gene (183), and the interactions of these effects.
Comparison of cDNA and oligo features for sensitivity in detecting gene expression changes
In the third set of experiments, two subsets of dye-swap experiments were conducted in order to compare the sensitivity of cDNA and oligo features for detecting gene expression changes between leaves and flower buds of A. thaliana. Single RNA preparations from each tissue were used and the targets were hybridized to six slides for each experiment (three dye-swaps). The first subset of dye-swap experiment utilized slides prepared as before, including an extra denaturation step [submersion in 95 °C distilled water for 2 min, as recommended by Eisen and Brown (1999) for slides containing cDNA amplicon features]. The second subset of dye-swap experiments utilized slides prepared without this extra denaturation step.
In the first subset of dye-swap experiments (denatured features) the partitioning of variability due to factors in the model (Figure 3a) was similar to previous experiments (Figures 1 and 2), except that variation due to the target (T) and TG effects were much larger and significant, and the test of the null hypothesis (T and TG combined) also was significant. These results were expected because many genes should have different expression levels in the two different tissues tested. The variation due to feature type (F) and FG also were significant, indicating that cDNA and oligo features detected different changes in gene expression between the two targets.
Figure 3.

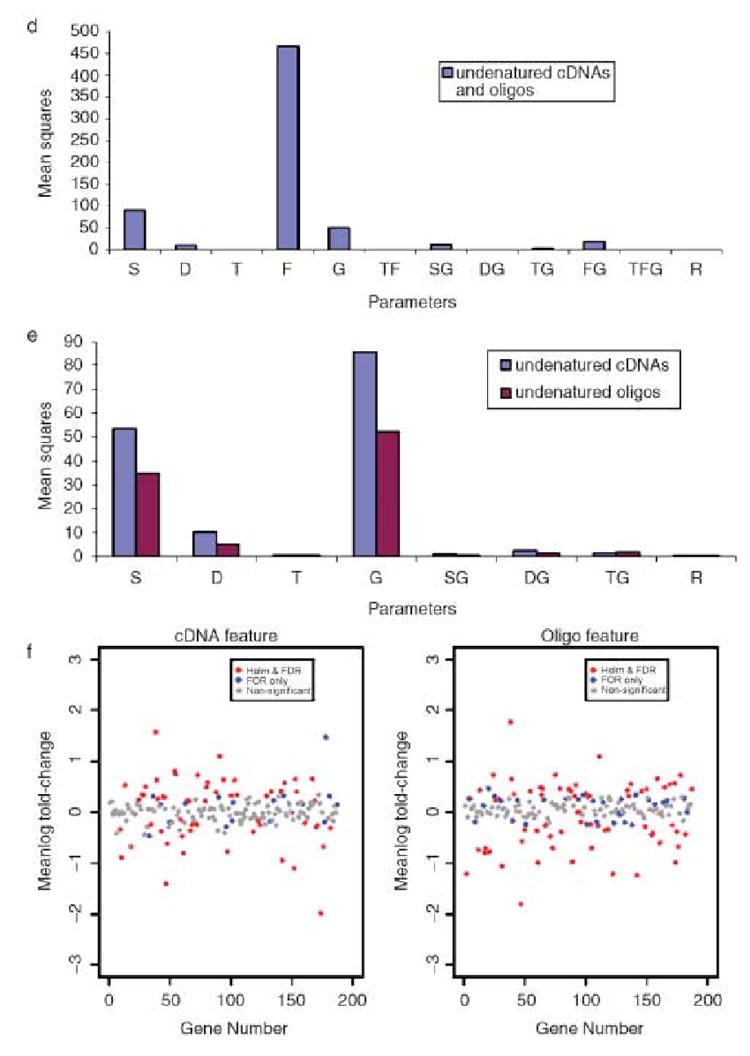
Bar plots showing the mean squares from analysis of variance of microarray experiments using 183 gene sequences and target RNAs isolated from Arabidopsis thaliana leaves and flower buds. (a) denatured cDNA and oligo features in the analysis, (b) denatured cDNA and oligo features analysed separately, and (c) scatter plot of mean log fold-changes (leaves /flower buds) for cDNA and oligo features analysed separately. (d), (e) and (f) are the same as above, but for sets of experiments with undenatured cDNA and oligo features. The parameters in the models (and the degrees of freedom) were: S = slide (5), D = dye labelling (1), T = target (1), F = feature type (1), G = gene (183), and the interactions of these effects.
Data for the two feature types (cDNA and oligo) were analysed separately (Figure 3b). Although the portion of variation due to T and TG effects were similar for the two feature types, the oligo features had twice as large a random error and a residual plot with a larger cloud of points compared to the cDNA features (data not shown). Thus, the denatured oligo features were less sensitive for detecting changes in gene expression than were the denatured cDNA features. Fewer significant gene expression changes were identified by the denatured oligo features (Figure 3c and Table 1).
Table 1.
Numbers of genes (out of 183) with significant changes (based on Holm and FDR criteria, significance level α = 0.01) detected by cDNA and oligo features (denatured and un-denatured) and numbers of genes with significant changes in common detected by the two features
| Denatured | Un-denatured | |||||
|---|---|---|---|---|---|---|
| cDNA | Oligo | Common | cDNA | Oligo | Common | |
| Holm | 67 | 20 | 16 | 58 | 69 | 27 |
| FDR | 79 | 37 | 28 | 75 | 99 | 46 |
Oligos are single stranded and do not require denaturation, and the extra boiling step may have adversely affected their performance more so than it did the cDNAs, which have longer sequences and probably bind more securely to the slides. This step may also not be required for cDNA amplicons, since they are probably denatured in the baking step (80 °C for 1 h) (Eisen and Brown, 1999). In the second subset of dye-swap experiments, the slides were not denatured using boiling water. The ANOVA revealed significant effects due to feature type (F) and feature-by-gene interaction (FG), but these effects were significantly less than when compared to the denatured equivalent (Figure 3a,d).
Data from each undenatured feature type (cDNA and oligo) were analysed separately (Figure 3e). For the undenatured cDNA features, the partitioning of variance was similar to those of the denatured cDNA features, except that the mean squares for the target (T) parameter were much smaller and not significant. Hypothesis testing resulted in approximately the same number of genes, with significant changes in expression being detected as for the denatured cDNA features (Figure 3c,f, Table 1). There were several noticeable differences in the ANOVA of data from the undenatured oligo features compared to the ANOVA of data from the denatured oligo features. The slide and dye effects were much smaller, although still highly significant (Figure 3b,e). Most importantly, the random error was much smaller (~sevenfold) and the residual plot was a tighter cloud. Thus, the undenatured oligo features were much more sensitive and detected more genes with significant changes in expression than did the denatured oligo features (Figure 3c,f). The undenatured oligos also had a smaller error variance than the denatured or undenatured cDNA features and they detected more genes with significant expression changes than either of these cDNA features (Table 1).
The extra denaturation step had deleterious effects on the sensitivity of the oligo features and it did not appear to be needed for effective hybridization to the cDNA features, since similar results were obtained for these features, both with and without denaturation. Thus, we used results from the dye-swap experiment with the undenatured features to make gene-specific comparisons. In this experiment, only about one-third of the significant genes detected by both feature types were common between the two feature types (Table 1). To further investigate differences between these feature types in the detection of gene expression changes, we conducted quantitative RT-PCR (QRT-PCR) analyses on a subset of genes for which the two feature types gave either similar or different results. Among 16 genes analysed, six showed similar fold changes in gene expression for the three detection methods (Figure 4a). For four genes, the results were similar between oligo microarray and QRT-PCR analyses but slightly different from the cDNA microarrays (Figure 4b). Two genes had similar results between cDNA microarray and QRT-PCR analyses and different results from the oligo microarrays (Figure 4c). The remaining four genes showed similar results between oligo and cDNA microarray, but different results from QRT-PCR analysis (Figure 4d).
Figure 4.

Bar plots comparing gene expression changes between Arabidopsis thaliana leaves and flower buds detected by microarrays with ‘undenatured’ cDNA features, undenatured oligo features, and quantitative RT-PCR (QRT-PCR). Results show fold-change of expression ratios (flower buds vs. leaves; F/L) obtained from six replications in the cDNA and oligo microarray and 3 replications from QRT-PCR, and are grouped into four categories: (a) similar results for cDNA, oligo and QRT-PCR (b) similar for oligos and QRT-PCR, but different for cDNA (c) different for cDNA and oligos, but similar for cDNA and QRT-PCR (d) similar result for cDNA and oligo but different for QRT-PCR.
Discussion
Our first set of experiments was conducted to investigate the sources of variation in microarray experiments using two feature types, cDNA and oligos. The results showed very little variation among RNA preparations from a single tissue sample (A. thaliana leaves), as indicated by the small target effects and target-by-gene effects in the model. This suggests that there is little need to replicate this factor in microarray experiments. However, the variation among RNA preparations should be evaluated in each laboratory because it could differ depending on the tissue source and the protocols used to collect tissue and isolate RNA (Finkelstein et al., 2002). One alternative to testing multiple individual preparations is to bulk several preparations prior to labelling and hybridization. This approach would not obscure a large source of variation and it gave very similar results to the use of multiple individual preparations in our experiments.
The largest sources of variation in these experiments were among slides, dye labellings and feature types. Variation due to slide and dye labelling can be sampled by replicating these factors and can be partitioned from other sources of variation in the model (Black and Doerge, 2002; Kerr and Churchill, 2001). In addition, it may be possible to improve labelling efficiency and reduce the incorporation bias of the two dyes using different labelling methods, such as aminoallyl dye coupling (Randolph and Waggoner, 1997) or dendritic nucleic acid structures (Nilsen et al., 1997; Stears et al., 2000). However, for some unknown reasons, the dendrimer molecules bind randomly to some oligos in our hands (data not shown). The effects of slide and dye labelling do not appear to be gene-specific because the slide-by-gene and dye-by-gene interaction effects were small and not significant. The large feature effect was due to overall higher signal detection of targets by cDNA features, probably due to their longer sequence length. However, this difference was small; most oligos showed hybridization signals that were > 90% of their corresponding cDNA feature. The feature-by-gene interaction was significant in all of the dye swap experiments of this set, indicating that cDNA and oligo features detected different magnitudes of expression changes for different genes. These discrepancies were investigated further in the third set of experiments comparing gene expression changes in leaves and flower buds.
In the second set of experiments, we investigated sources of variation in gene expression analyses of two related species using the two feature types designed from the A. thaliana gene sequences. The majority of the A. thaliana 70-mer oligos were designed within 1000 bp of the 3′ end of cDNAs or predicted genes. This may provide a higher level of specificity than cDNAs for detecting members of gene families, including paralogous genes; however, it should not be too high if oligos are to be effective in related species. Recent studies indicate that Brassica and Arabidopsis orthologues share higher similarities than Arabidopsis paralogues (Lukens et al., 2003). The percentages of sequence identities in the coding sequences are > 95% between A. thaliana and A. arenosa (Hanfstingl et al., 1994; Henikoff and Comai, 1998; Lee and Chen, 2001) and > 85% between A. thaliana and Brassica (Cavell et al., 1998). These high percentages of sequence identities suggest that the majority of cDNAs and oligos will cross-hybridize with A. arenosa and Brassica cDNAs, although Brassica and Arabidopsis diverged at ~20 mya and A. thaliana and A. arenosa at ~5.8 mya (Koch et al., 2000, 2001). Indeed, the hybridization intensities detected for A. arenosa and B. oleracea targets were almost as high as those detected in A. thaliana. Our results showed similar a partitioning of variation among experiments with the three species (Figures 1 and 2), indicating a common utility of the Arabidopsis cDNA and 70-mer oligo features for gene expression analyses in these species. Given that A. thaliana and its wild relatives are model systems for studies in ecology and evolution (Hall et al., 2002; Koch et al., 2001; Mitchell-Olds and Clauss, 2002), Arabidopsis oligo-gene microarrays may have a wide applicability in the Brassicaceae. The Arabidopsis cDNA microarrays have been shown to hybridize well with probes prepared from Brassica napus (Girke et al., 2000) and to detect 23 – 47% of the features in some distantly related plant species (Horvath et al., 2003). Microarray-based expression studies on Drosophila, C. elegans and yeast have been successfully applied to assess the variation of gene expression among different populations in related taxa (Rifkin et al., 2003; Townsend et al., 2003; reviewed in Hartl et al., 2003).
The third set of experiments were designed and analysed to compare the sensitivities of cDNA and oligo features for detecting gene expression changes in the leaves and flower buds of A. thaliana. We found that cDNAs were more sensitive than oligos when an extra denaturation step (boiling for 2 min) (Eisen and Brown, 1999) was used in preparing the slides. When this step was omitted, oligos were more sensitive than cDNAs. This boiling step did not appear to have any effect on the detection of gene expression changes by cDNA features. Apparently, it was not needed for creating single stranded cDNAs, probably because the baking step had already done this, and it did not increase the error variance, because the cDNA strands were long enough to remain fixed to the slides during boiling. The boiling step had a large effect on increasing the error variance of oligo features, perhaps because their short length caused a less stable fixation to the slides. Moreover, although the hybridization buffer used did not include a denaturing agent, the baking step and oligo design software ensured the minimum formation of secondary structure that may affect hybridization intensities. Thus, the difference in the number of significant genes detected by 70-mer oligos and cDNA amplicons (see below) reflected a difference in sensitivity and specificity of the two feature types in microarray experiments.
A comparison of the differentially expressed genes detected by the two feature types revealed a common set of genes that included about one-third of all significant gene expression changes detected by both feature types (Table 1). Although some genes that were uniquely detected by one feature type may have been just under the significance threshold, at any particular threshold level each feature type will identify a different, overlapping set of genes having changes in expression in two targets. Comparison of a subset of genes using quantitative RT-PCR did not resolve this discrepancy. The changes in gene expression detected by these three methods were similar for approximately one-third of the subset analysed, but different for the remainder (Figure 4). The results from quantitative RT-PCR did not support the use of one feature type over the other for microarray analyses of gene expression changes. In a previous investigation on changes in gene expression in rat tissues, Wang et al. (2003) reported that quantitative RT-PCR results more closely matched results from cDNA features than results from oligo features; however, the method for denaturating the features was not described (Wang et al., 2003).
The actual levels of specific mRNAs in any given tissue cannot be determined; they can only be estimated using various assay methods (Dudley et al., 2002; Wang et al., 2002; Yuen et al., 2002). Quantitative RT-PCR has advantages over hybridization methods because the primers used for amplification can be designed for a higher specificity than hybridization probes. However, results from quantitative RT-PCR can have large error variances for some genes and the estimates obtained may not reflect actual mRNA levels. This method also is impractical for screening a large number of genes. Other assays such as AFLP-cDNA display (Bachem et al., 1996), serial analysis of gene expression (SAGE) (Velculescu et al., 1995, 1997) and massively parallel signature sequencing (MPSS) (Brenner et al., 2000) can also be used for quantitative analysis of genome-wide transcription profiles; however, the techniques require a series of procedures involving adaptor ligation, PCR amplification and the sequencing or in vitro cloning of various signatures on to microbeads. Microarrays are one of the best current methods for assaying the expression changes of many genes. Spotted oligo microarrays have advantages over cDNA microarrays because of their greater uniformity, lower chances for errors, and greater ease of handling (Knight, 2001). However, oligos may compromise hybridization intensities because of the relatively short length of each oligo. Indeed, the overall hybridization intensities of 70-mer oligo-array (Wang et al., 2003) and Affymetrix chips (~20 mers) are often low. A general rule is that longer oligos have a higher sensitivity but lower specificity. In a previous study, Relogio et al. (2002)showed that 60-mers had sevenfold more sensitivity but ~fourfold lower specificity than corresponding 25-mers. In our study, 70-mer oligos had over 90% of the hybridization intensities compared to corresponding cDNAs for the majority of genes (Figure 4). More importantly, our results indicate that microarrays spotted with 70-mer oligos are at least as sensitive as those spotted with cDNA amplicons, based on a comparison of error variances and numbers of significant features detected. Oligos based on ~26 000 annotated genes from the Arabidopsis genome sequence are available, and we are using these to study gene expression changes in synthetic polyploids of Arabidopsis and Brassica species.
Experimental procedures
Oligonucleotide design, amplification and verification of EST clones
Oligos were designed for 192 Arabidopsis genes using multiple BLAST searches against annotation databases in GENBANK and from The Institute for Genomic Research (TIGR;http://www.tigr.org/tdb/agi/February2002). A set of 96 genes was chosen to represent genes that are expressed in various tissue types and at different levels, and another set of 96 genes was chosen to represent genes that play important roles in plant development (chromatin and transcription factors, kinases, and flowering time regulators) (Arabidopsis Genome Initiative, 2000). Sequence lengths of 70 nucleotides with similar melting temperature (± 2 °C) were selected within 1000 nucleotides of the 3′ end of predicted coding sequences using the software developed by Operon/Qiagen (Alameda, CA), ProbeSelect (Li and Stormo, 2001), or Featurama (http://probepicker.sourceforge.net/). The 70-mer oligos, with aminolinkers at the 5′-C6, were synthesized by Operon/Qiagen. Gene names and GENBANK accession numbers of the 192 selected genes and their corresponding ESTs and 70-mer oligo sequences can be found on our website (http://micro-arrayabc.tamu.edu/microarray/pilotset.htm ).
The cDNA clones for 153 of the selected genes were obtained from the Arabidopsis Biological Resources Center (ABRC) or the Kazusa DNA Research Institute (KDRI), Japan. The remaining 39 genes did not have matching ESTs in public databases, and for these genes, corresponding genomic fragments were amplified by PCR using primers matching the last exon of the predicted coding sequences. cDNA and genomic DNA sequences were amplified by PCR using 1–2 ng of plasmid DNA or 50 ng of genomic DNA added to 100 μL PCR mixture containing 0.2 mM each nucleotide, 1 μM each primer, 1.5 mM Mg2+ and five units of Taq polymerase (Promega, Madison, WI). Sequences were amplified using 40 cycles (94 °C for 30 s, 42 °C for 30 s, 72 °C for 2 min) with an initial denaturation step at 94 °C for 2 min and a final extension at 72 °C for 5 min. After PCR, a 5 μL aliquot of the reaction was electrophoresed on a 1.0% (w/v) agarose gel to check for amplification and anticipated fragment sizes. The PCR products were then purified using QIAquick-96 columns (Qiagen, Chatsworth, CA). The total yield of each PCR amplification was 5–10 μg, with fragment sizes of 0.5–2 kb. To verify the identity of cDNA clones, we sequenced purified PCR products using the dideoxy chain termination method (Sanger et al., 1977) on an ABI 377 sequencer. Approximately 16% of cDNA clones from ABRC or KDRI did not match the sequence assigned to these clones in databases, or they had more than one insert. About 11% of those were replaced with PCR-amplified genomic fragments as described above. The remaining 5% (or nine cDNAs) with wrong clone identity were spotted on the slides, but data from these genes were not analysed. These results are in agreement with previous reports on different species, which showed that a high portion of clones in EST collections are mislabelled or contaminated (Knight, 2001).
Microarray fabrication and slide preparation. The oligos were delivered lyophilized in 96-well formats and were re-suspended in 20 μL printing solution (3× SSC) to yield a 30 μM oligo solution. The amplified cDNAs were precipitated and dissolved in the printing solution to a final concentration of 200 μg /mL. Oligos and cDNAs were printed on to poly L-Lysine-coated slides (CEL Associates, Houston, TX) with a 350 μm space between the centre of spots using an Omni-Grid Accent Microarrayer (GeneMachines, San Carlos, California). Each slide contained three replicates of 576 features printed in three blocks. Each replicate contained 192 oligos and 192 corresponding cDNAs, and an additional 96 samples (double spotted in each replicate) from a control plate containing 50 Brassica cDNA, 30 Arabidopsis cDNAs, and 16 standard controls for microarray experiments. The 96 features from the control plate were not analysed in this study. The printing patterns for the three replicates within a slide were identical, but four printing patterns were created among slides by changing the order of the plates such that each sample was printed using a different pin in each printing pattern. The DNA elements in each plate were arranged within a plate so that the oligo and corresponding cDNAs were printed in matched rows or columns within a replicate (e.g. oligo in row 1, cDNA in row 3 for pattern 1, and oligo in row 2 and cDNA row 4 for pattern 2). The resulting slides each contained 1728 spots (576 × 3) in an area of 18 × 30 mm.
After printing, the slides were treated as described previously (Eisen and Brown, 1999). Briefly, slides were placed (DNA side down) over steaming 1× SSC, then baked (DNA side up) at 80 °C for 1 h, followed by UV-cross-linking at 150–300 mJ using 1800 Stratalinker (Stratagene, La Jolla, California). The bound DNA was denatured for 2 min in distilled water at 95 °C, although this step was omitted for one experiment, as described in the results. The slides were rinsed briefly with 95% (w/v) cold ethanol for 30 s and quickly dried by centrifugation (5 min at 500 r.p.m.). The slides were used immediately or stored in a humidity-controlled container (10 –20% r.h.).
Plant materials and RNA preparation
RNA was isolated from three genotypes, Arabidopsis thaliana Landsberg (Ler), A. arenosa (Car-1, pink flower), and Brassica oleracea (TO1000DH3) (seed stocks are available from the Arabidopsis Biological Resource Center, http://www.arabidopsis.org/abrc/). The plants were grown as previously described (Chen et al., 1998; Madlung et al., 2002). Briefly, seeds were germinated on soil-less peat mix (Sunshine no. 5), cold-treated for 5 days at 4 °C (except B. oleracea) and then transferred to a growth chamber (22 °C ± 3 °C, 16 h photoperiod from TL80 fluorescent bulbs, Philips, Eindhoven, the Netherlands). For the first set of experiments comparing RNA preparations, 100 seeds were planted on the same day, and after 3 weeks, 60 plants were randomly selected and the second true leaf was excised from each plant. Three pools of 20 leaves were created and frozen in liquid nitrogen. For the other experiments, rosette leaves were collected 3 – 4 weeks after germination or entire whorls of flower buds were collected from flowering parts. Leaves or flower buds were immediately placed in plastic tubes on dry ice, and tissues from at least 10 plants of a genotype were pooled prior to RNA extraction.
RNA was extracted from all tissue samples using the Trizol extraction method (Life Technologies, Gaithersburg, MD) according to the manufacturer’s recommendations, except that the supernatant from the first centrifugation was re-centrifuged again to separate cell debris and the chloroform extraction was performed twice. After ethanol precipitation the RNA was washed three times with 1 mL of 70% ethanol before re-suspension in water. The quality of each RNA preparation was observed after agarose gel electrophoresis.
Target labelling, slide hybridization and data capture
cDNA targets were prepared by the direct incorporation of fluorescently labelled deoxyribonucleotides (Cy3- and Cy5-dUTP, NEN, Boston, MA) during first strand cDNA synthesis by the reverse transcription reaction (Superscript II RT, Life Technologies, Rockville, MD). An aliquot of 20 μg of total RNA was mixed with 2 μg of oligo (dT) primer and 0.1 ng of luciferase mRNA (as an external control) in a final volume of 10 μL. The mixture was incubated at 70 °C for 10 min, chilled on ice, and then added to a reaction mix (20 μL) with a final composition of 500 μM each of dCTP, dATP and dGTP and 100 μM of dTTP and Cy3-dUTP or Cy5-dUTP, 10 mM dithiothreitol, 1 μL of RNAsin (Promega, Madison, WI), 1× Superscript II buffer and 2 μL of Superscript II (400 units). The reaction was incubated at 42 °C for 2 h and terminated by the addition of 2 μL of 20 mM EDTA. After addition of 3 μL of 1 N NaOH and incubation at 70 °C for 10 min, the reaction was neutralized by addition of the same amount of HCl. The labelled probes were purified using Microcon YM-30 filter columns (Millipore, Bedford, MA) and lyophilized in a speed vacuum.
Each lyophilized probe was re-suspended in 40 μL of hybridization solution (0.25 M Na2HPO4, 0.25 M NaH2PO4, pH 7.4, and 3.5% SDS, w/v). The solution was heated for 2 min at 95 °C, chilled immediately in ice, and applied directly to the array. After covering the array with a 24 × 40 mm coverslip (Sigma, St Louis, MO), the slide was placed in a microarray hybridization chamber (Corning Incorporated, Corning, NY). Hybridization was performed overnight (16 h) at 60 °C in a hybridization oven. After hybridization, the slides were washed for 2 min in 2× SSC, 0.03% (w/v) SDS, 2 min in 0.2× SSC, and 2 min in 0.05× SSC. Immediately after the last wash, the slides were dried by centrifugation (3 min at 500 r.p.m.). The fluorescent signals of the hybridized microarrays were captured using a GenePix 4000B (Axon, Foster City, CA) at a resolution of 10 μm and quantified using GENEPIX Pro4.1 software. The data were transformed to the log scale to allow the use of a linear (rather than a multiplicative) model (Black, 2002).
Experimental design
Microarray experiments are block designs in the traditional language of statistical experimental design. Dye-swap experiments are a simple and effective design for comparing two targets (or samples) directly, in that they use two slides but switch the colour of the fluorescent dyes (Cy3 and Cy5) for the two targets. This is equivalent to a Latin square experiment, with slide considered as a block of size two and dye treated as a second blocking factor, also of size two. In repeated dye-swap experiments, four, six, or more slides are used for the same two biological targets. The advantage of the dye-swap is that it permits an estimation of all parameters in the ANOVA model, since the factors are balanced (i.e. every possible combination of factors is observed).
Analysis of variance (ANOVA) model
The notation Xijkplm is used to denote the mth replicate spot of gene l with feature type p under target condition k labelled with dye j on slide i. After log transformation, Yijkplm = log(Xijkplm).
The ANOVA model for this situation is given by:
where μ represents the overall mean effect, S, D, T, F and G represent main effects from the slide, dye, target (e.g. flower RNA vs. leaf RNA), feature type (e.g. oligo vs. cDNA) and gene, respectively. The interaction terms TF, SG, DG, TG, FG and TFG represent target by feature type, array by gene, dye by gene, target by gene, feature type by gene, and target by feature type by gene interactions, and εijkplm denotes the random error and is used to test for significance of main and interaction effects in the model. Due to confounding and/or aliasing issues involving the slide, dye and target terms, not all two-way interactions are included in the model. The model residuals are assumed to be normally distributed with a common variance (i.e. εijkplm i.i.d. N(0, σ2)), unless evidence of variance non-constancy is observed. In such case, a per gene variance is assumed (i.e. εijkplm independent .N(0, σ12))
Hypothesis testing
The presence of differential expression in a microarray expression is represented by significant differences in T + TG terms for a particular gene (Black, 2002). The following hypotheses are tested to determine whether a gene, g, has undergone differential expression between targets t and t′(e.g. flower RNA vs. leaf RNA).
A standard t-test statistic is used for this comparison, based on the normality assumption for the residuals. To control for multiple testing errors, both Holm’s and the false discovery rate (FDR) were employed. Holm’s sequential adjustment provides strong control of the family-wise error rate (FWER) below level α with greater power than the standard Bonferroni method (Hochberg and Tamhane, 1987). The false discovery rate (FDR) controlling method of Benjamini and Hochberg (Benjamini and Hochberg, 1995) provides weak control of the FWER, and controls the FDR below level α. The FDR is defined as the expected proportion of incorrect rejections of H0, relative to the total number of rejections. The significance level α = 0.01 was chosen for this study.
Quantitative RT-PCR analysis
Quantitative or real-time RT-PCR (QRT-PCR) analysis was performed in an ABI Prism 7700 detection system (PE Applied Biosystems, Foster City, CA) using SYBR green dye method (Yuen et al., 2002). In brief, genespecific primers (see online supporting data) were designed using annotated sequences obtained from GenBank for each of 16 genes selected from the oligo and cDNA microarray experiments. Primers were designed using Primer Express (version 1.0) software. The reverse transcription reaction was carried out in a final volume of 40 μL containing 10 μg of total RNA from A. thaliana leaves and flower buds (same preparations that were used for the microarray experiments), 10 mM dithiothreitol, 500 μM deoxynucleotide triphosphates, 2 μg of oligo (dT)15, 60 units of RNasin, and 200 units of Superscript RNase H− (Gibco BRL). The reaction mixture was incubated at 42 °C for 90 min, followed by heating at 95 °C for 5 min and rapid cooling on ice. The cDNA was then purified using a DNA purification kit (Qiagen, Valencia, CA). The PCR was performed in one cycle at 50 °C for 2 min and 95 °C for 10 min followed by 50 cycles at 95 °C for 15 s and 60 °C for 15 s. SYBR Green master mix was used to quantify the amount of first-strand cDNA products according to the manufacturer’s recommendations. Each reaction was carried out in a final volume of 20 μL containing 2 μL of 1 : 100 (v/v) dilution of the first-strand cDNA products. Primers for 18S rRNA were included in each reaction, and the amplification products were used to standardize the quantity of gene-specific RT-PCR products from the two RNA samples. The 1 : 100 dilution was selected based on results from testing a dilution series, as recommended by the manufacturer. Three reactions were performed for each gene and RNA sample. Parallel PCR reactions were carried out using RNase-treated RNA samples and reverse-transcription free RNA samples in PCR reactions to ensure that the PCR products were amplified from RNA and not from DNA contaminants. Data were analysed using ABI prism SDS version 2.0 software and fold-differences were calculated using the comparative CT method according to the manufacturer’s recommendations.
Acknowledgments
We thank other members (Jim Birchler and Rob Martienssen) of the polyploid consortium project (http://polyploid.agronomy.wisc.edu/) and the advisory committee (David Galbraith, Eric Richards, Doug Soltis, and Todd Wood) for their valuable suggestions and advice to improve this research. Z.J.C. thanks other members (Meng Chen, Wenxiang Gao, Osama Hassan, and Jinsuk J. Lee) of his laboratory for their contributions to the manufacture of microarray slides. This work was supported by a grant (0077774) from the National Science Foundation Plant Genome Research Program.
Footnotes
Supplementary material Additional data of oligo sequences, GenBank accession numbers of corresponding genes, and raw and analysed data of microarray experiments are provided online see <http://www.blackwellpublishing.com/products/journals/suppmat/PBI/PBI048/PBI048sm.htm >. Additional material is provided as follows: (1) Gene list <http://microarrayabc.tamu.edu/microarray/pilotset.htm>, (2) Microarray data presentation <http://microarrayabc.tamu.edu/microarray/pilotsetJune302003.htm>.
Useful websites: http://polyploid.agronomy.wisc.edu; http://www.operon.com/arrays/omad.php; http://www.tigr.org/tdb/agi/; http://microarrayabc.tamu.edu; http://www.arabidopsis.org/abrc/
References
- Arabidopsis Genome Initiative. Analysis of the genome sequence of the flowering plant Arabidopsis thaliana. Nature. 2000;408:796–815. doi: 10.1038/35048692. [DOI] [PubMed] [Google Scholar]
- Bachem CW, van der Hoeven RS, de Bruijn SM, Vreugdenhil D, Zabeau M, Visser RG. Visualization of differential gene expression using a novel method of RNA fingerprinting based on AFLP: analysis of gene expression during potato tuber development. Plant J. 1996;9:745–753. doi: 10.1046/j.1365-313x.1996.9050745.x. [DOI] [PubMed] [Google Scholar]
- Benjamini Y, Hochberg Y. Controlling the false discovery rate: a practical and powerful approach to multiple testing. J Royal Stat Soci (Series B) 1995;57:289–300. [Google Scholar]
- Black MA. PhD Thesis. West Lafayette, Indiana: Department of Statistics, Purdue University; 2002. Statistical issues in the design and analysis of spotted microarray experiments. [Google Scholar]
- Black MA, Doerge RW. Calculation of the minimum number of replicate spots required for detection of significant gene expression fold change in microarray experiment. Bioinformatics. 2002;18:1609–1616. doi: 10.1093/bioinformatics/18.12.1609. [DOI] [PubMed] [Google Scholar]
- Brenner S, Johnson M, Bridgham J, Golda G, Lloyd DH, Johnson D, Luo S, McCurdy S, Foy M, Ewan M, Roth R, George D, Eletr S, Albrecht G, Vermaas E, Williams SR, Moon K, Burcham T, Pallas M, DuBridge RB, Kirchner J, Fearon K, Mao J, Corcoran K. Gene expression analysis by massively parallel signature sequencing (MPSS) on microbead arrays. Nat Biotechnol. 2000;18:630–634. doi: 10.1038/76469. [DOI] [PubMed] [Google Scholar]
- Cavell AC, Lydiate DJ, Parkin IA, Dean C, Trick M. Collinearity between a 30-centimorgan segment of Arabidopsis thaliana chromosome 4 and duplicated regions within the Brassica napus genome. Genome. 1998;41:62–69. [PubMed] [Google Scholar]
- Chen ZJ, Comai L, Pikaard CS. Gene dosage and stochastic effects determine the severity and direction of uniparental ribosomal RNA gene silencing (nucleolar dominance) in Arabidopsis allopolyploids. Proc Natl Acad Sci USA. 1998;95:14891–14896. doi: 10.1073/pnas.95.25.14891. [DOI] [PMC free article] [PubMed] [Google Scholar]
- DeRisi JL, Iyer VR, Brown PO. Exploring the metabolic and genetic control of gene expression on a genomic scale. Science. 1997;278:680–685. doi: 10.1126/science.278.5338.680. [DOI] [PubMed] [Google Scholar]
- Dudley AM, Aach J, Steffen MA, Church GM. Measuring absolute expression with microarrays with a calibrated reference sample and an extended signal intensity range. Proc Natl Acad Sci USA. 2002;99:7554–7559. doi: 10.1073/pnas.112683499. [DOI] [PMC free article] [PubMed] [Google Scholar]
- Eisen MB, Brown PO. DNA arrays for analysis of gene expression. Meth Enzymol. 1999;303:179–205. doi: 10.1016/s0076-6879(99)03014-1. [DOI] [PubMed] [Google Scholar]
- Finkelstein D, Ewing R, Gollub J, Sterky F, Cherry JM, Somerville S. Microarray data quality analysis: lessions from the AFGC project. Plant Mol Biol. 2002;48:119–131. doi: 10.1023/a:1013765922672. [DOI] [PubMed] [Google Scholar]
- Fodor SP, Read JL, Pirrung MC, Stryer L, Lu AT, Solas D. Light-directed, spatially addressable parallel chemical synthesis. Science. 1991;251:767–773. doi: 10.1126/science.1990438. [DOI] [PubMed] [Google Scholar]
- Girke T, Todd J, Ruuska S, White J, Benning C, Ohlrogge J. Microarray analysis of developing Arabidopsis seeds. Plant Physiol. 2000;124:1570–1581. doi: 10.1104/pp.124.4.1570. [DOI] [PMC free article] [PubMed] [Google Scholar]
- Hall AE, Fiebig A, Preuss D. Beyond the Arabidopsis genome: Opportunities for comparative genomics. Plant Physiol. 2002;129:1439–1447. doi: 10.1104/pp.004051. [DOI] [PMC free article] [PubMed] [Google Scholar]
- Hanfstingl U, Berry A, Kellogg EA, Costa JT, 3rd, Rudiger W, Ausubel FM. Haplotypic divergence coupled with lack of diversity at the Arabidopsis thaliana alcohol dehydrogenase locus: Roles for both balancing and directional selection? Genetics. 1994;138:811– 828. doi: 10.1093/genetics/138.3.811. [DOI] [PMC free article] [PubMed] [Google Scholar]
- Hartl DL, Meiklejohn CD, Castillo-Davis CI, Cavalieri D, Ranz JM, Townsend JP. Gene expression profiling in evolutionary genetics. In: Singh R, Jain S, Uyenoyama M, editors. The Evolution of Population Biology: Modern Synthesis. New York: Academic Press; 2003. pp. 74–93. [Google Scholar]
- Henikoff S, Comai L. A DNA methyltransferase homolog with a chromodomain exists in multiple polymorphic forms in Arabidopsis. Genetics. 1998;149:307–318. doi: 10.1093/genetics/149.1.307. [DOI] [PMC free article] [PubMed] [Google Scholar]
- Hochberg Y, Tamhane AC. Multiple Comparison Procedures. New York: Wiley; 1987. [Google Scholar]
- Horvath DP, Schaffer R, West M, Wisman E. Arabidopsis microarrays identify conserved and differentially expressed genes involved in shoot growth and development from distantly related plant species. Plant J. 2003;34:125–134. doi: 10.1046/j.1365-313x.2003.01706.x. [DOI] [PubMed] [Google Scholar]
- Hughes TR, Mao M, Jones AR, Burchard J, Marton MJ, Shannon KW, Lefkowitz SM, Ziman M, Schelter JM, Meyer MR, Kobayashi S, Davis C, Dai H, He YD, Stephaniants SB, Cavet G, Walker WL, West A, Coffey E, Shoemaker DD, Stoughton R, Blanchard AP, Friend SH, Linsley PS. Expression profiling using microarrays fabricated by an ink-jet oligonucleotide synthesizer. Nat Biotechnol. 2001;19:342–347. doi: 10.1038/86730. [DOI] [PubMed] [Google Scholar]
- Kerr MK, Churchill GA. Experimental design for gene expression microarrays. Biostatistics. 2001;2:183–201. doi: 10.1093/biostatistics/2.2.183. [DOI] [PubMed] [Google Scholar]
- Knight J. When the chips are down. Nature. 2001;410:860–861. doi: 10.1038/35073680. [DOI] [PubMed] [Google Scholar]
- Koch MA, Haubold B, Mitchell-Olds T. Comparative evolutionary analysis of chalcone synthase and alcohol dehydrogenase loci in Arabidopsis, Arabis, and related genera (Brassicaceae) Mol Biol Evol. 2000;17:1483–1498. doi: 10.1093/oxfordjournals.molbev.a026248. [DOI] [PubMed] [Google Scholar]
- Koch M, Haubold B, Mitchell-Olds T. Molecular systematics of the Brassicaceae: Evidence from coding plastidic matK and nuclear Chs sequences. Am J Bot. 2001;88:534 –544. [PubMed] [Google Scholar]
- Lee HS, Chen ZJ. Protein-coding genes are epigenetically regulated in Arabidopsis polyploids. Proc Natl Acad Sci USA. 2001;98:6753–6758. doi: 10.1073/pnas.121064698. [DOI] [PMC free article] [PubMed] [Google Scholar]
- Li F, Stormo GD. Selection of optimal DNA oligos for gene expression arrays. Bioinformatics. 2001;17:1067–1076. doi: 10.1093/bioinformatics/17.11.1067. [DOI] [PubMed] [Google Scholar]
- Lukens L, Zou F, Lydiate D, Parkin I, Osborn T. Comparison of a Brassica oleracea genetic map with the genome of Arabidopsis thaliana. Genetics. 2003 doi: 10.1093/genetics/164.1.359. in press. [DOI] [PMC free article] [PubMed] [Google Scholar]
- Madlung A, Masuelli RW, Watson B, Reynolds SH, Davison J, Comai L. Remodeling of DNA methylation and phenotypic and transcriptional changes in synthetic Arabidopsis allotetraploids. Plant Physiol. 2002;129:733–746. doi: 10.1104/pp.003095. [DOI] [PMC free article] [PubMed] [Google Scholar]
- Mitchell-Olds T, Clauss MJ. Plant evolutionary genomics. Curr Opin Plant Biol. 2002;5:74–79. doi: 10.1016/s1369-5266(01)00231-x. [DOI] [PubMed] [Google Scholar]
- Nilsen TW, Grayzel J, Prensky W. Dendritic nucleic acid structures. J Theor Biol. 1997;187:273–284. doi: 10.1006/jtbi.1997.0446. [DOI] [PubMed] [Google Scholar]
- Randolph JB, Waggoner AS. Stability, specificity and fluorescence brightness of multiply-labeled fluorescent DNA probes. Nucl Acids Res. 1997;25:2923–2929. doi: 10.1093/nar/25.14.2923. [DOI] [PMC free article] [PubMed] [Google Scholar]
- Relogio A, Schwager C, Richter A, Ansorge W, Valcarcel J. Optimization of oligonucleotide-based DNA microarrays. Nucl Acids Res. 2002;30:e51. doi: 10.1093/nar/30.11.e51. [DOI] [PMC free article] [PubMed] [Google Scholar]
- Rifkin SA, Kim J, White KP. Evolution of gene expression in the Drosophila melanogaster subgroup. Nat Genet. 2003;33:138–144. doi: 10.1038/ng1086. [DOI] [PubMed] [Google Scholar]
- Sanger F, Nicklen S, Coulson AR. DNA sequencing with chain-terminating inhibitors. Proc Natl Acad Sci USA. 1977;74:5463–5467. doi: 10.1073/pnas.74.12.5463. [DOI] [PMC free article] [PubMed] [Google Scholar]
- Schena M, Heller RA, Theriault TP, Konrad K, Lachenmeier E, Davis RW. Microarrays: Biotechnology’s discovery platform for functional genomics. Trends Biotechnol. 1998;16:301–306. doi: 10.1016/s0167-7799(98)01219-0. [DOI] [PubMed] [Google Scholar]
- Schena M, Shalon D, Davis RW, Brown PO. Quantitative monitoring of gene expression patterns with a complementary DNA microarray. Science. 1995;270:467–470. doi: 10.1126/science.270.5235.467. [DOI] [PubMed] [Google Scholar]
- Singh-Gasson S, Green RD, Yue Y, Nelson C, Blattner F, Sussman MR, Cerrina F. Maskless fabrication of light-directed oligonucleotide microarrays using a digital micromirror array. Nat Biotechnol. 1999;17:974–978. doi: 10.1038/13664. [DOI] [PubMed] [Google Scholar]
- Stears RL, Getts RC, Gullans SR. A novel, sensitive detection system for high-density microarrays using dendrimer technology. Physiol Genomics. 2000;3:93–99. doi: 10.1152/physiolgenomics.2000.3.2.93. [DOI] [PubMed] [Google Scholar]
- Townsend JP, Cavalieri D, Hartl DL. Population genetic variation in genome-wide gene expression. Mol Biol Evol. 2003;20:955–963. doi: 10.1093/molbev/msg106. [DOI] [PubMed] [Google Scholar]
- Velculescu VE, Zhang L, Vogelstein B, Kinzler KW. Serial analysis of gene expression. Science. 1995;270:484–487. doi: 10.1126/science.270.5235.484. [DOI] [PubMed] [Google Scholar]
- Velculescu VE, Zhang L, Zhou W, Vogelstein J, Basrai MA, Bassett DE, Jr, Hieter P, Vogelstein B, Kinzler KW. Characterization of the yeast transcriptome. Cell. 1997;88:243–251. doi: 10.1016/s0092-8674(00)81845-0. [DOI] [PubMed] [Google Scholar]
- Wang H-W, Malek RL, Kwitek AE, Greene AS, Luu TV, Behbahani B, Frank B, Quackenbush J, Lee NH. Assessing unmodified 70-mer oligonucleotide probe performance on glass-slide microarrays. Genome Biol. 2003;4:R5.1–R5.13. doi: 10.1186/gb-2003-4-1-r5. [DOI] [PMC free article] [PubMed] [Google Scholar]
- Wang Y, Wang X, Guo SW, Ghosh S. Conditions to ensure competitive hybridization in two-color microarray: a theoretical and experimental analysis. Biotechniques. 2002;32:1342–1346. doi: 10.2144/02326mt05. [DOI] [PubMed] [Google Scholar]
- Yuen T, Wurmbach E, Pfeffer RL, Ebersole BJ, Sealfon SC. Accuracy and calibration of commercial oligonucleotide and custom cDNA microarrays. Nucl Acids Res. 2002;30:e48. doi: 10.1093/nar/30.10.e48. [DOI] [PMC free article] [PubMed] [Google Scholar]