Abstract
Morbidity and mortality rates are higher in patients with severe left ventricular (LV) systolic dysfunction and ECG-derived prolonged QRS interval than in those with normal QRS duration. QRS duration is currently used on the grounds that it reflects the presence of ventricular dyssynchrony. However, 30–40% of patients selected on the basis of a prolonged QRS do not receive benefit by cardiac resynchronization therapy (CRT) since they do not show any significant inverse LV remodeling and QRS duration does not accurately distinguish responders to CRT. Consequently, mechanical dyssynchrony (particularly intra-ventricular dyssynchrony) seems to be much more important than electrical dyssinchrony. Pre- and post-echocardiographic assessment should require the combination of conventional and specific applications ranging from M-mode and pulsed/continuous Doppler, to pulsed Tissue Doppler, the off-line analysis of colour Tissue Velocity Imaging, Strain Rate Imaging, and real time three-dimensional reconstruction However, there is not no consensus about the best approach and the best ultrasound parameter for selecting candidates to CRT and ECG representation of abnormal cardiac conduction still remains as the main criterion in guidelines. This review is a practical update of ultrasound methods and measurements of atrio-ventricular, inter-ventricular and intra-ventricular dyssynchrony and describes experiences which used either conventional Doppler echocardiography and more advanced techniques. By these experiences, the global amount of LV dyssynchrony seems to be critical: the greater intra-ventricular dyssynchrony, the higher the possibility of significant LV inverse remodeling. After CRT, it is necessary also to evaluate the optimal atrio-ventricular delay and ventricular-ventricular delay setting that maximizes LV systolic function.
Background
Morbidity and mortality rates are higher in patients with severe left ventricular (LV) systolic dysfunction and ECG-derived prolonged QRS interval than in those with normal QRS duration [1]. Bi-Ventricular Pacing (BIVP) and Cardiac Resynchronization Therapy (CRT) have become additional treatment aimed to synchronizing biventricular activation and contraction in patients with severe chronic heart failure (CHF) associated with interventricular conduction delay. CRT is effective in improving functional capacity and degree of secondary mitral regurgitation [2-4] and, above all, in reducing the mortality in cases of refractory CHF. NYHA classes III-IV, a LV ejection fraction (EF) of ≤ 35%, a LV end-diastolic diameter > 30 mm/m2 and a surface ECG derived QRS duration > 120 ms, together with a need for maximal pharmacological therapy, are considered from guidelines to select patients for CRT [5].
QRS duration is currently used on the grounds that it reflects the presence of ventricular dyssynchrony. However, 30–40% of patients selected on the basis of a prolonged QRS do not receive benefit by CRT since they do not show any significant inverse LV remodeling (a ≥ 15% reduction of LV end-systolic volume six months after device implantation) [6,7]. Furthermore, QRS duration does not accurately distinguish responders to CRT [8]. Although factors responsible for the absence of favourable response may be lead dislodgement or inappropriate location of LV lead, mechanical dyssynchrony (particularly intra-ventricular dyssynchrony) seems to be much more important than electrical dyssinchrony, and Doppler echocardiography should be widely used before and after implantation of a CRT device [9,10].
Pre- and post-echocardiographic assessment includes conventional and/or specific applications ranging from M-mode and pulsed/continuous Doppler, to pulsed Tissue Doppler, the off-line analysis of colour Tissue Doppler, Strain Rate Imaging (SRI), and real time 3-D reconstruction [9-13]. The different modalities of the transthoracic ultrasound approach are able to identify the 3 different kinds of mechanical dyssynchrony: 1. Atrio-ventricular dyssinchrony, 2. Inter-ventricular dyssynchrony, 3. Intra-ventricular dyssynchrony.
1. Atrio-ventricular dyssynchrony
Atrio-ventricular (AV) dyssynchrony occurs in patients with dilated cardiomyopathy and first degree AV block and was the first objective of CRT by bicameral pacemakers in the early 1990s [14]. AV dyssynchrony reduces the duration of ventricular filling, thus inducing the appearance of diastolic mitral and tricuspid regurgitation and reducing stroke volume. The optimal AV delay after CRT is short, but a longer delay may be necessary in some cases (e.g., in the presence of concomitant inter-atrial delay). Optimizing AV delay is guided by a Doppler recording of transmitral inflow (Mitral inflow method) [11-13,15] which requires recording the mitral inflow pattern at a sweep speed of 100 mm/s, with the sample volume placed at the tips of the mitral leaflets; mitral valve closure must be clearly defined at the time of ECG R wave (Figure 1). The method cannot be applied in the presence of atrial fibrillation (no A velocity). Furthermore, when the AV delay is short (= 60–80 ms), the duration of A velocity may become shorter inducing less atrial contribution but total LV filling time increases.
Figure 1.
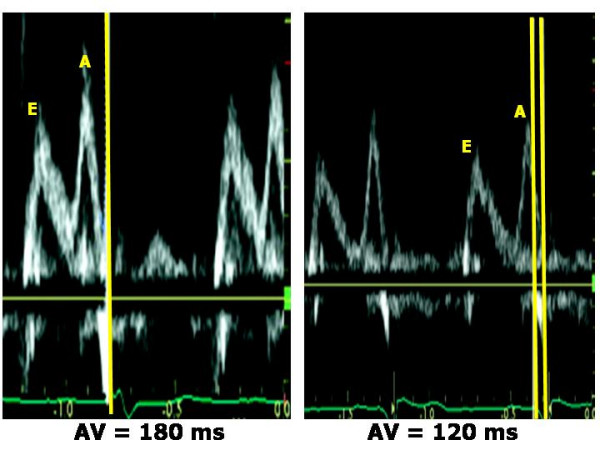
Optimization of AV delay after CRT by pulsed Doppler mitral inflow pattern. At programmed AV delay of 180 ms (upper panel) the closure of mitral valve occurs before the onset of ECG QRS. Optimizing AV delay at 120 ms (lower panel), the diastolic filling time is much longer and the duration of atrial filling is preserved. (Modified from Agler DA, J Am Soc Echocardiogr 2007;20:76–90).
2. Inter-ventricular dyssynchrony
Inter-ventricular dyssynchrony represents the discordance between the times of right ventricular (RV) and LV contraction. PW or CW Doppler images of aortic and pulmonary flow velocities are currently used to measure the inter-ventricular mechanical delay (IVMD), which includes recording of LV outflow tract (apical 5-chamber view) and RV outflow tract (parasternal short-axis view of the great vessels) and calculating the difference in time between ECG-derived Q wave onset and the onset of LV outflow and the time between the onset of Q and the onset of RV outflow [11,12] (Figure 2). These time intervals respectively reflect LV and RV pre-ejection period (PEP). IVMD values of > 40 ms and values of LV PEP of > 140 ms are considered pathological [16]. Doppler recording of LV and RV outflow velocities (sweep speed of 100 mm/s) requires appropriate gain and wall filter settings to visualize the opening and closing clicks. When using PW Doppler, the sample volume has to be placed proximally to the pulmonary and the aortic valve. The limitation of this method include the presence of pulmonary arterial hypertension and/or RV systolic dysfunction, which can prolong RV PEP, and a concomitantly impaired increase of LV pressure in very severe CHF.
Figure 2.
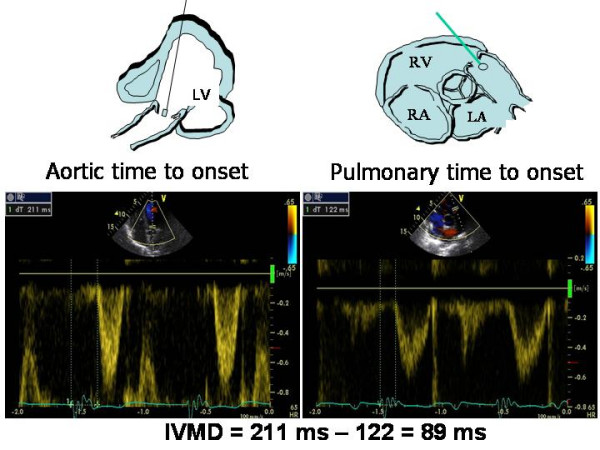
Calculation of interventricular mechanical delay by standard Doppler method. The time from ECG Q wave to onset of left ventricular outflow tract (= 211 ms) (left panel) is longer than the time occurring from Q to onset of right ventricular outflow tract (= 122 ms). The resulting inter-ventricular mechanical delay (IVMD) is of 89 ms, thus indicating a significant interventricular dyssynchrony.
Alternatively, pulsed Tissue Doppler can be used to determine IVMD by measuring the time from QRS onset to the peak myocardial systolic velocities (Sm) of the RV free wall (tricuspid annulus) versus the same time of LV lateral mitral annulus (apical 4-chamber view) [9].
It is important to state that intraventricular dyssynchrony does not correlate with reverse LV remodeling after CRT, even when data from patients with and without coronary artery disease are evaluated separately [17-19].
3. Intra-ventricular mechanical dyssynchrony
Intra-ventricular dyssynchrony is characterized by either premature or late contraction of LV wall segments due to delayed electrical conduction [20]. It can be identified by means of simple M-mode, pulsed Tissue Doppler, or, better, by colour Tissue Velocity Imaging (TVI), SRI and 3-D echocardiography.
M-mode
Intra-ventricular mechanical delay can be determined on the basis of the simple M-mode-derived septal-to-posterior wall motion delay (SPWMD), i.e., the difference in timing of septal and posterior wall contraction [12,21,22]. The M-mode cursor is positioned perpendicular to the septum and posterior wall at the base of the left ventricle, in parasternal short-axis (or long-axis) view: SPWMD is the difference between the time from the onset of ECG-derived Q wave to the initial peak posterior displacement of the septum, and the time from the onset of QRS to the peak systolic displacement of posterior wall (sweep speed of 100 mm/s) (Figure 3). In the original experience of Pitzalis et al on 20 patients with advanced heart failure, a SPWMD (determined in parasternal short-axis view) of > 130 ms was considered pathological and SPWMD predicted inverse LV remodeling and long-term clinical improvement after CRT, with 100% sensitivity, 63% specificity and 85% accuracy [21,22]. The main advantages of this method correspond to the low-cost technique and the availability in all the echocardiographic machines. The limitations include the impossibility to measure SPWMD in patients with a poor acoustic window, previous septal or posterior wall myocardial infarction, or abnormal septal motion secondary to RV pressure or volume overload. In addition, M-mode can only visualize dyssinchrony of the anterior septum or posterior wall whereas other LV walls can be involved. Marcus et al have underlined the low feasibility of SPWMD (measured in parasternal long-axis view), which had also poor sensitivity (24%) and specificity (66%) in predicting the response to CRT of 79 heart failure patients [23].
Figure 3.
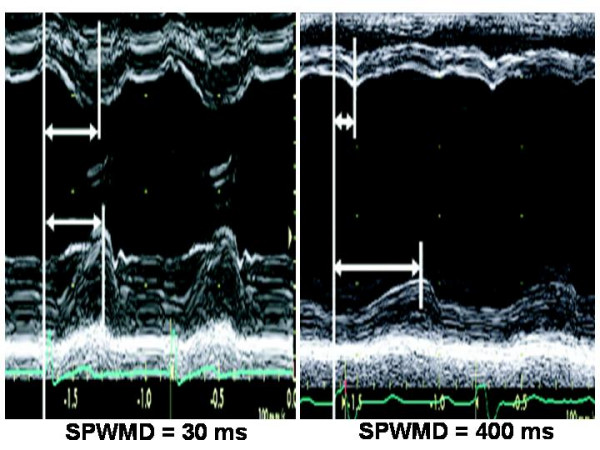
Septal-to-posterior wall motion delay (SPWMD). SPWMD in a normal subject (left panel) and in a patient with CHF and left bundle branch block. (Modified from Agler DA et al, J Am Soc Echocardiogr 2007;20:76–90).
A very recent method, reported by Sassone et al [24], determines lateral wall post-systolic displacement (LWPSD), measured as the difference of intervals from QRS onset to maximal systolic displacement of the basal LV lateral wall (assessed by M-mode in the apical 4-chamber view) and from QRS onset to the beginning of transmitral E velocity (assessed by pulsed Doppler of mitral inflow) (Figure 4). A positive LWPSD, i.e. a longer interval to maximal inward displacement of LV lateral wall than the interval to opening of the mitral valve, identifies a severe post-systolic contraction and has been demonstrated to be an independent predictor of CRT response in 48 patients with end-stage heart failure and left bundle branch block. Of interest, despite evaluating intra-ventricular dissynchrony based on delay of a single myocardial wall, LWPSD could predict CRT response. This may rely to the fact that, in the presence of left bundle branch block, the lateral wall is the latest to be activated, theoretically representing the optimal target for LV lead positioning. This method has not yet tested in patients without left bundle branch block and its diagnostic accuracy is unknown. In addition. it needs the identical heart rate when measuring the M-mode and pulse Doppler imaging.
Figure 4.
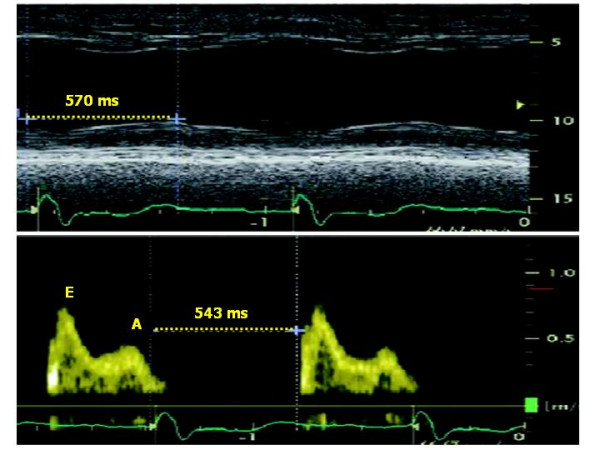
Methodology for measuring lateral wall post-systolic displacement (LWPSD). It is measured as the difference of the time interval from QRS onset to maximal systolic displacement of the basal LV lateral wall (assessed by M-mode in the apical 4-chamber view) (upper panel) and the time interval from QRS onset to the beginning of transmitral E velocity (assessed by pulsed Doppler of mitral inflow) (lower panel). In this example, the positive value of the difference indicates the co-existence of segmental post-systolic contraction and diastolic relaxation. (Modified from Sassone B et al, Am J Cardiol 2007;100:470–475).
Pulsed (PW) Tissue Doppler
Determining the time of myocardial systolic velocities (Sm) is an important and easy echocardiographic means of assessing CHF before/after CRT. The advantage of PW Tissue Doppler is its excellent temporal resolution for measuring intraventricular mechanical dyssinchrony, and its availability in the majority of cardiac ultrasound systems. Various PW Tissue Doppler parameters have been proposed [25]. The most widely used measurements correspond to the time interval between the onset of ECG-derived QRS and the Sm peak (= time to Sm peak) and the time interval between the onset of QRS and the onset of Sm (= time to Sm onset), which correspond to LV PEP (Figure 5). Intra-ventricular mechanical delay has been defined for differences of > 65 ms of time to Sm peak between LV segments [26]. Receiver-operator characteristic curve analysis demonstrated that this cut-off value yielded a sensitivity and specificity of 80% to predict clinical improvement and of 92% to predict LV reverse remodeling in 85 patients with end-stage heart failure, QRS duration > 120 ms, and left bundle-branch block [26].
Figure 5.
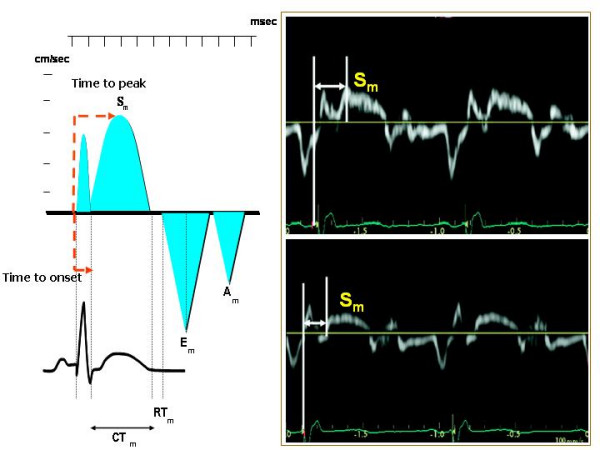
Methodology for measuring pulsed Tissue Doppler derived time to peak Sm and time to onset Sm (left panel). In the right panel measurements of time to peak Sm (upper panel) and of time to onset Sm (lower panel) are depicted. Am = Myocardial atrial velocity, CTm = Contraction time, Em = Myocardial early diastolic velocity, RTm = Myocardial relaxation time, Sm = Myocardial systolic velocity. Mod from Agler DA et al, J Am Soc Echocardiogr 2007;20:76–90.
Extensions of these method have been proposed by recording 2D imaging in the 4- 2- and 5-chamber apical views, in order to place PW Tissue Doppler sample volume in a specific myocardial segment and to measure Q to peak Sm and/or Q to Sm onset in various LV segments. The number of LV segments to be evaluated include mainly a 12-segment model (LV basal and middle segments in 4-, 2- and 5-chamber views) whereas LV apical segments are not considered reliable because of the basal-apical myocardial gradient own of Tissue Doppler. Technical refinements include the need to set the velocity scale of PW Tissue Doppler to display spectral velocities of 20 cm/s above and below the zero baseline because myocardial motion is characterized by low velocities. Spectral Doppler gain must be usually reduced, wall filters adjusted and spectral velocities recorded at sweep speed of 100 mm/s (during held respiratory expiration), in order to obtain the clearest delineation of Sm onset and peak. Electromechanical delay has to be averaged over at least 3 cardiac cycles. The main limitation of PW Tissue Doppler corresponds to the impossibility of measuring the time intervals of different segments during the same cardiac cycle. It is also necessary to take into account that the Sm recorded in apical views reflects LV longitudinal shortening and not circumferential contraction.
Colour Tissue Doppler
Off-line colour Tissue Doppler derived Tissue Velocity Imaging (TVI), Tissue Synchronization Imaging (TSI) and SRI can be used to assess intra-ventricular dyssynchrony in the longitudinal plane (apical views). The common advantages of these techniques is the possibility of measuring the dyssynchrony of opposite LV walls (= horizontal dyssynchrony) and of different segments of the same LV wall (= vertical dyssynchrony) in a given view, from the same cardiac cycle (Figure 6). Like to PW Tissue Doppler, TVI measures the time to Sm peak (Ts) or the time to Sm onset in LV basal and middle segments of the three standard apical views [27,28] (Figure 7). By identifying the presence of one or more differences > 50 ms among regional times of Sm onset, Ghio and coworkers have demonstrated that intraventricular dyssynchrony is detectable even in 29.5 % of patients with advanced LV dysfunction but normal QRS duration [29]. Using a LV 12-segment model (TVI apical measurements are also unreliable), a dyssynchrony index (DI) can be derived as the standard deviation of the average values of Ts (Ts-SD) [27,30] (Figure 8). In his personal experience Yu et al have found that a Ts-SD of > 32.6 ms predicts inverse LV remodeling after CRT with 100% sensitivity, 100% specificity and 100% accuracy in 30 candidates to CRT [30] (Figure 8).
Figure 6.
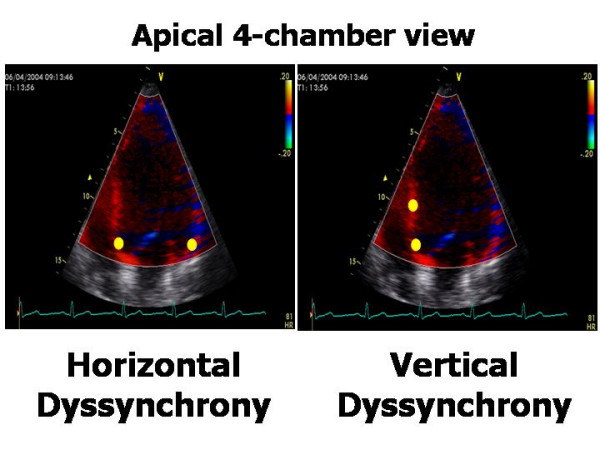
Methodology for recording and measuring intra-ventricular horizontal and vertical dyssynchrony by off-line color Tissue Doppler techniques. Horizontal dyssynchrony occurs between opposite walls. Vertical dyssynchrony is between different segments of the same wall.
Figure 7.
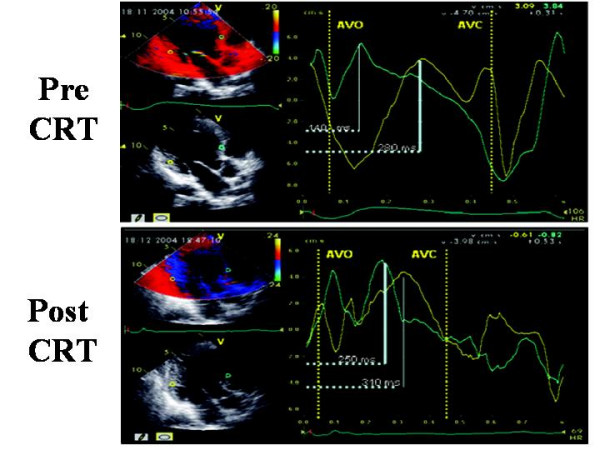
Sample of time to peak (Ts) measured by off-line color TVI pre and post CRT at the level of anterior septum and postero-lateral wall, in apical 5-chamber view. Aortic valve opening (AVO) and closure (AVC) are derived by previous placement of markers on the onset and the end of LV Doppler outflow. Pre-CRT Ts of postero-lateral wall (upper panel) is clearly delayed in comparison to Ts of anterior septum. Post-CRT the time duration of Ts between the two walls is clearly shortened (lower panel). (Modified from Innelli P et al, Echocardiography 2006;23:709–716)
Figure 8.
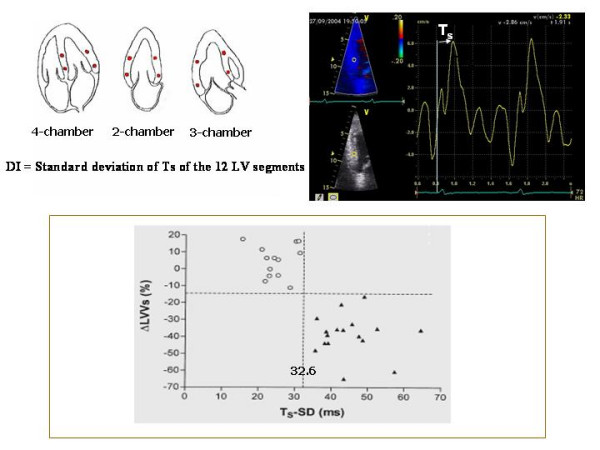
Methodology of calculation of Dyssynchrony Index and is ability in predicting LV inverse remodeling. In the upper panel methodology of calculation of Dyssynchrony Index, i.e., the standard deviation of Ts (Ts-SD) measured in the basal and mid-segments visualizable in the apical views. In the lower panel, Ts-SD shows the ability to predict an effective LV inverse remodeling after CRT (lower panel). Values of TS-SD > 32.6 (black triangles) predict an effective LV reverse remodeling (DLVVs = delta left ventricular end-systolic volumes) after CRT. Patients with pre-CRT values of Ts-SD < 32.6 (empty circles) do not present significant LV inverse remodeling at follow-up. (Modified from Yu CM et al, Am J Cardiol 2003;91:684–688)
TSI is an implementation of Ts method. It displays Ts in multiple LV segments by colour coding wall motion green (corresponding to early systolic contraction) or red, which corresponds to delayed contraction (sensitivity = 87%, specificity = 81% and accuracy = 84% at a cut-off value of 34.4 ms in 56 patients with severe heart failure) [31].
Ultrasound instrumentations running Colour Tissue Doppler are also able to determine regional electromechanical delay by means of off-line analysis of longitudinal SRI which, in comparison to TVI, has the advantage of distinguishing active contraction from passive myocardial motion. In general, the detection of intra-ventricular dyssynchrony by means of the strain (%) and strain rate (1/sec) is based on unmasking myocardial "post-systolic shortening" after aortic valve closure (AVC), i.e. during the diastolic myocardial relaxation time (Figure 9). Various methods have been proposed for calculating intra-ventricular dyssynchrony by SRI, some of which (e.g., % of LV base with delayed contraction) predict accurately LV inverse remodeling after CRT but are complicate and requires considerable experience of the operator [32]. One simple method, from Mele and coworkers, measures the standard deviation of the averaged time-to-peak-strain (TPS-SD, ms) of 12 LV basal and mid-segments obtained from the three standard apical views: a TP-SD of > 60 ms is associated with a good response to CRT in 37 patients with dilated cardiomyopathy, although sensitivity, specificity and accuracy have not been determined by this method [33] (Figure 10). Another recent possibility, proposed by Porciani et al, considers the time spent by 12 LV segments in contracting after AVC, i.e., during the isovolumic relaxation time, and measures the sum of the time of strain tracing exceeding AVC (ExcT) on the 12 LV basal and mid-segments (cut-off value = 760 ms, 93.5% sensitivity and 82.8% specificity) (Figure 11) [34]. This method had the advantage to distinguish "contractile systolic asynchrony", i.e., temporal dispersion of the regional electromechanical delay within the ejective phase, from "diastolic contractile asynchrony", which cannot be detected by analysing the ejection phase of the cardiac cycle alone. Of note, in their experience, Porciani et al have found good sensitivity (= 82%) but poor specificity (= 39%) of TVI-derived Ts-SD. Although Yu et al demonstrated that SRI-derived post-systolic shortening of 12 LV segments is a good predictor of inverse LV remodeling only for the non-ischemic patients [35], SRI indexes have the conceptual advantages to refer to "true" contraction phenomena while colour TVI is not able to distinguish "active" and "passive" motion of LV segments.
Figure 9.
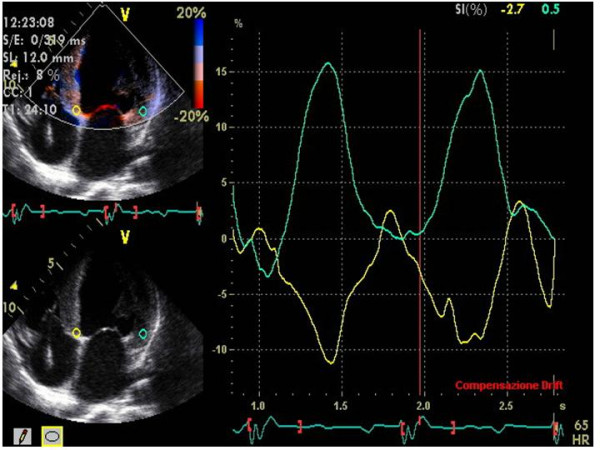
Strain (%) of basal posterior septum and lateral wall in apical 4-chamber view. Lateral wall shows an abnormal relaxation (positive sign of its curve) during systole, with a motion that is opposite to that of the basal posterior septum.
Figure 10.
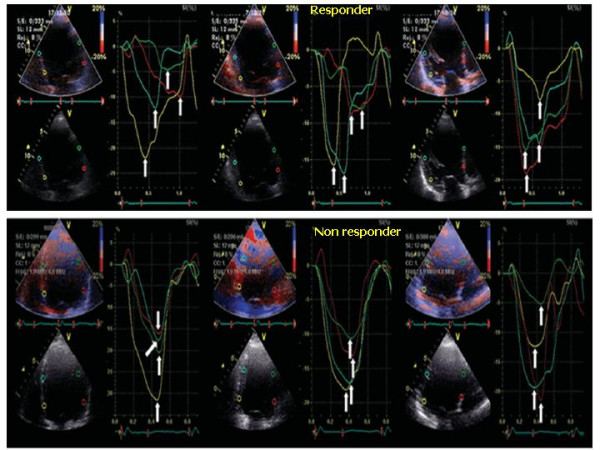
Longitudinal strain-derived dyssynchrony. Longitudinal strain-derived dyssynchrony illustrated by 12-TPS-SD (white arrows) evaluated in the three standard apical views (4-, 2- and 5-chambers) before CRT. In a responder patient (upper panel) TPS values are disperse indicating a severe degree of dyssynchrony. In a non responder patient TPS are very close to each other, indicating a low level of intra-ventricular dyssynchrony. (Modified from Mele D et al, Eur Heart J 2006;27:1070–1078).
Figure 11.
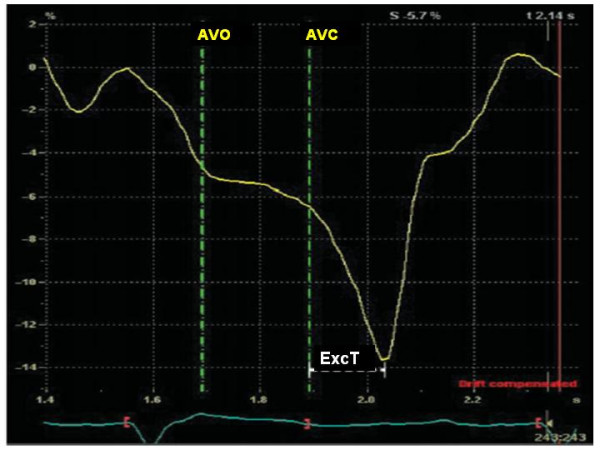
Methodology for measuring time of exceeding aortic valve closure contraction. The sum of the time of strain tracing exceeding aortic valve closure (ExcT) is calculated on the 12 LV basal and middle segments in the standard apical views. AVO = aortic valve opening, AVC = aortic valve closure(Modified from Porciani MT et al, Eur Heart J 2006;27:1818–1823)
It is important to point out that all colour Tissue Doppler derived techniques require high 2-D frames rates (>90 frames/s) [36] and that 2-D image should be optimized with a narrow sector width that includes the basal and middle segments of opposite LV walls and depth setting that include left ventricle, mitral annulus and the base of the left atrium [37]. Colour Tissue Doppler gain has to be adjusted in order to display myocardial motion clearly. At least 3 cardiac cycles should be recorded during held respiration. Before performing measurements, aortic valve opening (= AVO) and AVC must be marked by means of a previous recorded PW Doppler of LV outflow tract, in order to avoid confusion between systolic (normal) and post-systolic (abnormal) contraction [37].
The 2-D strain (speckle tracking) technique has very recently been used to assess radial dyssynchrony before/after CRT. Speckle tracking has been applied to routine mid-ventricular short-axis images to calculate radial strain from multiple circumferential points averaged to six standard segments and dyssynchrony from timing of peak radial strain has been demonstrated to be correlated with Tissue Doppler measures in 47 subjects [38]. A time difference ≥ 130 ms between the radial strain peak of LV posterior wall and anterior septum has shown to be highly predictive of an improved EF during follow-up, with 89% sensitivity and 83% specificity [38].
3-D Echocardiography
Three-dimensional (3-D) echocardiography allows intra-ventricular dyssynchrony to be evaluated by analyzing LV wall motion in multiple apical planes during the same cardiac cycle. It also offers better spatial resolution than a single plane. The global LV volumetric dataset has been used to determine a dyssynchrony index that corresponds to the standard deviation of the average of the time intervals needed by multiple LV segments to reach minimal end-systolic volume [39] (Figure 12). This index is expressed as the percent value of the overall cardiac cycle, in order to be able to compare patients with different heart rates. CRT responders (= an improvement of NHYA class) show a significant reduction of this 3-D dyssynchrony index, which parallels the reduction of LV end-diastolic volume and the increase in EF [40]. The agreement between 3-D and TVI in identifying the magnitude of intra-ventricular dyssynchrony and the site of maximal delay is poor at only 16% [39]. Advantages of the 3-D method include the possibility of evaluating all LV segments and all of the radial, longitudinal, circumferential elements of LV contraction. The limitations of 3-D method are its suboptimal feasibility (<80%), its temporal resolution of about 40–50 ms, and its inability to distinguish active from passive motion or to make analysis in the presence of atrial fibrillation and/or recurrent premature beats. Furthermore, the index does not yet have a recognized cut-off point.
Figure 12.
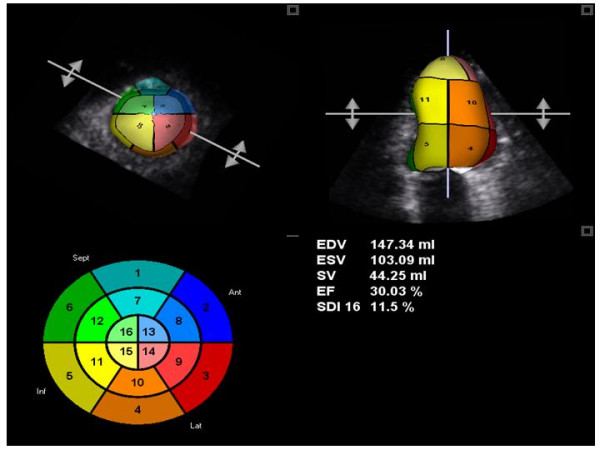
3-D derived time-volume curves of 16-segment model. Presentation 3-D derived time-volume curves of 16-segment LV model in a patient with intra-ventricular dyssynchrony. Each LV myocardial segment is codified by a different colours.
A new "real-time" 3D approach acquires three standard apical views during the same heart beating (Triplane). The images can also be acquired in TSI modality (Figure 13), thus allowing 3-D "surface rendering" visualization of the extent of dyssynchrony. The method is fast (a few seconds) and easy to perform, but has a lower temporal resolution than 2-D TSI. Partial experiences from Badano et al [41,42] have pointed out the feasibility and the rapidity of acquisition by using this tool. A very recent study has demonstrated that a triplane Ts-SD (i.e., the standard deviation of time delays in all LV segments calculated by 3-D TSI) = 35.8 ms predicts an acute (48 hours after CRT) reverse LV remodeling with 91% sensitivity and 85% specificity [43].
Figure 13.
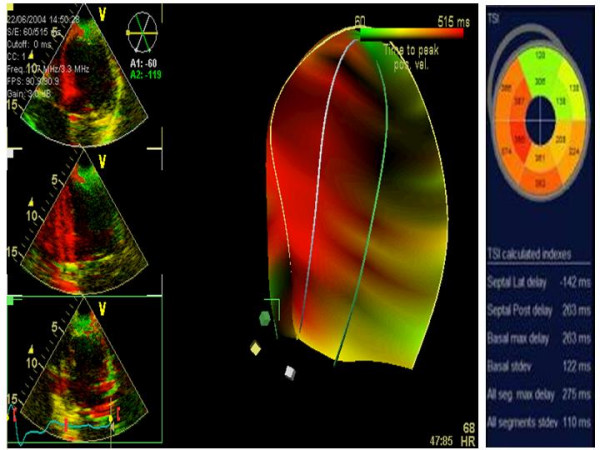
3-D "surface rendering" TSI for the analysis of LV dyssynchrony. This approach acquires the 3 standard apical views during the same heart beating (left panels: superior = 4-chamber view; middle = 2-chamber; inferior = 5-chamber) in TSI modality (middle panel). By using this tool several useful parameters can be determined (left panel).
What to measure before and after CRT
On the grounds of the multiple mentioned experiences, the ultrasound examination of candidates for CRT requires specific measurements of mechanical dyssynchrony. This can be made by combining PW/CW Doppler and M-mode echocardiography (or PW Tissue Doppler or color Tissue Doppler derived techniques or 3-D imaging). Table 1 lists the cut-off values of the main techniques that predict responders to CRT while Table 2 sumarizes sensitivity, specificity and accuracy, and also confirmatory or controversial data of these techniques. While confirmatory results are shown only by the same researchers who had created the single methods, subsequent studies by other authors have reported conflicting results when using previous validated indexes. It has also to be taken into account that all the proposed methods and techniques have been applied on restricted population sample size and information about the time needed for data acquisition and/or analysis has been rarely reported. In general, intra-ventricular dyssynchrony appears more predictive of CRT response than inter-ventricular dyssynchrony and the global amount of LV dyssynchrony seems to be critical by using different ultrasound techniques: the greater intra-ventricular dyssynchrony, the higher the possibility of significant inverse LV remodeling. When compared to other techniques, 3-D echocardiography has the potential, important advantage to identify the global cardiac dyssynchrony during the same heart beating. After CRT, Doppler echocardiography provides the possibility to evaluate the optimal AV delay and V-V delay setting that maximizes LV systolic function.
Table 1.
Main ultrasound techniques, parameters and reference values for detection of intra-ventricular dyssynchrony and prediction of LV reverse remodeling.
| Technique | Parameter | Authors | Cut-off point |
| M-mode | SPWMD | Pitzalis et al, J Am Coll Cardiol 2002 | > 130 ms |
| M-mode and PW Doppler | LWPSD | Sassone et al, Am J Cardiol 2007 | > 1 |
| PW Tissue Doppler | Diff. of Ts between LV segments | Bax JJ et al, J Am Coll Cardiol 2004 | > 65 ms |
| TVI | Ts-SD | Yu et al, Am J Cardiol 2003 | > 32.6 ms |
| TSI | Ts-SD | Yu et al, J Am Coll Cardiol 2005 | > 34.4 ms |
| SRI | TPS-SD | Mele et al, Eur Heart J 2006 | > 60 ms |
| SRI | ExcT | Porciani MC et al, Eur Heart J 2006 | > 760 ms |
| 2D radial strain | Time diff. in peak septal wall-to-posterior wall strain | Suffoletto et al, Circulation 2006 | ≥ 130 ms |
| 3D echo | Triplane Ts-SD | Van der Veire NR et al, Am J Cardiol 2007 | ≥ 35.8 * |
* acute (48 hours after CRT) response
CW = Continuous wave, ExcT = Sum of time exceeding aortic valve closure, IVMD = Inter-ventricular mechanical delay, LV PEP = Left ventricular pre-ejection period, LWPSD = Lateral wall post-systolic displacement, PW = pulse wave, SPWMD = Septal-to-posterior wall motion delay, SRI = Strain rate imaging, TSI = Tissue synchronization imaging, TVI = Tissue velocity imaging, Ts-SD = Standard deviation of time to peak Sm, TPS-SD = Standard deviation of time to peak strain
Table 2.
Sensitivity, specificity and accuracy, and confirmatory or conflicting data of the main ultrasound techniques presented in Table 1.
| Technique | Parameter | Sensitivity | Specificity | Accuracy | Confirmatory/conflicting data |
| M-mode | SPWMD | 100 | 63 | 85 | Conflicting |
| M-mode and PW Doppler | LWPSD | - | - | - | - |
| PW-Tissue Doppler | Diff. of Ts between LV segments | 92 | 92 | - | - |
| TVI | Ts-SD | 100 | 100 | 100 | Confirmatory/Conflicting |
| TSI | Ts-SD | 87 | 81 | 84 | |
| SRI | TPS-SD | - | - | - | - |
| SRI | ExcT | - | - | - | - |
| 2D radial strain | Time diff. peak septal-to-posterior wall strain | 89 | 83 | - | - |
| Triplane echo | Ts-SD | 91 | 85 | - | - |
Abbreviations as in Table 1
Although several studies have demonstrated the superiority of ultrasound over QRS duration to assess LV dyssynchrony, there are no conclusive data on prediction of CRT response either using conventional or more advanced echocardiographic technologies. The Cardiac Resynchronization-Heart Failure (CARE-HF) study is the only large randomized and controlled trial that required direct, ultrasound measurement of cardiac dyssynchrony in a subset of patients with mild to moderate QRS enlargement (= 120–149 ms) (5). However, in the CARE-HF study only 92 patients (11%) underwent CRT based on Doppler echocardiographic indexes of myocardial dyssynchrony. Of consequence, the results cannot be considered exhaustive. It is not unexpected, therefore, that the ECG representation of abnormal cardiac conduction still remains as the main criterion to identify patients with dyssynchronous ventricular contraction. Accordingly, no consensus definition of cardiac dyssynchrony exists as yet from the main cardiologic associations [44-47], although several of the mentioned echocardiographic measures appear very promising
Contributor Information
Maurizio Galderisi, Email: mgalderi@unina.it.
Fabio Cattaneo, Email: fabio.cattaneo@med.ge.com.
Sergio Mondillo, Email: mondillo@unisi.it.
References
- Iuliano S, Fisher SG, Karasik PE, Fletcher RD, Singh SN. Department of Veterans Affairs Survival Trial of Antiarrhythmic Therapy in Congestive Heart Failure. QRS duration and mortality in patients. Am Heart J. 2002;143:1085–1091. doi: 10.1067/mhj.2002.122516. [DOI] [PubMed] [Google Scholar]
- Blanc JJ, Etienne Y, Gilard M, Mansourati J, Munier S, Boschat J, Benditt DG, Lurie KG. Evaluation of different ventricular pacing sites in patients with severe heart failure: results of an acute hemodynamic study. Circulation. 1997;96:3273–3277. doi: 10.1161/01.cir.96.10.3273. [DOI] [PubMed] [Google Scholar]
- Kass DA, Chen CH, Curry C, Talbot M, Berger R, Fetics B, Nevo E. Improved left ventricular mechanics from acute VDD pacing in patients with dilated cardiomyopathy and ventricular conduction delay. Circulation. 1999;99:1567–1573. doi: 10.1161/01.cir.99.12.1567. [DOI] [PubMed] [Google Scholar]
- Toussaint JF, Lavergne T, Ollitraut J, Hignette C, Darondel JM, De Dieuleveult B, Froissart M, Le Heuzey JY, Guize L, Paillard M. Biventricular pacing in severe heart failure patients reverses electromechanical dyssynchronization from apex to base. Pacing Clin Electrophysio. 2000;23:1731–1734. doi: 10.1111/j.1540-8159.2000.tb07006.x. [DOI] [PubMed] [Google Scholar]
- Cleland JG, Daubert JC, Erdmann E, Freemantle N, Gras D, Kappenberg L, Tavazzi L. Cardiac Resynchronization – Heart Failure (CARE-HF) Investigators. The effect of cardiac resynchronization therapy on morbidity and mortality in heart failure. N Engl J Ned. 2005;352:1539–1549. doi: 10.1056/NEJMoa050496. [DOI] [PubMed] [Google Scholar]
- Gregoratos G, Abrams J, Epstein AE, Freedman RA, Hayes DL, Hlatky MA, Kerber RE, Naccarelli GV, Schoenfeld MH, Silka MJ, Winters SL. ACC/AHA/NASPE 2002 Guideline Update for Implantation of Cardiac Pacemakers and Antiarrhythmia Devices – summary article: a report of the American College of Cardiology/American Heart Association Task Force on Practice Guidelines (ACC/AHA/NASPE Committee to Update the 1998 Pacemaker Guidelines) J Am Coll Cardiol. 2002;40:1703–1719. doi: 10.1016/S0735-1097(02)02528-7. [DOI] [PubMed] [Google Scholar]
- Abraham WT, Hayes DL. Cardiac resynchronization therapy for heart failure. Circulation. 2003;108:1500–1506. doi: 10.1161/01.CIR.0000096580.26969.9A. [DOI] [PubMed] [Google Scholar]
- Lecoq G, Leclercq C, Leray E, Crocq C, Alonso C, de Place C, Mabo P, Daubert C. Clinical and electrocardiographic predictors of a positive response to cardiac resynchronization therapy in advanced heart failure. Eur Heart J. 2005;26:1094–1100. doi: 10.1093/eurheartj/ehi146. [DOI] [PubMed] [Google Scholar]
- Bax JJ, Ansalone G, Breithardt OA, Derumeaux G, Leclercq C, Schalij MJ, Sogaard P, St John Sutton M, Nihoyannopoulos P. Echocardiographic evaluation of cardiac resynchronization therapy: ready for routine clinical use? A critical appraisal. J Am Coll Cardiol. 2004;44:1–9. doi: 10.1016/j.jacc.2004.02.055. [DOI] [PubMed] [Google Scholar]
- Saxon LA, De Marco T, Schafer J, Chatterjee K, Kumar UN, Foster E. VIGOR Congestive Heart Failure Investigators. Cardiomyopathy and Arrhythmia Research and Education effects of long-term biventricular stimulation for resynchronization on echocardiographic measures of remodeling. Circulation. 2002;105:1304–1310. doi: 10.1161/hc1102.105730. [DOI] [PubMed] [Google Scholar]
- Waggoner AD, Agler DA, Adamds DB. Cardiac resynchronization therapy and the emerging role of echocardiography (Part 1): indications and results from current studies. J Am Soc Echocardiogr. 2007;20:70–75. doi: 10.1016/j.echo.2005.10.021. [DOI] [PubMed] [Google Scholar]
- Agler DA, Adams DB, Waggoner AD. Cardiac resynchronization therapy and the emerging role of echocardiography (Part 2); the comprehensive examination. J Am Soc. 2007;20:76–90. doi: 10.1016/j.echo.2005.11.009. [DOI] [PubMed] [Google Scholar]
- Bax JJ, Abraham T, Barold SS, Breithardt OA, Fung JW, Garrigue S, Gorcsan J, Hayes DL, Kass DA, Knuuti J, Leclercq C, Linde C, Mark DB, Monaghan MJ, Nihoyannopoulos P, Schalij MJ, Stellbrink C, Yu CM. Cardiac resynchronization therapy: Part I. Issues before device implantation. J Am Coll Cardiol. 2005;46:2153–2167. doi: 10.1016/j.jacc.2005.09.019. [DOI] [PubMed] [Google Scholar]
- Nishimura RA, Hayes DL, Holmes SR, Tajik AJ. Mechanism of hemodynamic improvement by dual-chamber pacing for severe left ventricular dysfunction: an acute Doppler and catheterization hemodynamic study. J Am Col Cardiol. 1995;25:281–288. doi: 10.1016/0735-1097(94)00419-Q. [DOI] [PubMed] [Google Scholar]
- Jansen AH, Bracke FA, van Dantzig JM, Meijer A, van der Voort PH, Aarnoudse W, van Gelder BM, Peels KH. Correlation of echo-Doppler optimization of atrio-ventricular delay in cardiac resynchronization therapy with invasive hemodynamics in patients with heart failure secondary to ischemic or idiopathic dilated cardiomyopathy. Am J Cardiol. 2006;97:552–557. doi: 10.1016/j.amjcard.2005.08.076. [DOI] [PubMed] [Google Scholar]
- Cazeau S, Bordachar P, Jauvert G, Lazarus A, Alonso C, Vandrell MC, Mugica J, Ritter P. Echocardiographic modeling of cardiac dyssynchrony before and during multisite stimulation: a prospective study. Pacing Clin Electrophysiol. 2003;26:137–143. doi: 10.1046/j.1460-9592.2003.00003.x. [DOI] [PubMed] [Google Scholar]
- Bader H, Garrigue S, Lafitte S, Reuter S, Jaïs P, Haïssaguerre M, Bonnet J, Clementy J, Roudaut R. Intra-left ventricular electromechanical asynchrony. A new independent predictor of severe cardiac events in heart failure patients. J Am Coll Cardiol. 2004;43:248–256. doi: 10.1016/j.jacc.2003.08.038. [DOI] [PubMed] [Google Scholar]
- Bordachar P, Lafitte S, Reuter S, Sanders P, Jaïs P, Haïssaguerre M, Roudaut R, Garrigue S, Clementy J. Echocardiographic parameters of ventricular dyssynchrony validation in patients with heart failure using sequential biventricular pacing. J Am Coll Cardiol. 2004;44:2157–2165. doi: 10.1016/j.jacc.2004.08.065. [DOI] [PubMed] [Google Scholar]
- Bax JJ, Bleeker GB, Marwick TH, Molhoek SG, Boersma E, Steendijk P, van der Wall EE, Schalij MJ. Left ventricular dyssynchrony predicts response and prognosis after cardiac resynchronization therapy. J Am Coll Cardiol. 2004;44:1834–1840. doi: 10.1016/j.jacc.2004.08.016. [DOI] [PubMed] [Google Scholar]
- Prinzen FW, Augustijn CH, Arts T, Allessie MA, Reneman RS. Redistribution of myocardial fiber strain and blood flow by asynchronous activation. Am J Physiol. 1990;259:H300–H308. doi: 10.1152/ajpheart.1990.259.2.H300. [DOI] [PubMed] [Google Scholar]
- Pitzalis MV, Iacoviello M, Romito R, Massari F, Rizzon B, Luzzi G, Guida P, Andriani A, Mastropasqua F, Rizzon P. Cardiac resynchronization therapy tailored by echocardiographic evaluation of ventricular asynchrony. J Am Coll Cardiol. 2002;40:1616–1622. doi: 10.1016/S0735-1097(02)02337-9. [DOI] [PubMed] [Google Scholar]
- Pitzalis MV, Iacoviello M, Romito R, Guida P, De Tommasi E, Luzzi G, Anaclerio M, Forleo C, Rizzon P. Ventricular asynchrony predicts a better outcome in patients with chronic heart failure receiving cardiac resynchronization therapy. J Am Coll Cardiol. 2002;40:536–545. doi: 10.1016/S0735-1097(02)02337-9. [DOI] [PubMed] [Google Scholar]
- Marcus GM, Rose E, Viloria EM, Schafer J, De Marco T, Saxon LA, Foster E. VENTAK CHF/CONTAK-CD Biventricular Pacing Study Investigators. Septal to posterior wall motion delay fails to predict reverse remodeling or clinical improvement in patients undergoing cardiac resynchronization therapy. J Am Coll Cardiol. 2005;45:2208–2216. doi: 10.1016/j.jacc.2005.05.095. [DOI] [PubMed] [Google Scholar]
- Sassone B, Capecchi A, Boggian G, Gabrieli L, Saccà S, Vandelli R, Petracci E, Mele D. Value of baseline left lateral wall postsystolic displacement assessed by m-mode to predict reverse remodeling by cardiac resynchronization therapy. Am J Cardiol. 100:470–5. doi: 10.1016/j.amjcard.2007.02.107. 2007, Aug 1; Epub 2007 Jun 15. [DOI] [PubMed] [Google Scholar]
- Ansalone G, Giannantoni P, Ricci R, Trambaiolo P, Fedele F, Santini M. Doppler myocardial imaging to evacuate the effectiveness of pacing sites in patients receiving biventricular pacing. J Am Coll Cardiol. 2002;39:489–499. doi: 10.1016/S0735-1097(01)01772-7. [DOI] [PubMed] [Google Scholar]
- Bader H, Garrigue S, Lafitte S, Reuter S, Jaïs P, Haïssaguerre M, Bonnet J, Clementy J, Roudaut R. Intra-left ventricular electromechanical asynchrony: a new independent predictor of severe cardiac events in heart failure patients. J Am Col Cardiol. 2004;43:248–256. doi: 10.1016/j.jacc.2003.08.038. [DOI] [PubMed] [Google Scholar]
- Yu CM, Chau E, Sanderson JE, Fan K, Tang MO, Fung WH, Lin H, Kong SL, Lam YM, Hill MR, Lau CP. Tissue Doppler echocardiographic evidence of reverse remodeling and improved synchronicity by simultaneously delaying regional contraction after biventricular pacing therapy in heart failure. Circulation. 2002;105:438–445. doi: 10.1161/hc0402.102623. [DOI] [PubMed] [Google Scholar]
- Innelli P, Sidiropulos M, Galderisi M. Color Tissue Doppler to appropriately select a candidate for resynchronization therapy and test the procedure efficacy. Echocardiography. 2006;23:709–712. doi: 10.1111/j.1540-8175.2006.00294.x. [DOI] [PubMed] [Google Scholar]
- Ghio S, Constantin C, Klersy C, Serio A, Fontana A, Campana C, Tavazzi L. Interventricular and intraventricular dyssynchrony are common in heart failure patients, regardless of QRS duration. Eur Heart J. 2004;25:571–578. doi: 10.1016/j.ehj.2003.09.030. [DOI] [PubMed] [Google Scholar]
- Yu CM, Fung WH, Zhang Q, Sanderson JE, Lau CP. Predictors of left ventricular remodeling after cardiac resynchronization therapy for heart failure secondary to idiopathic or dilated cardiomyopathy. Am J Cardiol. 2003;91:684–688. doi: 10.1016/S0002-9149(02)03404-5. [DOI] [PubMed] [Google Scholar]
- Yu CM, Shang Q, Fung JWH, Chan HC, Chan YS, Yip GW, Kong SL, Lin H, Zhang Y, Sanderson JE. A novel tool to assess systolic asynchrony and identify responders of cardiac resynchronization therapy by tissue synchronization imaging. J Am Coll Cardiol. 2005;45:677–684. doi: 10.1016/j.jacc.2004.12.003. [DOI] [PubMed] [Google Scholar]
- Sogaard P, Egeblad H, Kim WY, Jensen HK, Pedersen AK, Kristensen BØ, Mortensen PT. Tissue Doppler imaging predicts improved systolic performance and reversed left ventricular remodeling during long-term cardiac resynchronization therapy. J Am Coll Cardiol. 2002;40:723–730. doi: 10.1016/S0735-1097(02)02010-7. [DOI] [PubMed] [Google Scholar]
- Mele D, Pasanisi G, Capasso F, De Simone A, Morales MA, Poggio D, Capucci A, Tabacchi G, Sallusti L, Ferrari R. Left ventricular myocardial deformation dyssynchrony identifies responders to cardiac resynchronization therapy in patients with heart failure. Eur Heart J. 2006;27:1070–1078. doi: 10.1093/eurheartj/ehi814. [DOI] [PubMed] [Google Scholar]
- Porciani MC, Lilli A, Macione R, Cappelli F, Demarchi G, Pappone A, Ricciardi G, Padeletti L. Utility of a new left ventricular asynchrony index as a predictor of reverse remodeling after cardiac resynchronization therapy. Eur Heart J. 2006;27:1818–1823. doi: 10.1093/eurheartj/ehl133. [DOI] [PubMed] [Google Scholar]
- Yu CM, Fung JW, Zhang Q, Chan CK, Chan YS, Lin H, Kum LC, Kong SL, Zhang Y, Sanderson JE. Tissue Doppler imaging is superior to strain rate imaging and postsystolic shortening on the prediction of reverse remodeling in both ischemic and nonischemic heart failure after cardiac resynchronization therapy. Circulation. 2004;110:66–73. doi: 10.1161/01.CIR.0000133276.45198.A5. [DOI] [PubMed] [Google Scholar]
- Marwick T. Measurement of strain and strain rate by echocardiography: ready for prime time? J Am Coll Cardiol. 2006;47:1313–1327. doi: 10.1016/j.jacc.2005.11.063. [DOI] [PubMed] [Google Scholar]
- Galderisi M. Can technical limitations of strain rate imaging be overtaken by particular arrangements. J Am Coll Cardiol. 2006;48:1729. doi: 10.1016/j.jacc.2006.07.020. [DOI] [PubMed] [Google Scholar]
- Suffoletto MS, Dohi K, Cannesson M, Saba S, Gorcsan J. Novel speckle-tracking radial strain from routine black-and-white echocardiographic images to quantify dyssynchrony and predict response to cardiac resynchronization therapy. Circulation. 2006;113:960–968. doi: 10.1161/CIRCULATIONAHA.105.571455. [DOI] [PubMed] [Google Scholar]
- Kapetanakis S, Kearney MT, Siva A, Gall N, Cooklin M, Monaghan MJ. Real-time three-dimensional echocardiography: a novel technique to quantify global left ventricular mechanical dyssynchrony. Circulation. 2005;112:992–1000. doi: 10.1161/CIRCULATIONAHA.104.474445. [DOI] [PubMed] [Google Scholar]
- Burgess MI, Jenkins C, Chan J, Marwick TH. Measurement of left ventricular dyssynchrony in patients with ischaemic cardiomyopathy: a comparison of real-time three-dimensional echocardiography and tissue Doppler echocardiography. Heart. 2007 Mar 7. [DOI] [PMC free article] [PubMed]
- Badano LP, Baldassi M, Tosoratti E, Zakja E, Pavoni D, Dall'Armellina E, Gianfagna P, Fioretti PM. 3D echocardiography reduces the time needed to assess left ventricular synchronicity in heart failure patients with clinical indication to cardiac resynchronization therapy. (abs) Eur Heart J. 2006;27:822. [Google Scholar]
- Badano LP, Baldassi M, Tosoratti E, Zakja E, Pavoni D, Dall'Armellina E, Gianfagna P, Fioretti PM. Accuracy of 3D echocardiography in assessing left intra-ventricular synchronicity using tissue synchronization imaging. (abs) Eur Heart J. 2006;27:859. [Google Scholar]
- Van de Veire N, Bleeker GB, Ypenburg C, De Sutter J, Marsan NA, Holman ER, van der Wall EE, Schalij MI, Bax JJ. Usefulness of triplane Tissue Doppler Imaging to predict Acute Response to cardiac resynchronization therapy. Am J Cardiol. 2007;100:476–482. doi: 10.1016/j.amjcard.2007.03.051. [DOI] [PubMed] [Google Scholar]
- Hunt SA, Abraham WT, Chin MH, Feldman AM, Francis GS, Ganiats TG, Jessup M, Konstam MA, Mancini DM, Michl K, Oates JA, Rahko PS, Silver MA, Stevenson LW, Yancy CW, Antman EM, Smith SC, Jr, Adams CD, Anderson JL, Faxon DP, Fuster V, Halperin JL, Hiratzka LF, Jacobs AK, Nishimura R, Ornato JP, Page RL, Riegel B, American College of Cardiology American Heart Association Task Force on Practice Guidelines American College of Chest Physicians; International Society for Heart and Lung Transplantation; Heart Rhythm Society. ACC/AHA Guideline Update for the Diagnosis and Management of Chronic Heart Failure in the Adult: a report of the American College of Cardiology/American Heart Association Task Force on Practice Guidelines (Writing Committee to Update the 2001 Guidelines for the Evaluation and Management of Heart Failure): developed in collaboration with the American College of Chest Physicians and the International Society for Heart and Lung Transplantation: endorsed by the Heart Rhythm Society. Circulation. 2005;112:e154–235. doi: 10.1161/CIRCULATIONAHA.105.167586. Epub 2005 Sep 13. [DOI] [PubMed] [Google Scholar]
- Swedberg K, Cleland J, Dargie H, Drexler H, Follath F, Komajda M, Tavazzi L, Smiseth OA, Gavazzi A, Haverich A, Hoes A, Jaarsma T, Korewicki J, Lévy S, Linde C, Lopez-Sendon JL, Nieminen MS, Piérard L, Remme WJ, Task Froce for the Diagnosis and Treatment of Chronic Heart Failure of the European Society of Cardiology Guidelines for the diagnosis and treatment of chronic heart failure: executive summary (update 2005): The Task Force for the Diagnosis and Treatment of Chronic Heart Failure of the European Society of Cardiology. Eur Heart J. 2005;26:1115–1140. doi: 10.1093/eurheartj/ehi166. Epub 2005 May 18. [DOI] [PubMed] [Google Scholar]
- Adams KF, Lindenfeld J, Arnold JMO, Baker DW, Barnard DH, Baughman KL, Bohemer JP, Deedwania P, Dunbar SB, Elkayam U, Gheorgiade M, Howlett JK, Konstam MA, Kronenberg MW, Massie BM, Mehra MR, Miller AB, Moser OK, Patterson JH, Rodeheffer RJ, Sackner-Bersnstein J, Silver MA, Starling RC, Stevenson LW, Wagoner LE. Executive Summary : HFSA 2006 Comprehensive Heart Failure Practice Guideline. J Cardiac Failure. 2006;12:10–38. doi: 10.1016/j.cardfail.2005.12.001. [DOI] [Google Scholar]
- Arnold JM, Liu P, Demers C, Dorian P, Giannetti N, Haddad H, Heckman GA, Howlett JG, Ignaszewski A, Johnstone DE, Jong P, McKelvie RS, Moe GW, Parker JD, Rao V, Ross HJ, Sequeira EJ, Svendsen AM, Teo K, Tsuyuki RT, White M. Canadian Cardiovascular Society. Canadian Cardiovascular Society consensus conference recommendations on heart failure 2006: diagnosis and management. Can J Cardiol. 2006;22:23–45. doi: 10.1016/s0828-282x(06)70237-9. [DOI] [PMC free article] [PubMed] [Google Scholar]


