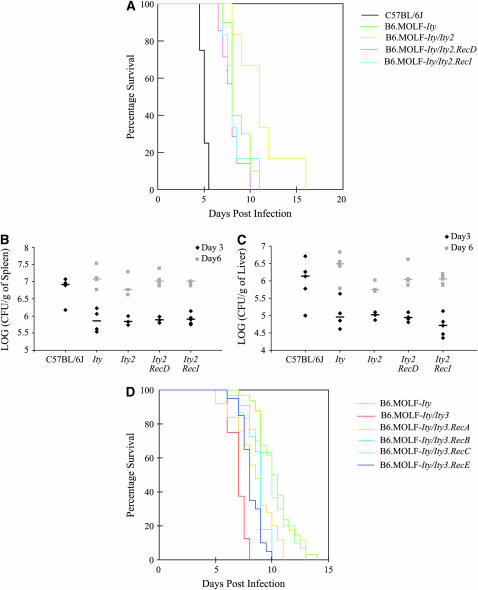
Figure 3.—
Phenotypic characterization of the Ity2 and Ity3 congenic mice. Survival curves for Ity2 congenic mice are shown in A. One representative survival experiment of seven is shown here. There were at least six mice in each group of mice tested. Bacterial load in the spleen (B) and the liver (C) of the Ity2 congenics are represented as log (CFU/g of organ). Groups of three to four mice were used for CFU enumeration for each time point; median for each group is shown as a bar. Survival of Ity3 congenic mice is shown in D. Samples from three independent experiments using at least eight mice per group were pooled and represented here.

