

Abstract
Phenotypic loss is an important evolutionary force in nature but the mechanism(s) responsible for loss remains unclear. We used both simulation and multiple-regression approaches to analyze data on the loss of sporulation, a complex bacterial developmental process, during experimental evolution of Bacillus subtilis. Neutral processes of mutational degradation alone were sufficient to explain loss-of-sporulation ability in four of five populations, while evidence that selection facilitated mutational loss was found for only one population. These results are discussed in the context of the evolution of sporulation in particular and phenotypic loss in general.
PHENOTYPIC loss has occurred in lineages throughout the tree of life, as noted by Darwin (1859, pp. 134–139). Well-known examples of phenotypic loss include digit and limb loss in tetrapods (Lande 1978; Bejder and Hall 2002), wing loss in insects and birds (Roff 1990, 1994; Fong et al. 1995), losses of vision and pigmentation in animals inhabiting subterranean environments (reviewed in Culver 1982; Fong et al. 1995), the loss of sexually selected traits (Wiens 2001), and the loss of sexual reproduction in many eukaryotic species (Bell 1982; Richards 1986; Judson and Normark 1996).
Whereas these examples are compelling in their diversity, phenotypic loss is certainly not unique to eukaryotes. Bacteria are notorious for their high level of within-species genotypic and phenotypic variation, an observation consistently supported by comparisons of gene content in the genomes of closely related bacteria (reviewed in Bentley and Parkhill 2004; Feil 2004; Lawrence and Hendrickson 2005). Although a portion of the variation in gene content can be attributed to the acquisition of DNA via lateral gene transfer, it is clear that genetic material is deleted when it is not used (Mira et al. 2001; Moran and Mira 2001), which could be either a cause or a consequence of phenotypic loss. While a retrospective view of gene loss is informative, much of comparative genomics leaves the process of phenotypic loss in a black box and leaves an important question unanswered: can phenotypic loss be attributed to natural selection? Knowing whether adaptive processes are responsible for phenotypic loss can help us to understand the evolutionary processes producing phenotypic variation and resulting in ecological specialization.
The reduction or loss of a phenotype can only spread/become fixed in a population if selection for its development is relaxed or eliminated. The “mutational degradation” (MD) hypothesis posits that phenotypic loss occurs as a neutral process (Culver 1982; Fong et al. 1995). Mutations that degrade functionality are normally detrimental, but when selection on that function is relaxed these mutations become effectively neutral and can accumulate.
In contrast, the selection hypothesis posits that loss is favored to alleviate physiological or genetic costs associated with the phenotype (Wright 1929, 1964; Culver 1982; Fong et al. 1995). Phenotypic development is inevitably physiologically costly and the reallocation of resources from a phenotype under relaxed selection to phenotypes important for fitness might be advantageous. Phenotypic plasticity will tend to reduce physiological costs, although it will not completely eliminate them; for example, there may be physiological costs associated with monitoring environmental conditions. Genetic costs come in the form of pleiotropy, where one gene is involved in the production of more than one phenotype. Pleiotropy can constrain the evolution of pairs of phenotypes if mutations that increase functionality of one phenotype decrease functionality of another (i.e., antagonistic pleiotropy) (Baatz and Wagner 1997; Hansen 2003). Releasing pleiotropic constraints by relaxing selection on one phenotype may allow the optimization of other phenotypes important for fitness.
Because mutational bias will always favor trait loss, and neutral processes are always occurring, MD will inevitably contribute to trait loss at some level. The real question therefore is whether selection must be invoked to explain any particular case of phenotypic loss. Studies in microbes suggest that selection can favor phenotypic loss but need not. It has been shown that selection was involved in the loss of metabolic breadth and thermal tolerance in experimental populations of Escherichia coli (Cooper and Lenski 2000; Cooper et al. 2001). It was reported that sexual reproduction in yeast was lost to optimize asexual fitness (Zeyl et al. 2005). Other work has shown that in bacterial populations with high mutation rates (mutators), MD is able to explain the decline in phenotypes (Funchain et al. 2000; Giraud et al. 2001; Nilsson et al. 2004).
Perhaps the best example of phenotypic loss due to MD alone is in the endosymbiotic bacteria found in insects. The small effective population sizes of these bacteria result in their coding regions evolving more quickly than is seen in their free-living relatives (Moran 1996; Wernegreen and Moran 1999), an effect that is exacerbated by the loss of DNA repair functions (Dale et al. 2003). Clearly selection has not been important for phenotypic loss in these bacteria, since accelerated MD has been occurring for millions of years.
One may be tempted to conclude from these studies that in populations with large effective population sizes and low wild-type mutation rates, selection favors trait loss, while in populations with small effective population sizes and/or high mutation rates, MD alone can explain trait loss. This is supported by recent theoretical work showing that for small enough effective population sizes, trait loss is driven by mutation (Masel et al. 2007). For sufficiently large populations, mutation and selection have similar effects on the rate at which a trait is lost, depending on the relative magnitudes of their respective parameters (Masel et al. 2007). This result prevents us from deriving a general mechanism of trait loss in microbes without knowledge of both functional mutation rates and selection coefficients.
To test explicitly whether selection must be invoked to explain the loss of phenotypes, we evolved populations of Bacillus subtilis under relaxed selection for sporulation. [This experiment also followed the evolution of populations with strong selection for sporulation, which are discussed elsewhere (Maughan and Nicholson 2004; Maughan et al. 2006)]. Sporulation is the process by which vegetative cells develop into dormant spores, involving upwards of 200 genes in the best-studied spore former B. subtilis and requiring at least 6 hr to complete (Sonenshein et al. 2002). Although we were unable to determine the population genetic cause of prototrophy loss in the nonsporulating populations (Maughan et al. 2006), we hypothesized that sporulation would be a model phenotype in which to test hypotheses of trait loss because it is both physiologically and genetically costly; development from vegetative cells into spores takes time and energy, and several of the genes involved in sporulation are known to be required for other phenotypes, i.e., are pleiotropic. Our hypothesis for the mutational basis of sporulation loss via MD or selection is depicted in Figure 1.
Figure 1.—

Mutational basis for degradation of and selection for sporulation loss. Sporulation genes comprise almost 5% of the B. subtilis genome and mutation rates to the Spo− phenotype and point mutation rates were measured previously. Each mutation that occurs at a sporulation locus can either be neutral with respect to fitness, i.e., selection coefficient equal to zero, or selection can favor or reject such mutations, i.e., selection coefficient greater than or less than zero, respectively. The population genetic cause of sporulation loss will depend on the probability that a Spo− mutation is neutral vs. selected.
We measured sporulation ability at intervals throughout the evolution of the experimental B. subtilis populations and show here that sporulation ability declined or was lost in all populations. To determine whether selection could explain sporulation loss, we used experimentally measured population genetic parameters (Table 1) to model the decline of sporulation both statistically via a multiple-regression analysis and by numerical simulation of the experimental protocol. The results show that mutational degradation alone is sufficient to explain the loss of sporulation in four of five populations and that a combination of mutational degradation and selection was responsible for the loss of sporulation in the fifth population. Our analysis of publicly available gene-expression data shows that many sporulation genes are transcribed at times when sporulation is not induced. This reaffirms that some sporulation genes are pleiotropic and that it is possible that pleiotropy is involved in the selected loss of sporulation in one population.
TABLE 1.
Important parameters used and discussed in this article
| Parameter | Value(s) | Reference |
|---|---|---|
| Ne | ∼1 × 10⁷ cells | Maughan et al. (2006) |
| Point mutation rate (per bp) | Ranges from 7 × 10⁻⁹ to 4 × 10⁻⁷ | Maughan et al. (2006) |
| Functional mutation rate | 0.003 in mutator | Masel and Maughan (2007) |
| Distribution of sporulation frequencies [in clonal populations (Figure 2)] | Mean: 0.581 Variance: 0.165 | This work |
| Theoretical sojourn time for fixation of sporulation deficient mutant | Depends on single population vs. metapopulation model, as well as Ne, m, and s. | Masel et al. (2007) |
MATERIALS AND METHODS
Experimental evolution of B.subtilis populations:
The design and details of the experimental evolution system were previously described in detail (Maughan et al. 2006). Briefly, five populations with a neutral genetic marker conferring resistance to spectinomycin, designated 624A–624E, were evolved with relaxed selection for sporulation imposed by cultivating in liquid Difco sporulation medium (DSM) (Schaeffer et al. 1965) lacking the “sporulation salts” CaCl2, MnCl2, and FeSO4, but containing 25 μg spectinomycin/ml and a final concentration of 1% (w/v) glucose, a potent repressor of sporulation (Schaeffer et al. 1965). For the induction of sporulation (see below), sporulation salts were added and glucose omitted from the medium. These nonsporulating (NS) populations were diluted 1:100 into fresh medium each day.
Estimation of mutation rate of Spo+ to Spo−:
The functional mutation rate to Spo− (sporulation deficiency) from Spo+ (sporulation proficiency) was estimated as described elsewhere (Masel and Maughan 2007). Briefly, spores from a population evolved for 6000 generations with strong selection for sporulation were diluted and plated on sporulation-inducing medium (Schaeffer et al. 1965). Sporulation mutants were initially identified by their characteristic lack of brown pigment (Piggot and Coote 1976). Colonies were incubated for 3–4 days before examining pigmentation. Because cells in a colony are not synchronized for sporulation initiation, this extended incubation period was crucial to our mutant screen as it allowed sufficient time for all Spo+ cells to sporulate. Spo− colonies were examined using phase contrast microscopy to further quantify the phenotype. Of 7244 colonies inspected, 44 were lacking pigment; 12 of these were reduced (<50% spores) and 10 of these were severely reduced (<1–2% spores) in the number of spores produced within the colony when compared to a wild-type colony (∼70–80% spores) (Masel and Maughan 2007). These frequencies directly give the rates of two classes of functional mutations. These two classes of mutant were treated separately in the simulations (see below) and were represented by reductions in sporulation efficiency by factors of 2 and 26, respectively.
Point mutation rates previously measured at 1000-generation intervals (Maughan et al. 2006) were used to estimate the functional mutation rate in all populations at all time points. The functional mutation rate was assumed to be proportional to the point mutation rate, and point mutation rates were estimated by linear interpolation of the logarithm of the mutation rate vs. time. Note that the single population used to estimate the functional mutation rate was assayed to have a relatively high point mutation rate according to the fluctuation test (Masel and Maughan 2007), and so the functional mutation rate in a more typical, nonmutator population is expected to be one order of magnitude smaller.
Measuring sporulation frequencies:
At ∼200-generation intervals, sporulation frequencies of the nonsporulating populations were determined as follows. Cultures were inoculated into fresh medium from frozen stocks and allowed to acclimate for 24 hr. These overnight cultures were then diluted 1:100 into 10 ml of medium lacking glucose (the sporulation inhibitor) for the induction of sporulation. After 24 hr of cultivation, cultures were diluted and plated before and after heat-shocking the culture (80°, 10 min). The sporulation frequency was determined by dividing the titer after heat shock (spores, S) by the titer before heat shock (viable cells and spores, V). The time to loss of sporulation was determined as the number of generations until spores were undetectable with our limit of detection being <2 × 10⁻⁷ spores. For each population at each ∼200-generation interval, sporulation induction was performed twice.
The probability distribution of sporulation frequency in a clonal population (barring any mutations that had occurred during the several generations of overnight growth) was measured experimentally by inoculating 10 cultures, from 1 seed culture of the ancestral population, into sporulation-inducing medium. Each of the 10 cultures was grown under identical conditions for 24 hr and colonies were counted before and after heat shock. The number of colonies before heat shock represents viable cells and spores in the culture (V) and the number of colonies after heat shock represents only the viable spores (S) in the culture so that the sporulation frequency is S/V. This experiment was performed twice.
Spo+/Spo− competition experiments:
During the development of spores, wild-type (Spo+) cells produce a brown pigment and most mutants defective in sporulation (Spo− mutants) do not, resulting in a relatively simple visual screen to distinguish between Spo+ (brown) and Spo− (white) colonies (Piggot and Coote 1976). Spo− mutants were isolated from the evolved nonsporulating populations by the following method. An aliquot of frozen stocks from the 1000-generation stock of 624A–E populations was spread on a plate of sporulation-inducing medium. After incubation at 37° for 1 day and at room temperature for 2–3 additional days, pigmented and nonpigmented colonies were chosen at random for restreaking on a fresh plate for the isolation of single colonies. After another 3- to 4-day incubation period the pigmentation level was checked for its heritability and only those colonies whose pigmentation level was constant upon restreaking events were chosen for further analysis. Subsequent visualization of colonies under the microscope and growth under sporulation-inducing conditions, followed by heat-shock treatment to determine sporulation ability, was performed to verify the sporulation phenotype of the isolates.
Competition experiments were performed by inoculating equal volumes (0.05 ml) of overnight culture from Spo+ and Spo− strains into 9.9 ml of sporulation-repressing medium. Immediately upon inoculation, and then again after 24 hr, dilution plating on sporulation-inducing medium was performed to determine the relative number of Spo+ and Spo− cells within a culture. After overnight incubation at 37°, colonies were counted to determine the total number of colonies present. After incubation at room temperature for 3–4 days, Spo+ and Spo− colonies were distinguished using pigmentation as a marker for the sporulation phenotype. The selection-rate constant (Lenski et al. 1991; Travisano and Lenski 1996) was calculated to determine the fitness of the Spo− mutants relative to the Spo+ strains.
Microarray data:
Fifty-seven B. subtilis microarray data sets were downloaded from the KEGG Expression Database (http://www.genome.ad.jp/dbget-bin/get_htext?Exp_DB+-n+B). Each file contained the expression signal for the control, control background, target, and target background (target and control samples usually refer to a mutant and wild-type genotype, respectively). The experimental conditions (media used, temperature of growth, genotype of the strain, and when in the life cycle cells were harvested for RNA) for the control and target for each file were also available from the KEGG Expression Database. We excluded those experiments where cells were grown in sporulation-inducing medium, thus retaining 39 of the 57 data sets.
Control and target samples, which are both hybridized to one slide, represent 2 separate experimental measures of gene expression within the particular strain, resulting in 78 total measures of gene expression per gene. To obtain an estimate of absolute expression values, the foreground intensity for each experiment was divided by the background intensity for the experiment (rather than subtracting background), and only genes that had a median foreground intensity across all 78 measurements that was fivefold above background intensity were considered to be expressed in nonsporulation-inducing environments. While large fluctuations in background signal could produce spurious measures of absolute expression, this seems unlikely for the following reasons. For most experiments, background intensities did not vary by more than one order of magnitude and the median rather than the mean absolute expression level over the 39 experiments was used to remove the effects of extreme values.
Multiple-regression analysis:
Linear models were constructed to predict the logarithm of sporulation frequency. Variables used for the prediction were the point mutation rate, generations of evolution, and cumulative mutation (described below). Point mutation rates were measured at 1000-generation intervals using fluctuation tests (Maughan et al. 2006). Linear interpolation of the logarithm of measured point mutation rates was used so that mutation rates were available for all time points at which sporulation frequency was measured.
Mutation accumulation:
The accumulation of mutations over time, resulting in the loss of sporulation, can be represented by the cumulative-mutation variable. Let the proportion of sporulators in a population be given by x and the rate of mutation from sporulation proficiency to sporulation deficiency be given by m. Neutral mutations accumulate at a rate given by their appearance, Nemx, multiplied by the probability that they are not rapidly lost due to drift, 1/Ne. Thus, sporulation frequency is predicted to decline, due to the accumulation of neutral mutations (MD), at rate mx, i.e., according to the exponential rate m. This means that the logarithm of the sporulation frequency resulting from mutation accumulation over time will be predicted by the integral of the mutation rate. This integral is referred to as the cumulative-mutation variable and was calculated throughout the evolution experiment by linearly interpolating the logarithm of the mutation rate between time points. The cumulative-mutation variable represents the cumulative effects of mutations resulting in functional degradation under a scenario where the loss of sporulation is neutral.
Positive selection:
Under a positive selection scenario, sporulation mutants may increase in frequency due to indirect selection for a mutation causing the loss of sporulation. Since we have mNe > 1 (Masel and Maughan 2007), mutation rates and selection coefficients are predicted to have similar effects on the trajectory of trait loss (Masel et al. 2007). By symmetry, this results in the logarithm of the proportion of the population able to sporulate being significantly predicted by the integral of the selection coefficients (s) (associated with mutations reducing sporulation efficiency) over the duration of the evolution experiment. Assuming that these selection coefficients are approximately constant, and taking the integral of a constant over time, we obtain the number of elapsed generations as a variable to determine the significance of positive selection in explaining variation in sporulation ability.
Negative selection:
The strength of purifying (negative) selection can be approximated by mutation-selection equilibrium, with mutant frequency equal to m/s, making the logarithm of the frequency of sporulators equal to ln(1 − m/s). When m/s ≪ 1, this can be approximated by −m/s. If we assume that the selection coefficient is constant over time, then the mutation rate can be used as a variable to determine the importance of negative selection in explaining variation in the logarithm of sporulation ability.
Multiple regressions were done in R (version 2.2.0; R Development Core Team 2004) for each population separately and y-intercepts were forced to equal the ancestral level of sporulation (58%; see Measuring sporulation frequencies above). Mutational degradation must always occur, and so the cumulative-mutation variable was present in all models. Since mutational target size is equal in all populations, at least initially, the regression coefficient associated with the cumulative-mutation variable should be equal across populations. We therefore estimated this coefficient by a single multiple regression, combining data from all populations so that one mutation has an equal effect in any population. Multiple regressions were then done separately for each population both by “building down,” i.e., adding all variables and then subtracting nonsignificant variables, and by “building up,” i.e., adding variables one at a time and then adding those that were significant in combination, while holding constant the regression coefficient of the cumulative-mutation variable. Significance of the variables was assessed via ANOVAs. The parameters that were found to be significant for each population were then used in a multiple regression with data from all populations to reestimate the regression coefficient of the cumulative-mutation variable. This was repeated until both the identity of the explanatory variables for each population and the regression coefficient of the cumulative-mutation variable converged.
The analysis described above assumes, as part of the null hypothesis, that mutational degradation occurs. To search for independent statistical support for this assumption, we compared the regression model identified using the above model to the best regression model found in the absence of the cumulative-mutation variable. Comparisons between the coefficient of multiple determination from each regression were done to confirm whether the cumulative-mutation variable was essential to explaining a significant amount of variation in sporulation frequency (Equation 16.14, Sokal and Rohlf 1995). The residuals from models with and without the cumulative-mutation variable were homoscedastic and normally distributed (Shapiro–Wilk test for normality, P = 0.25 and P = 0.08, respectively).
Simulations:
Each of the 892 days of the experiment was simulated as 100-fold growth of the population, followed by a representative dilution. This means that we assume that cell death was negligible and that the average number of generations per day could be inferred from the fact of 100-fold growth. Although an appreciable level of cell death within a 24-hr period is not known to occur in laboratory cultures of bacteria, we cannot exclude that cell death may have been an important contributor to fitness. Note that if cell death was significant, then our method would consistently underestimate the true number of generations in the experiment.
The proportions of individuals with different genotypes specifying their sporulation efficiencies were tracked over time. Wild-type individuals are denoted Spo0, and individuals of genotype Spoi have sporulation efficiencies reduced by a factor of 2i relative to the wild type. The ancestral population is assumed to be 100% Spo0 with each genotype sporulating at a frequency of 58% on average (see below). Genotypes with i > 23 have sporulation efficiencies below the detection threshold and are grouped together in a single class of genotypes Spo∞.
Mutation was allowed to occur according to the two observed mutational classes (a reduction in sporulation by a factor of 2 or 26). In the reference population in which functional mutation rates were directly measured, each individual mutated from genotype Spoi to genotype Spoi+1 with probability m1 = 12/7244 and from genotype Spoi to genotype Spoi+6 with probability m2 = 10/7244. Measurement error in these measured functional mutation rates is also simulated, as described in the section below. Values for m1 and m2 in the population and time point of interest were calculated by assuming that functional mutation rates are proportional to the point mutation rate. Linear interpolation of the logarithm of measured point mutation rates was used to make both point and functional mutation rates available for each day of the experiment.
Following mutation, selection occurs according to differential growth rates. We know that the nonsporulators evolved growth rates that were faster than the ancestor (Maughan et al. 2006) and although we do not know if an increased growth rate trades off for sporulation decline, growth rate is nevertheless a component of fitness. Simulating selection on differential growth rates is therefore reasonable. The Malthusian parameter corresponding to genotype Spoi is assumed to be proportional to  where s describes the strength of selection. The number of individuals in each genotype class now obeys the set of differential equations given by
 |
where Spoi = 0 for i < 0 and Spoi is replaced by Spo∞ for i > 23. This set of differential equations was solved numerically using Mathematica 5.2 for a 100-fold increase in total population size during each of the 892 days of the experiment.
Variance in observed and simulated data:
Several sources of variation contribute to standard errors. The first is inherent stochasticity associated with genetic drift. In our case, since mN ≫ 1 and N is large, this source of stochasticity is negligible. This was confirmed using stochastic simulations (not shown). The second is the large environmental component governing the induced frequency of sporulation. The loss of sporulation where this environmental variance is taken into account is depicted in Figure 2A. The Spo0 ancestral genotype was estimated to sporulate with mean frequency 0.581 and standard deviation 0.165 (see details of measurement above in Measuring sporulation frequencies). This distribution of sporulation frequencies closely fit a beta distribution and therefore, the simulated sporulation frequencies at each time point consist of mean sporulation ability of the genotypes present, relative to the Spo0 ancestor, multiplied by a random variable sampled from a beta distribution with mean 0.581 and variance 0.165 (Figure 2B).
Figure 2.—

Stochastic variation in sporulation ability. (A) A hypothetical example of sporulation loss when environmental variance is considered. In ancestral B. subtilis, 100% sporulation is uncommon and on average only 58% of cells will sporulate. This has implications for simulating sporulation loss and interpreting the observed decline in sporulation ability. (B) The cumulative frequency distribution of sporulation frequencies taken from separate, but clonal, populations (solid line, observed). This distribution represents the environmental variance and its influence on sporulation frequency and is well fitted by a beta distribution (dashed line, fitted).
A third source of error is in our measurement of the mutation rates. To simulate this, for each experiment we replaced our estimates m1 = 12/7244 and m2 = 10/7244 by resampling the numbers 12 and 10 from binomial distributions with probabilities 12/7244 and 10/7244 respectively, using the bnldev algorithm (Press et al. 1992). Resampled raw data from the fluctuation test were also used to derive resampled point mutation rates for each simulated experiment. Note that we do not capture additional error in the estimation of mutation rates stemming from the inadequacy of interpolation.
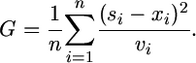
Simulations were run with different values of the selection coefficient s. For each value of s, up to 1000 simulated experiments were run and the means and standard errors of the logarithm of sporulation frequency were calculated at each time point in the simulated experiments. A goodness-of-fit score G was calculated from the simulated means x1, … , xn and simulated variances v1, … , vn corresponding to observed data points s1, … , sn according to
 |
The value of s that minimized G was found numerically for each population. The 95% confidence intervals shown in Figure 3 were obtained by direct reference to the randomized results for 1000 simulations.
Figure 3.—

The observed and simulated loss of sporulation. The top, middle, and bottom rows represent the simulated s = 0 fit, the simulated s = best fit, and straight-line fit, respectively. The five columns represent the five replicate populations. The asterisks are the observed data. Ninety-five percent confidence intervals are shown for the simulated data. Goodness-of-fit and s values are listed for each graph of simulated data. Each observed data point is the average of two measures. Note that the y-axis is a log scale and that the detection limit is visible in the simulated data.
Straight-line fit:
If mutation rates are better described as constant than they are by our interpolated estimates, or if positive selection (with a constant selection coefficient) dwarfs the effect of mutation, then the decline in the logarithm of sporulation frequency will be at least as well described by a straight line as by the simulation curves described above. Assuming a constant error function over the course of the experiment, we fitted a straight-line regression for each population, with a time = 0 intercept constrained to equal 0.58, the mean sporulation frequency of a Spo+ population. Unfortunately, differences in the error function mean that it is not appropriate to compare residual sums of squares to values of G calculated as described above, and so the different fitted curves were assessed visually.
RESULTS
Loss of sporulation and the mechanisms potentially responsible:
Loss of sporulation:
After 6000 generations of evolution in sporulation-repressing conditions, all five populations were tested for their ability to sporulate when cultured under inducing conditions. Sporulation ability was observed to be completely lost in three populations (624B, 624C, 624E), severely reduced in 624A, and reduced by an order of magnitude in 624C. The sojourn times for loss of sporulation in 624B, 624D, and 624E were 6000, 5800, and 4200 generations, respectively. The observed decline in sporulation could be explained by three nonmutually exclusive mechanisms: MD, positive selection for sporulation loss, and negative selection against sporulation loss.
Potential for MD:
Because the time to fixation for a neutral mutation is 2Ne (Kimura and Ohta 1969) and these experimental populations have an Ne ≈ 1 × 10⁷ cells (Maughan et al. 2006), it may seem that sporulation loss could not occur in 6000 generations by MD alone. However, it is not necessary that mutations causing the loss of function actually become fixed. Sporulation is a polygenic trait, and could be lost via a “soft sweep” in which each individual has at least one of a number of loss-of-function mutations, even though no single loss-of-function mutation is present in all individuals (Hermisson and Pennings 2005). With the high functional mutation observed in these populations (Masel and Maughan 2007), this is almost certainly the case.
Potential for selection:
We attempted to quantify the level of pleiotropy between sporulation and other cellular processes by determining whether genes involved in sporulation are expressed when sporulation is not induced. There are 210 genes that have been experimentally verified to be involved in sporulation (Piggot and Losick 2002). We looked across 39 publicly available microarray experiments and found that 45 of these 210 sporulation genes show a median transcription level fivefold above the background signal. Thus, 21% of sporulation genes can be considered to be transcribed when sporulation is not induced, i.e., are pleiotropic. Many of these genes are known to be involved in other cellular processes, such as cell division and transcription of housekeeping genes.
Sporulation is induced during the transition between growth and stationary phases. The stages of the life cycle at which transcript levels were monitored include exponential growth, stationary phase, and the transition from growth to stationary phases. When these phases are analyzed separately, 39 of 45 genes show median transcript levels fivefold above background in all three life-cycle stages, supporting the conclusion that some genes involved in sporulation are induced when sporulation is not. An important caveat following these results is that transcript level may not have a linear relationship with expression level due to regulation at the level of translation or posttranslational protein modifications, which could result in 21% being an overestimate. However, because we used a very conservative definition of transcription (median of fivefold above background signal across all 78 experimental measurements), which is likely to underestimate the number of genes transcribed, our result is at least representative of the proportion of sporulation genes that are involved in other cellular processes. Therefore, a considerable level of pleiotropy exists for genes involved in sporulation, suggesting that there is the potential for selection to influence the loss of sporulation.
Statistical modeling of sporulation loss:
Multiple-regression analysis was performed separately for each population to determine which variables were able to explain the observed decline in sporulation ability. Population variables included generations of evolution, representing positive selection; mutation rate, representing negative selection; and the cumulative-mutation variable, representing MD (see materials and methods for the derivations of these variables).
We knew a priori that mutations affecting sporulation occur at an appreciable rate (Masel and Maughan 2007), and hence that mutational degradation is occurring and will contribute (either appreciably or negligibly) to the decline in sporulation ability. The populations all originate from a common ancestor, and hence a common mutational target size, and our statistical method assumes that mutational target size does not change during the course of evolution. This means that a single mutation is equally likely to affect sporulation regardless of which population it occurs in, and hence that the regression coefficients associated with the cumulative-mutation variable will be constant across the five populations. This single regression coefficient was therefore estimated using combined data across all five populations (see material and methods for a detailed discussion of the multiple regressions). Multiple- regression analysis was then used to identify—for each separate population—the variable(s) able to explain a significant portion of sporulation decline. The results from these multiple regressions are shown in Table 2.
TABLE 2.
Multiple regression results
| Statistical model including which variables were supported
|
|||
|---|---|---|---|
| Population | Constant cumulative-mutation variable | Cumulative-mutation variable excluded | Comparisona |
| 624A | Generations of evolution mutation rate (R2 = 0.954) | Generations of evolution mutation rate (R2 = 0.956) | NA |
| 624B | Generations of evolution mutation rate (R2 = 0.976) | Generations of evolution mutation rate (R2 = 0.975) | P = 0.035 |
| 624C | Generations of evolution (R2 = 0.6911) | Generations of evolution (R2 = 0.6909) | P = 0.13 |
| 624D | Generations of evolution (R2 = 0.943) | Generations of evolution (R2 = 0.942) | P = 0.08 |
| 624E | Generations of evolution (R2 = 0.948) | Generations of evolution (R2 = 0.947) | P = 0.27b |
ANOVA comparison between the two models (see materials and methods).
These models are not nested and therefore this test is not entirely valid.
Although we know a priori that mutational degradation must be occurring, we also tested whether the cumulative-mutation variable was necessary to explain a significant portion of the decline in sporulation ability. To do this, we repeated the multiple-regression analyses with the cumulative-mutation variable excluded from the list of explanatory variables (Table 2). The coefficient of multiple determination from the two regressions for each population were compared to determine whether the coefficient from the regression with the cumulative-mutation variable was significantly better than the regression without. The results of these tests are shown in Table 2.
As shown in Table 2, the addition of the cumulative-mutation variable was significant in only one (624B) of the five populations and even in this population its inclusion barely increased the R2 value. Because we know that mutational degradation must be occurring, this result suggests that our measure of cumulative mutation is insufficient to capture the true magnitude of cumulative mutation. The most likely reason for this is that point mutation rates were measured at insufficient density during the course of the experiment, given their (unexpectedly) high lability, and hence that important features of the time course of the mutation rate were missed. The lack of sufficient sampling is supported by the mutation-rate time course shown in Figure 4A in Maughan et al. (2006). We see that if one mutation-rate measurement were removed from the graph, it would change the time course of mutation rate considerably, beyond what we would expect given the confidence intervals. This suggests that we have not sampled mutation rates to saturation and if we had a higher density of mutation-rate measurements, we would see a difference in the time course of mutation rate.
If the mutation rate were constant, mutational degradation would be captured by the generations variable. Thus if our measured estimate of the time course of the mutation rate did no better than assuming constant mutation rate, then the cumulative-mutation variable would do no better than the generations variable. Hence, with our inadequately estimated cumulative-mutation variable, we expect the effect of this variable to be partly confounded with the generations of evolution variable, whose explanatory power may therefore be inflated by our analysis. This illustrates the difficulty in separating the effects of MD and positive selection.
Simulating sporulation loss:
As discussed above, our measure of cumulative mutation was insufficient to detect the effects of MD in the multiple-regression analysis. This casts doubt over the results of the regression analysis, since the role of positive selection may be inflated. To avoid this inflation, we simulated the change in frequency of sporulation throughout evolutionary time for each population where the selection coefficient (s) associated with mutations that decrease sporulation ability was equal either to zero or a best-fit s (see materials and methods). This method, by exploiting the directly and independently measured functional mutation rate, avoids fitting a parameter for mutational degradation. Hence, unlike the regression approach, this method avoids confounding mutational degradation with positive selection.
Goodness-of-fit scores, G measuring the fit of the simulation to observed data, were calculated both for s = 0 and s = best fit. Substantial reductions in G for s = best fit compared to s = 0 were seen for populations 624A, 624B, and 624E, suggesting that in these populations, population dynamics could best be explained by invoking selection. The results of these simulations are shown in Figure 3 where the top, middle, and bottom rows represent the simulated loss of sporulation under s = 0, s = best fit, and a straight-line fit, respectively. Each population is discussed below in turn.
624A:
Sporulation ability was not completely lost during evolution in 624A but was reduced several orders of magnitude by the end of the experiment (Figure 3). The G measures showed that s = −0.005 was a modestly better fit to the data than s = 0 (middle and top, Figure 3, respectively). Because the straight line appears to fit just as well as the simulated fit with selection, it seems likely either that interpolation of mutation rates has not captured all features of mutation-rate evolution, or that selection strength changed over the course of the experiment. Inability to distinguish between these two hypotheses means we cannot draw firm conclusions. We can, however, say that mutation rates are high enough to account for most of the decline (Figure 3, top), and hence the results are compatible with only a limited role for selection.
624B:
By the end of the 6000-generation experiment, sporulation ability was completely lost in the 624B population. The simulation results show that the observed pattern of sporulation loss is better fit by s = 0.004 (Figure 3) than by s = 0, but the improvement is slight. Comparing the residuals in the middle row to those in the bottom row, it is clear that the s = 0.004 fit is not much better than the straight-line fit. Therefore, as with 624A, it seems likely either that interpolation of mutation rates has not captured all features of mutation-rate evolution or that selection strength changed over the course of the experiment. Inability to distinguish between these two hypotheses means we cannot draw firm conclusions. Again, mutation rates are high enough to account for most of the decline (Figure 3, top), and hence the results are compatible with only a limited role for selection.
624C:
Sporulation ability was reduced only by an order of magnitude in this population. This appears to be due to a mutation rate that is lower than that in the other populations, as can be seen in Figure 3, top. Selection does not significantly improve the fit (Figure 3, middle vs. top) and hence the results are compatible with no role for selection.
624D:
By generation 5800, sporulation ability was lost in 624D. The simulation results show that the observed decline in sporulation is best fit by s = −0.00167 although, as in 624C, the difference between the goodness-of-fit values for the best-fit s, the s = 0 curve, and the straight line is not significant (Figure 3) and therefore there is no evidence supporting a role for selection.
624E:
The fastest observed loss in the five populations was in 624E, where by generation 4200 the ability to sporulate was lost. The simulation results show that s = 0.0116 is the best fit to the data (Figure 3). Therefore a combination of selection and mutation (middle) fit the data better than mutation alone (top) and a straight line (bottom). For this population, both mutational degradation and positive selection are required to explain sporulation frequencies over time.
The top row of Figure 3, representing the observed and simulated (s = 0) data, shows that MD alone is a decent fit for all five populations. This suggests that MD is in fact occurring in the populations but that detecting its effects as significant in the statistical analysis and the simulations is difficult. This is most likely due to insufficient sampling of time points when measuring the population mutation rates and/or selection coefficients associated with mutations that result in decreased sporulation ability that change over time. While distinguishing between these two possibilities will require further experimental work, it is clear the MD played an important role in trait loss in all five populations and that selection need only be invoked to explain the loss of sporulation in population 624E.
Fitness of Spo+ vs. Spo− strains:
One of the advantages of this experimental-evolution approach is that we were able to test the fitness of sporulation-mutant (Spo−) phenotypes directly. To determine experimentally if an increase or a decrease in fitness was associated with Spo− mutations, we isolated three strains that had lost the ability to sporulate at appreciable levels (Spo−) and competed them against three strains able to sporulate at wild-type levels (Spo+) also isolated from the same population at the same evolutionary time point. These mutants were isolated early in the experiment (at generation ∼1000) so that the number of mutations contributing to the sporulation-defective phenotype would be minimized. While two of the Spo− mutants have average fitnesses lower than the Spo+ isolate, one of the Spo− mutants has an average fitness higher than the Spo+ isolate (Table 3). Although the sample size is small and the fitness differences may be due to genetic differences not associated with loss of sporulation, the results are compatible with distribution-of-fitness effects associated with the Spo− phenotype, a result that is expected given the pleiotropy of sporulation genes. Our inability to detect an overall effect of selection on the time course of trait loss may reflect a balance between positive and negative selection acting on different subsets of mutations, rather than the complete absence of selection.
TABLE 3.
Fitness of Spo−vs. Spo+ isolates from generation 1000
| Fitness measurement 1 | Fitness measurement 2 | Average fitness (variance) | Ratio of Spo−/Spo+ sporulation frequencies | |
|---|---|---|---|---|
| Spo− (624A) | 1.0 | 0.82 | 0.91 (0.01) | 0.00017 |
| Spo−(624B) | 0.93 | 0.99 | 0.96 (0.001) | 0.02 |
| Spo− (624E) | 1.21 | 0.99 | 1.1 (0.02) | 0 |
Equal fitness gives a value of 1.
DISCUSSION
The loss of sporulation:
Despite evidence suggesting that 21% of sporulation genes are likely pleiotropic, we found that the neutral accumulation of mutations alone was sufficient to explain the degradation of sporulation in four of five populations. Our data suggest that in two populations, 624A and 624B, there is support for MD and for selection that is weak at best. This weak selection may not have been enough to drive the loss of sporulation. In only one population, 624E, did we find significant support for positive selection in the loss of sporulation. Therefore, in one of five populations, a mutation (or mutations) that had a negative effect on sporulation was selected for its (their) beneficial effect on another trait(s).
We observed substantial fluctuations in mutation rate by measuring every 1000 generations and were able to capture these fluctuations in our simulations and regression analysis, but it seems likely that we missed many more fluctuations by not sampling at greater density. Similarly, the selection coefficient associated with the loss of sporulation may have fluctuated over the course of the experimental evolution. The two possible sources of unknown fluctuations make it difficult to distinguish the cause of trait loss using the multiple regressions and constrain our ability to simulate the accurate time course of the loss of sporulation. These fluctuations in mutation rate and/or selection coefficient during phenotypic loss are themselves biologically interesting and should serve as a point of future investigation.
It is currently unclear which phenotype potentially benefited from sporulation loss in 624E through the release of constraint imposed by pleiotropy. It has been reported that in chemostats, an environment in which growth is selected, sporulation mutants of B. subtilis often take over the population (Dawes and Thornley 1970). There is also evidence from metabolic-flux analyses that the flux of metabolites in B. subtilis is suboptimal and that flux improves when certain sporulation genes are deleted (Fischer and Sauer 2005). Both of these observations suggest that growth rate may trade off with sporulation ability. In a previous report, it was shown that the NS populations evolved a growth rate that was significantly faster than the ancestor (Maughan et al. 2006), which could potentially be due to increased metabolic-flux performance associated with the loss of sporulation. This is supported by the observation that in a parallel set of experimental populations, where selection for sporulation was strong, the growth rate did not improve compared to the ancestor (Maughan et al. 2006). Although all five populations that were subjected to relaxed selection for sporulation showed an increased growth rate (Maughan et al. 2006), there was evidence for selection only in 624E, suggesting that the trade-off between growth rate and sporulation did not result in sporulation loss in all five populations. Therefore, it is possible that the loss of sporulation in 624E was a trade-off for the improvement of phenotypes important for aspects of fitness other than growth, such as stationary-phase survival. Additional phenotypic characterization of all five populations is required to address these possibilities explicitly.
While this discussion has focused on the genetic costs associated with sporulation ability, there could certainly be significant physiological costs. Sporulation is a costly process in terms of gene transcription and translation during a period when the cell is already combating energy stress. However, we do not think that physiological costs contributed to the loss of sporulation in 624E for several reasons. In the NS populations, sporulation was repressed by the addition of glucose to the culture medium. Glucose is a potent inhibitor of the sporulation response (Grossman 1995) and because of this the NS populations were not likely to even initiate spore development and therefore were excused from expending the energy associated with spore formation. This is supported by microarray expression profiling in 624E, where sporulation genes are not even transcribed during the onset of the stationary phase in sporulation-inducing medium, a time when sporulation genes in the ancestor are being turned on (H. Maughan, C. W. Birky, Jr. and W. L. Nicholson, unpublished results). In addition it has previously been shown that the costs associated with tryptophan biosynthesis in E. coli were not enough to account for the advantage associated with its loss, suggesting that physiological costs may not be an important driving force for phenotypic loss in bacteria (Dykhuizen 1978). Nevertheless, future experiments addressing the potential physiological benefits to losing sporulation would need to be performed to conclude that physiology did not figure into the benefit associated with the loss of sporulation.
Sporulation loss in nature:
The work presented here addressed the population genetic cause of sporulation loss in experimental populations that were evolved in the laboratory environment. It would be of great interest to know how often genes in the sporulation pathway must be used in nature to escape degradation. Theoretical work on the Moran model examining the loss of plastic traits such as sporulation, and the environmental-change rates that must occur to prevent their loss, has shown that for population sizes typical for microbes, the expected time τ before phenotypic loss from a single population is approximately inversely proportional to the functional mutation rate or the selection coefficient associated with loss-of-function mutations, whichever is larger (Masel et al. 2007). We can also use τ to calculate the minimum frequency θ at which environmental conditions must change so that the plastic trait (sporulation) is occasionally essential and retained in the population for an arbitrarily long period of time. θ can be estimated using both a single- population and a metapopulation model (Masel et al. 2007). The single-population model assumes that when the phenotype is lost in the population, it is lost forever. However in the metapopulation model, single demes that lose the phenotype can be replaced by migrants that have not lost the phenotype. This results in less frequent environmental-change events being sufficient for retention in a metapopulation (Masel et al. 2007). The metapopulation model may be more realistic for B. subtilis in nature, but data concerning migration rates do not exist so we calculate θ using both models for comparison. A conservative yet sufficient approximation of θ is given by 18/τ for a single population and 1.3/τ for a metapopulation (Masel et al. 2007).
Masel et al. (2007) calculated τ as a function of the effective population size (Ne), the functional mutation rate (m), and the selection coefficient associated with loss of function mutations (s). It has previously been shown that loss-of-sporulation mutations occur at m = 0.0003 in nonmutator strains (Masel and Maughan, 2007). Because the effective population size of B. subtilis is unknown, we assume the true Ne is within the range of 105–1010 [τ is linearly dependent on merely the logarithm of Ne, so the range of this assumption will not affect the results too much, as seen below (Masel et al. 2007)]. We can also use the best-fit selection coefficient from population 624E (s = 0.01) to determine the influence that selection has on τ and θ.
When sporulation loss is due only to MD, τ is between 13,661 and 51,642 generations, depending on Ne. For the combined effects of selection and MD, τ ranges from 1082 and 2220 generations, again depending on Ne. Values of τ above were calculated according to Equations A1 and A2 in Masel et al. (2007). In a single population model, sporulation will be maintained for an arbitrarily long time (108 generations; see Masel et al. 2007) if the environment changes at least every 1206–5239 generations and 77–167 generations under MD alone and MD plus selection, respectively [calculated from Equation 2 in Masel et al. (2007)]. In a metapopulation model, sporulation will be maintained if the environment changes every 10,508–39,724 generations and 832–1708 generations under MD alone and MD plus selection, respectively (calculated using the approximation 1.3/τ).
Therefore, in nature MD alone and MD plus selection will result in sporulation loss unless the environment selects for sporulation every 1200–40,000 generations and 70–2000 generations, respectively. This result predicts that some populations of B. subtilis in nature should be unable to sporulate. Unfortunately data on this are lacking as sporulation ability is usually a defining characteristic of Bacillus species and surveys of 16S rDNA do not test for sporulation ability. While information concerning B. subtilis does not exist, the sporadic distribution of sporulation ability in the Firmicute bacteria, of which B. subtilis is a member, does suggest that sporulation has been lost independently in several species (Onyenwoke et al. 2004).
In the experimental populations described here, Ne is estimated as 107 (Maughan et al. 2006). This corresponds to τ equal to 28,622 generations with MD alone and 1535 generations with MD and selection. For those populations where selection was not involved, the experimentally determined sojourn times are 10-fold lower than this due to the presence of mutators in the experimental population. Ne = 107 and s = 0 gives τ = 6000 generations if m = 0.0017 [according to the method of Masel et al. (2007)], a functional mutation rate m that is very close to that which was measured: m = 0.003 (Masel and Maughan 2007). This is compatible with the prevalence of mutators, as the observed sojourn times for sporulation loss correspond closely with the peaks of mutation rate increases (Maughan et al. 2006).
Phenotypic loss:
We conclude that positive selection favored the loss of sporulation in one of five experimental populations evolved for 6000 generations without selection for sporulation, whereas MD was sufficient to explain trait decline in the remaining four populations. These results confirm those from other bacteria in suggesting that phenotypic loss in individual cases can be due to MD, selection, or a combination of these causes.
Our experimental populations have both high genomic mutation rates and relatively high functional mutation rates as a consequence of large mutational target size. With such high functional mutation rates, MD is likely to be the most important contributor to phenotypic loss, as was found in four of five of our populations. This is consistent with results from other microbes, where populations with high mutation rates accumulate mutations resulting in trait degradation (Funchain et al. 2000; Giraud et al. 2001; Nilsson et al. 2004).
In populations with lower mutation rates, the balance between selection and mutation is likely to be different, resulting in phenotypic degradation facilitated by selection. This will be true whether the lower mutation rates are due to genomewide effects or are specific to the trait in question. This is consistent with other results in bacteria where antagonistic pleiotropy underlies selection for trait loss (Cooper and Lenski 2000; Cooper et al. 2001; Zeyl et al. 2005). However, in populations where selection for sporulation was strong and genomic mutation rates were high, it was found that selection was best able to explain the decline in prototrophy (Maughan et al. 2006), suggesting that high mutation rates will not always result in phenotypic loss due to MD. Therefore, the balance between mutation and selection is likely to differ between particular phenotypes. The cost associated with individual phenotypes surely varies, as some phenotypes are likely to develop from genes with more pleiotropic interactions and/or require a higher devotion of an organism's resources. This results in a complex picture of phenotypic loss, a process whose rate and underlying population genetic cause is dependent upon the mutation rate, the nature of the phenotype, and the integration of the phenotype with others in the organism.
Acknowledgments
The authors thank Adam Hancock for technical assistance in bootstrapping point mutation rate estimates and Michael Nachman, Nancy Moran, and Leland S. Pierson for conceptual discussions concerning this work. H.M. was supported by a National Science Foundation Integrated Graduate Education and Research Traineeship Fellowship in Genomics at the University of Arizona and Research Training Grants and funds from the Department of Ecology and Evolutionary Biology at the University of Arizona. J.M. was supported by the BIO5 Institute at the University of Arizona and National Institutes of Health grant GM-076041. J.M. is a Pew Scholar in the Biomedical Sciences and an Alfred P. Sloan Research fellow.
References
- Baatz, M., and G. P. Wagner, 1997. Adaptive inertia caused by hidden pleiotropic effects. Theor. Popul. Biol. 51: 49–66. [Google Scholar]
- Bejder, L., and B. K. Hall, 2002. Limbs in whales and limblessness in other vertebrates: mechanisms of evolutionary and developmental transformation and loss. Evol. Dev. 4: 445–458. [DOI] [PubMed] [Google Scholar]
- Bell, G., 1982. The Masterpiece of Nature: The Evolution and Genetics of Sexuality. University of California Press, Berkeley, CA
- Bentley, S. D., and J. Parkhill, 2004. Comparative genomic structure of prokaryotes. Annu. Rev. Genet. 38: 771–792. [DOI] [PubMed] [Google Scholar]
- Cooper, V. S., and R. E. Lenski, 2000. The population genetics of ecological specialization in evolving Escherichia coli populations. Nature 407: 736–739. [DOI] [PubMed] [Google Scholar]
- Cooper, V. S., A. F. Bennett and R. E. Lenski, 2001. Evolution of thermal dependence of growth rate of Escherichia coli populations during 20,000 generations in a constant environment. Evolution 55: 889–896. [DOI] [PubMed] [Google Scholar]
- Culver, D. C., 1982. Cave Life: Evolution and Ecology. Harvard University Press, Cambridge, MA.
- Darwin, C., 1859. On the Origin of Species. Harvard University Press, Cambridge, MA.
- Dale, C., B. Wang, N. Moran and H. Ochman, 2003. Loss of DNA recombinational repair enzymes and the initial stages of genome degradation. Mol. Biol. Evol. 20: 1188–1194. [DOI] [PubMed] [Google Scholar]
- Dawes, I. W., and J. H. M. Thornley, 1970. Sporulation in Bacillus subtilis. Theoretical and experimental studies in continuous culture systems. J. Gen. Microbiol. 62: 49–66. [DOI] [PubMed] [Google Scholar]
- Dykhuizen, D., 1978. Selection for tryptophan auxotrophs of Escherichia coli in glucose-limited chemostats as a test of the energy conservation hypothesis of evolution. Evolution 32: 125–150. [DOI] [PubMed] [Google Scholar]
- Feil, E. J., 2004. Small change: keeping pace with microevolution. Nat. Rev. Microbiol. 2: 483–495. [DOI] [PubMed] [Google Scholar]
- Fischer, E., and U. Sauer, 2005. Large-scale in vivo flux analysis shows rigidity and suboptimal performance of Bacillus subtilis metabolism. Nat. Genet. 37: 636–640. [DOI] [PubMed] [Google Scholar]
- Fong, D. W., T. C. Kane and D. C. Culver, 1995. Vestigialization and loss of nonfunctional characters. Annu. Rev. Ecol. Syst. 26: 249–268. [Google Scholar]
- Funchain, P., A. Yeung, J. L. Stewart, R. Lin, M. M. Slupska et al., 2000. The consequences of growth of a mutator strain of Escherichia coli as measured by loss of function among multiple gene targets and loss of fitness. Genetics 154: 959–970. [DOI] [PMC free article] [PubMed] [Google Scholar]
- Giraud, A., I. Matic, O. Tenaillon, A. Clara, M. Radman et al., 2001. Costs and benefits of high mutation rates: adaptive evolution of bacteria in the mouse gut. Science 291: 2606–2608. [DOI] [PubMed] [Google Scholar]
- Grossman, A. D., 1995. Genetic networks controlling the initiation of sporulation and the development of genetic competence in Bacillus subtilis. Annu. Rev. Genet. 29: 477–508. [DOI] [PubMed] [Google Scholar]
- Hansen, T. F., 2003. Is modularity necessary for evolvability? Remarks on the relationship between pleiotropy and evolvability. Biosystems 69: 83–94. [DOI] [PubMed] [Google Scholar]
- Hermisson, J., and P. S. Pennings, 2005. Soft sweeps: molecular population genetics of adaptation from standing genetic variation. Genetics 169: 2335–2352. [DOI] [PMC free article] [PubMed] [Google Scholar]
- Judson, O. P., and B. B. Normark, 1996. Ancient asexual scandals. Trends Ecol. Evol. 11: 41–46. [DOI] [PubMed] [Google Scholar]
- Kimura, M., and T. Ohta, 1969. The average number of generations until fixation of a mutant gene in a finite population. Genetics 61: 763–771. [DOI] [PMC free article] [PubMed] [Google Scholar]
- Lande, R., 1978. Evolutionary mechanisms of limb loss in tetrapods. Evolution 32: 73–92. [DOI] [PubMed] [Google Scholar]
- Lawrence, J. G., and H. Hendrickson, 2005. Genome evolution in bacteria: order beneath chaos. Curr. Opin. Microbiol. 8: 572–578. [DOI] [PubMed] [Google Scholar]
- Lenski, R. E., M. R. Rose, S. C. Simpson and S. C. Tadler, 1991. Long-term experimental evolution in Escherichia coli. I. Adaptation and divergence during 2,000 generations. Am. Nat. 138: 1315–1341. [Google Scholar]
- Masel, J., O. D. King and H. Maughan, 2007. The loss of adaptive plasticity during long periods of environmental stasis. Am. Nat. 169: 38–46. [DOI] [PMC free article] [PubMed] [Google Scholar]
- Masel, J., and H. Maughan, 2007. Mutations leading to loss of sporulation ability in Bacillus subtilis are sufficiently frequent to favor genetic canalization. Genetics 175: 453–457. [DOI] [PMC free article] [PubMed] [Google Scholar]
- Maughan, H., V. Callicotte, A. Hancock, C. W. Birky, Jr., W. L. Nicholson et al., 2006. The population genetics of phenotypic deterioration in experimental populations of Bacillus subtilis. Evolution 60: 686–695. [PubMed] [Google Scholar]
- Maughan, H., and W. L. Nicholson, 2004. Stochastic processes influence stationary-phase decisions in Bacillus subtilis. J. Bacteriol. 186: 2212–2214. [DOI] [PMC free article] [PubMed] [Google Scholar]
- Mira, A., H. Ochman and N. A. Moran, 2001. Deletional bias and the evolution of bacterial genomes. Trends Genet. 17: 589–596. [DOI] [PubMed] [Google Scholar]
- Moran, N. A., 1996. Accelerated evolution and Muller's ratchet in endosymbiotic bacteria. Proc. Natl. Acad. Sci. USA 93: 2873–2878. [DOI] [PMC free article] [PubMed] [Google Scholar]
- Moran, N. A., and A. Mira, 2001. The process of genome shrinkage in the obligate symbiont Buchnera aphidicola. Genome Biol. 2(12): research0054.1–0054.12. [DOI] [PMC free article] [PubMed]
- Nilsson, A. I., E. Kugelberg, O. G. Berg and D. I. Andersson, 2004. Experimental adaptation of Salmonella typhimurium to mice. Genetics 168: 1119–1130. [DOI] [PMC free article] [PubMed] [Google Scholar]
- Onyenwoke, R. U., J. A. Brill, K. Farahi and J. Wiegel, 2004. Sporulation genes in members of the low G+C Gram-type-positive phylogenetic branch (Firmicutes). Arch. Microbiol. 182: 182–192. [DOI] [PubMed] [Google Scholar]
- Piggot, P. J., and R. Losick, 2002. Sporulation genes and intercompartmental regulation, pp. 483–517 in Bacillus subtilis and Its Closest Relatives: From Genes to Cells, edited by A. L. Sonenshien, J. A. Hoch and R. Losick. ASM, Washington, DC.
- Piggot, P. J., and J. G. Coote, 1976. Genetic aspects of bacterial endospore formation. Bacteriol. Rev. 40: 908–962. [DOI] [PMC free article] [PubMed] [Google Scholar]
- Press, W. H., B. P. Flannery, S. A. Teukolsky and W. T. Vetterling, 1992. Numerical Recipes in C: The Art of Scientific Computing. Cambridge University Press, London.
- R Development Core Team, 2004. R: a language and environment for statistical computing. R Foundation for Statistical Computing, Vienna. (http://www.R-project.org).
- Richards, A. J., 1986. Plant Breeding Systems. Allen & Unwin, London.
- Roff, D. A., 1990. The evolution of flightlessness in insects. Ecol. Monogr. 60: 389–421. [Google Scholar]
- Roff, D. A., 1994. The evolution of flightlessness: Is history important? Evol. Ecol. 8: 639–657. [Google Scholar]
- Schaeffer, P., J. Millet and J.-P. Aubert, 1965. Catabolic repression of bacterial sporulation. Proc. Natl. Acad. Sci. USA 54: 704–711. [DOI] [PMC free article] [PubMed] [Google Scholar]
- Sokal, R. R., and F. J. Rohlf, 1995. Biometry. W. H. Freeman, New York.
- Sonenshein, A. L., J. A. Hoch and R. Losick, 2002. Bacillus subtilis and its Closest Relatives: From Genes to Cells. ASM, Washington, DC.
- Travisano, M., and R. E. Lenski, 1996. Long-term experimental evolution in Escherichia coli. IV. Targets of selection and the specificity of adaptation. Genetics 143: 15–26. [DOI] [PMC free article] [PubMed] [Google Scholar]
- Wernegreen, J. J., and N. A. Moran, 1999. Evidence for genetic drift in endosymbionts (Buchnera): analyses of protein-coding genes. Mol. Biol. Evol. 16: 83–97. [DOI] [PubMed] [Google Scholar]
- Wiens, J. J., 2001. Widespread loss of sexually selected traits: how the peacock lost its spots. Trends Ecol. Evol. 16: 517–523. [Google Scholar]
- Wright, S., 1929. Fisher's theory of dominance. Am. Nat. 63: 274–279. [Google Scholar]
- Wright, S., 1964. Pleiotropy in the evolution of structural reduction and of dominance. Am. Nat. 98: 65–70. [Google Scholar]
- Zeyl, C., C. Curtin, K. Karnap and E. Beauchamp, 2005. Antagonism between sexual and natural selection in experimental populations of Saccharomyces cerevisiae. Evolution 59: 2109–2115. [PubMed] [Google Scholar]