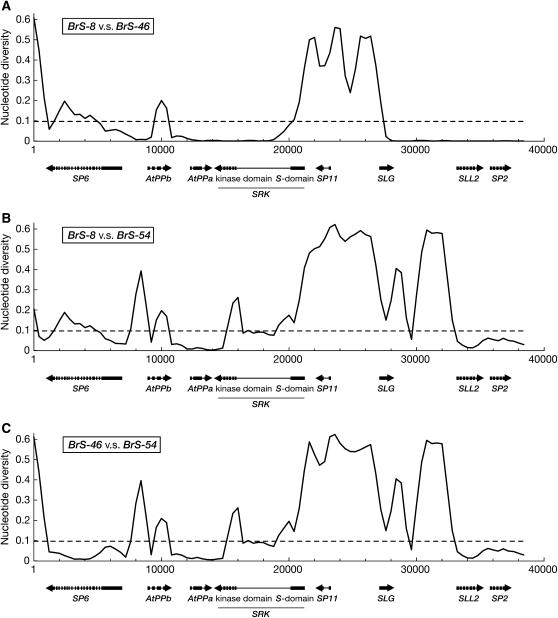
Figure 2.—
Sliding-window analysis among the three B. rapa S haplotypes with a window size of 1000 bp and a sliding width of 400 bp. The x-axes and y-axes represent the position in the S-locus complex and nucleotide diversity per site, respectively. The arrows indicate the genes and connecting thin lines within arrows indicate introns. The results of BrS-8 vs. BrS-46 (A), BrS-8 vs. BrS-54 (B), BrS-46 vs. BrS-54 (C) are shown.

