Abstract
The A-myb gene is a transcription factor that shares structural and functional similarities with the v-myb oncogene. To date, v-myb is the only myb gene directly implicated in tumorigenesis, a property attributed to its transactivating ability. Recent studies have demonstrated that A-myb, like v-myb, is a potent transcriptional activator, raising the possibility that A-myb may also participate in oncogenesis. To test this hypothesis, we generated fusion constructs that contained the human A-myb cDNA under control of the mouse metallothionein promoter and the mouse mammary tumor virus long terminal repeat. These constructs were inserted into the germ line of mice, and the functional consequences of ectopic A-myb expression were examined. Although transgene expression was detected in a wide range of tissues, abnormalities were confined primarily to hematopoietic tissues. After a 9-month latency, A-myb transgenic mice developed hyperplasia of the spleen and lymph nodes. Enlarged tissues contained a polyclonally expanded B lymphocyte population that expressed a germinal center-cell phenotype. Transgenic B lymphocytes showed increased DNA synthesis in response to low dose mitogen stimulation, suggesting that A-myb may contribute to hyperplasia by increasing the rate of B cell proliferation.
The A-myb gene is a member of the myb family, which also includes B-myb, c-myb, and v-myb (1). All myb genes are functionally classified as transcription factors, as they bind to the specific consensus sequence, PyAACG/TG, located in the promoter of target genes (2–6). The best-characterized members of this gene family are the v-myb oncogene and its cellular homolog, c-myb. v-myb is a component of two acutely oncogenic retroviruses, avian myeloblastosis virus and E26, and is capable of transforming avian hematopoietic cells in vitro and in vivo (7–9). Transcriptional activation of v-myb is requisite for oncogenicity (10, 11). The full-length c-myb protooncogene transactivates less efficiently than v-myb and is not able to induce transformation; however, it has been implicated in the control of hematopoietic cell proliferation and differentiation. Sustained c-myb expression interferes with terminal differentiation of myeloid and erythroid lineages (12–14), whereas down-regulation of c-myb expression correlates with inhibition of colony formation by bone marrow progenitors and prevents cell cycle progression of mitogen-stimulated T lymphocytes (15, 16).
A novel member of the myb family, A-myb, has recently been cloned and found to share a high degree of structural homology with c-myb, particularly in the DNA binding domain (1). A-myb binds to and transactivates c-myb responsive genes and constructs containing multiple myb binding sites, and it does so 6- to 10-fold more effectively than c-myb, paralleling the activity reported for v-myb (4–6, 17). Expression of A-myb is restricted to subsets of reproductive and hematopoietic tissues in adult mice and humans and appears to correlate with distinct differentiation stages in both systems. In the testis, A-myb expression is restricted to immature, mitotic spermatogonia and primary spermatocytes, whereas in hematopoietic tissues, A-myb is primarily expressed in the buoyant B lymphoid subset that expresses the germinal center phenotype: CD38+, CD39−, and IgM− (17–20). A-myb expression has also been detected in certain primary B cell leukemias and transformed B cell lines and may correlate with certain neoplasias derived from germinal center B cells (20, 21).
The detection of A-myb in transformed hematopoietic tissues together with its potent transactivation activity suggests a possible role for this gene in tumorigenesis. To assess transformation potential, A-myb was introduced transgenically into the germ line of mice. Ectopic expression of A-myb resulted in a polyclonal B lymphoid expansion in over half of the mice autopsied after 9 months. Abnormal B cell populations were confined predominately to the spleen and lymph nodes and were manifested in histologic sections as markedly expanded follicles. Phenotypic analysis demonstrated that the expanded B cell population was relatively mature and expressed markers associated with germinal center cells. This increase in B lymphocytes might result, in part, from enhanced proliferation. These studies suggest that the inability to properly regulate A-myb expression results in growth abnormalities within the germinal center B cell subset.
MATERIALS AND METHODS
Production of Transgenic Mice.
Plasmids containing A-myb cDNA downstream of the mouse metallothionein promoter (MT-1) or mouse mammary tumor virus (MMTV) LTR were digested with restriction enzymes to generate linear DNA fragments containing promoter sequences, A-myb coding and 3′ untranslated regions, and simian virus 40 polyadenylylation signals. Pgem–MT–A-myb was digested with EcoRI/BamHI, and pMAM–A-myb was digested with PvuI/BamHI, releasing 5.0- and 5.5-kb fragments, respectively. Digested fragments were purified by standard methods, injected into C57BL/6 × C3H/HeJ F1 blastocysts, and surgically implanted in the oviduct of pseudopregnant FVB/N female mice. Founder animals were screened by Southern blot analysis using a 1.0-kb probe specific for A-myb 3′ sequences, base pairs 1246–2341 (6). Transgene-positive founders were bred with wild-type C57BL/6 mice to establish independent lines.
Screening Transgenic Lines.
Progeny from independent transgenic lines were screened for the presence of the A-myb fusion gene using a PCR strategy. p32MT4 [5′-CAACGACTATAAAGAGGGCAGGCT, MT promoter − (nucleotides 36–12)] and A-myb4 [5′-ATCGGCATACTGAAGGTCATCATC, A-myb + (nucleotides 138–162)] amplified a 266-bp fragment from MT–A-myb-positive progeny. pMAM4 [5′-GCTCGTCACTTATCCTTCACTTTC, MMTV promoter +(nucleotides 1334–1358)] and A-myb4 amplified a 382-bp fragment in transgene-positive MMTV lines. For DNA isolation, tail and organ biopsies were digested overnight at 56°C in extraction buffer (50 mM Tris·HCl, pH 8.0/100 mM EDTA/100 mM NaCl/1% SDS/500 μg/ml proteinase K). DNA was extracted with phenol/chloroform, ethanol-precipitated, and resuspended in 10 mM Tris (pH 7.3)/0.1 mM EDTA. For Southern blotting, 10 μg of DNA was digested with EcoRI and electrophoresed through agarose gels using standard techniques (22). A 1.0-kb IgH enhancer probe was used to screen for Ig gene rearrangements (23).
RNA Analysis.
Total RNA was prepared from tissues as described (24). For Northern blot analysis, 20 μg of total RNA was electrophoresed through 1% agarose gels containing 12% formaldehyde and transferred to nitrocellulose. Hybridization was performed under high stringency conditions (0.1× SSC/0.1% SDS at 65°C) using a random primed probe specific for A-myb (nucleotides 1246–2341). Mouse β-actin cDNA was used as a probe to verify RNA quantity and integrity.
Immunofluorescence Analysis.
Dissociated cell suspensions were prepared from freshly isolated tissues by pressing minced tissues between two pieces of frosted glass. Connective tissue debris was removed by filtration through 45-μm nylon mesh. Erythrocytes were removed by hypotonic lysis (155 mM NH4Cl/10 mM KHCO3/0.1 mM EDTA, pH 7.3). Conjugated monoclonal antibodies used for immunofluorescence studies have been described elsewhere and include anti-B220 (clone RA3–6B2), anti-K (clone R8–140), anti-λ (R26–46), anti-CD4 (clone H129.19), anti-CD8 (clone 53–6.7), and anti-CD38 (clone 90). Polyclonal Ig (clone JCD-12) recognized Ig of all isotypes. All antibodies where purchased from PharMingen. Fluorescence was analyzed using FACScan (Becton Dickinson). Dead cells were excluded using the scatter gating method, and data on 104 viable cells were collected.
Cell Proliferation Assay.
Purified B cells were obtained by positive selection panning using anti-B220. B cells were cultured in triplicate at a concentration of 105 cells per well in 96-well microtiter plates. Lipopolysaccharide (5 μg/ml) was added as indicated. On day 3, 1 μCi of [3H]thymidine (1 Ci = 37 GBq) was added to each well, and cells were harvested 16 h later and assessed for radioisotope incorporation.
RESULTS
A-myb Transgenic Mice.
To assess the effect of deregulated A-myb expression in vivo, two transgene constructs were generated. Constructs contained the complete 2363-bp human A-myb coding region and 830 bp of 3′ untranslated sequence ligated downstream of either the mouse metallothionein promoter/enhancer (MT-1) or the MMTV LTR. MT-1 promoter sequences were derived from the plasmid BPV (Pharmacia), which contains 370 bp of 5′ flanking region from the mouse metallothionein 1 gene. The MMTV regulatory sequences were derived from the plasmid pMAM-neo (CLONTECH) and contain the entire MMTV LTR. Before microinjection, the in vitro expression of MT–A-myb and MMTV–A-myb recombinant plasmids was confirmed by transfection into Tk-ts13 hamster fibroblasts (data not shown). Linearized constructs were injected into FVB/N embryos, and 11 founders were obtained, all of which showed germ-line transmission of the transgene in accordance with Mendelian inheritance.
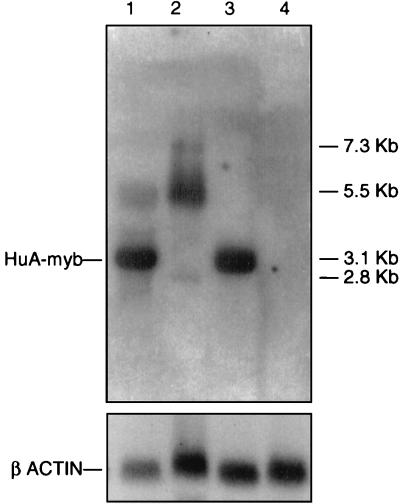
Tissue-specific expression of the transgene was examined in multiple organs from all established lines. Four of the 11 lines expressed the A-myb transgene at levels detectable by Northern blot analysis. Using an A-myb-specific probe, it was possible to clearly discriminate between the 3.1-kb transgene mRNA and the endogenous 5.5-kb primary transcript. Transgene expression could also be distinguished from the endogenous 2.8-kb testes-specific A-myb message, both by size and intensity of hybridization (Fig. 1). Specificity of transgene expression in tissues varied in accordance with the 5′ regulatory region. Transgenic lines carrying the MT–A-myb fusion construct had high levels of transgene expression in the testes, preputial gland, kidney, and liver, whereas MMTV–A-myb lines showed highest expression in the thymus, mammary gland, and liver. Both constructs directed transgene expression to hematopoietic tissues, i.e., spleen, lymph nodes, and thymus, with selective expression found in a variety of nonhematopoietic organs.
Figure 1.
Northern blot analysis of transgene expression. Autoradiogram of mRNA generated by hybridizing a 32P-labeled A-myb cDNA probe to 20 μg of total RNA derived from transgenic and control tissues. Endogenous A-myb transcripts of 7.3, 5.5, and 2.8 kb are detected in both transgenic and control testes (lanes 1 and 2, respectively) but not in transgenic and control kidney (lanes 3 and 4, respectively). A 3.1-kb transgene message is clearly visible in transgenic testes and kidney only (lanes 1 and 3).
Lymphoid Hyperplasia in A-myb Transgenic Mice.
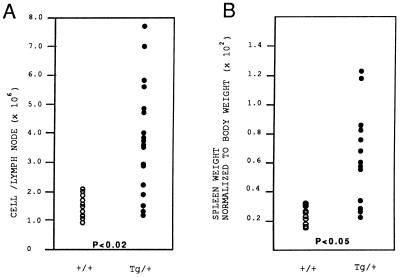
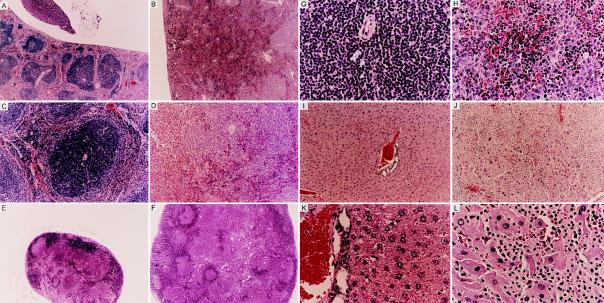
On gross examination, splenomegaly and lymphadenopathy were observed in both MT–A-myb and MMTV–A-myb transgenic mice killed after 9 months of age. Onset and severity of hyperplasia did not vary significantly between the constructs, so animals from all four established lines were used for analysis. Overall, 57% (n = 47) of A-myb transgenic mice over the age of 9 months exhibited lymphoid hyperplasia as determined by lymph node cellularity and the spleen-to-body weight ratio. Lymph node biopsies from 9- to 15-month-old transgenic mice exhibited increased cellularity demonstrated by a 2.8-fold increase in lymphocyte number (Fig. 2A; P < 0.02, Student’s t test, n = 11 wild-type mice, n = 18 A-myb transgenic mice). On average, the absolute number of lymphocytes per node increased from 1.4 × 10⁶ ± 0.3 (mean ± SD) in control mice to 3.9 × 10⁶ ± 1.9 in A-myb transgenic mice. Similarly, transgenic spleens were enlarged compared with wild-type littermates as determined by increased organ weight. On average, transgenic spleens were 2.5-fold heavier than control spleens (Fig. 2B; P < 0.05, Student’s t test, n = 13 wild-type mice, n = 13 A-myb transgenic mice) and were consistently larger upon gross examination. Light microscopy of enlarged spleen and lymph nodes from transgenic mice revealed extensive hyperplasia and disorganization of white pulp regions. In the spleen, follicles were drastically expanded and frequently coalesced, forming disproportionately large regions of white pulp (Fig. 3 A and B). Marginal zones lost demarcation as infiltrating lymphocytes encroached follicle boundaries and invaded red pulp areas. In some instances, loss of architecture was so complete that remnants of germinal center structures could only be identified by the presence of a central vein (Fig. 3 C and D). Transgenic lymph node biopsies depict a similar pattern of cellular expansion with concomitant loss of normal morphology. Both the number and the size of subcapsular follicles were increased, accompanied by the appearance of intact and partial follicle structures amid medullary cords (Fig. 3 E and F). In both spleen and lymph nodes, expanded follicular centers contained a predominant lymphoblastic population. These cells appeared larger than adjacent lymphocytes, had abundant cytoplasm, and contained large round nuclei with prominent nucleoli (Fig. 3 G and H). At higher magnification, numerous mitotic figures were evident in most fields.
Figure 2.
Lymph nodes and spleen from A-myb transgenic mice are enlarged compared with wild-type littermates. (A) Lymph nodes from A-myb transgenic mice are hypercellular. Biopsied lymph nodes were counted to determine the total number of lymphocytes per lymph node. Data were collected from 11 control and 18 transgenic mice between 9 and 15 months of age. The increase in cellularity observed in A-myb transgenic lymph nodes is statistically significant (P < 0.02, Student’s t test). (B) Transgenic spleens are heavier than control spleens. The weight of transgenic and control spleens are expressed as a percentage of total body mass. Transgenic spleens were 2.5-fold heavier than wild-type spleens, representing a mean increase of 250%. Data were collected from 13 transgenic and 13 wild-type littermates between the ages of 9 and 15 months. The increase in splenic mass is statistically significant (P < 0.05, Student’s t test).
Figure 3.
Hematoxylin/eosin staining of normal and transgenic tissue sections. (A–D) Formalin-fixed sections of spleen from a 9-month-old wild-type mouse and transgenic sibling. Control spleen (A) shows normal morphology characterized by clearly defined follicle structures interspersed between red pulp areas; the transgenic spleen (B) lacks discernible follicular organization. (A and B, ×40.) (C and D) Interfollicular region is depicted at higher magnification (×100). Control follicle (C) has a uniform lymphoid population encircling a centrally located periarterial lymphatic sheath. Transgenic follicle (D) exhibits a severe lack of organization. Marginal zone boundaries have been disrupted, and substantial lymphoid invasion into red pulp regions is evident. (E and F) Lymph node biopsies from an 11-month-old control and transgenic littermate. The control lymph node (E) contains few, small subcapsular follicles, whereas the transgenic lymph node (F) harbors numerous subcapsular and medullary follicles and appears grossly enlarged. (E and F, ×40.) (G and H) Wild-type and transgenic interfollicular lymphocyte populations are divergent. Transgenic follicles (H) contain a mixed cell population without apparent compartmentalization. Both large and small lymphocytes are randomly dispersed amid pockets of red pulp. Follicles from wild-type mice (G) possess a uniform population of small, intensely basophilic lymphocytes. (G and H, ×400.) (I–L) Hepatic lobule from a 15-month-old control and transgenic littermate. Liver lobule from control mouse (I) contains layers of hepatocytes surrounding a prominent central vein. Transgenic liver lobule (J) contains a substantial lymphocyte infiltrate, resulting in the displacement of resident hepatocytes. (I and J, ×40.) Surviving hepatocytes in the transgenic liver (L) appear swollen and degenerative compared with control hepatocytes (K). (K and L, ×100.)
Nonhematopoietic tissues from A-myb transgenic mice frequently harbored abnormal lymphocyte populations and showed evidence of hyperplasia. Tissues most commonly affected included the liver and kidney, although infiltrates have been detected in the heart, lungs, pancreas, and intestine. In the liver, numerous small foci were randomly dispersed throughout normal hepatic tissues. In some transgenic mice, especially those more than 15 months old, substantial lymphoid invasion was evident. In these older animals, loss of hepatic architecture and extensive tissue replacement accompanied lymphocyte expansion (Fig. 3 I–L). A similar pattern of lymphocyte infiltration and expansion was observed in other tissue biopsies.
Expanded Polyclonal B Cell Population in A-myb Transgenic Mice.
Splenomegaly and lymphadenopathy were observed in more than half of the A-myb transgenic mice examined after 9 months. To determine the phenotype of the expanded compartment, flow cytometry was performed on cell suspensions obtained from spleen and lymph nodes of control and transgenic littermates. A representative contour plot from a 10-month-old transgenic, MT-251, is compared with a normal littermate control, MT-250 (see Fig. 5). In the spleen, the percentage cells staining positive for B cell markers Ig and B220 increased from 52% in the control to 75% in the transgenic, indicating that the expanded population is B lymphoid (Fig. 4A). A similar pattern was observed in the lymph node, where the B cell number increased from 29% in the control to 63% in the transgenic (Fig. 4B). This expanded B cell population appeared to be relatively mature, as indicated by expression levels of CD38 (53% vs. 19%) and κ light chain (37% vs. 18%; Fig. 4 C and D). The percentage of T cells was proportionately reduced in transgenic lymph nodes, as demonstrated by a loss of CD4 (11% vs. 31%) and CD8 (9% vs. 21%; Fig. 4E). Immunohistochemistry performed on transgenic spleens also indicated an expanded B cell compartment. Hyperplastic white pulp zones stained positive for the B cell-specific marker, B220. In addition, B220 expression was detected in the red pulp and T-dependent zones, corresponding to the abnormal lymphocyte infiltrate found in these areas (data not shown).
Figure 5.
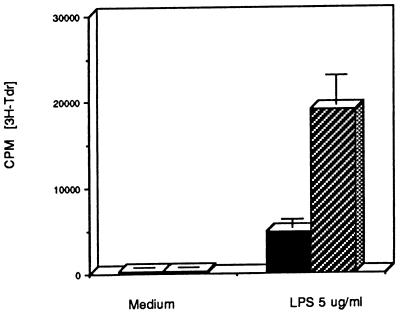
Primary B lymphocytes from A-myb transgenic mice exhibit enhanced thymidine incorporation upon mitogen stimulation. [3H]Thymidine counts from triplicate wells containing 105 freshly isolated splenic B lymphocytes from wild-type (solid bar) and A-myb transgenic mice (hatched bar). Cells were grown in medium alone or medium plus lipopolysaccharide (5 μg/ml). Data presented are the average of four experiments ± SD (n = 8 wild-type mice; n = 8 A-myb transgenic mice).
Figure 4.
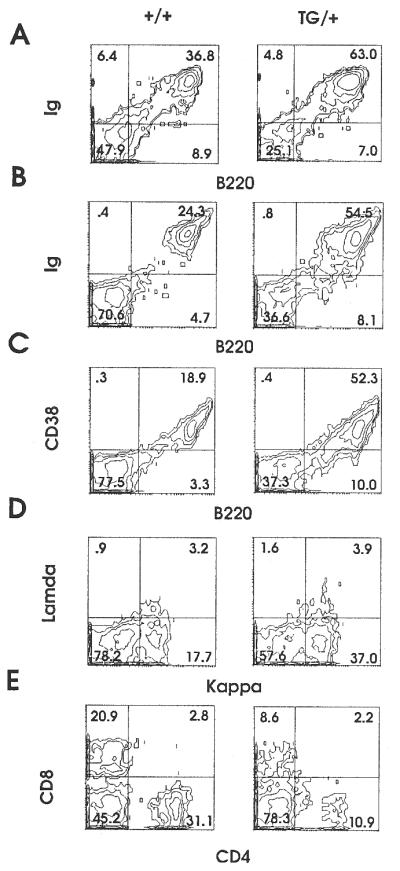
Representative two-color flow cytometric analysis of lymphocytes from wild-type and A-myb transgenic spleen and lymph nodes. Lymphocytes were recovered from the spleen and lymph nodes of 10-month-old control and transgenic littermates, MT-250 and MT-251, respectively. Lymphocytes isolated from spleen were stained with anti-IgFITC/anti-B220PE (A). Lymphocytes isolated from lymph nodes were analyzed with the following monoclonal antibodies: anti-IgFITC/anti-B220PE (B); anti-CD38FITC/anti-B220PE (C); anti-lambdaFITC/anti-kappaPE (D); and anti-CD8FITC/anti-CD4PE (E). Percentages are indicated.
To assess whether the expanded B cell compartment in A-myb transgenic mice represented a monoclonal population, spleen DNA was hybridized to an IgH enhancer probe. Genomic blots showed no clonally rearranged bands above the 5% threshold, indicating that the expanded B cell population in A-myb transgenic mice is polyclonal (data not shown).
Increased Proliferation in A-myb Transgenic B Lymphocytes.
Light microscopy of transgenic spleen and lymph node tissue sections revealed an increased number of mitotic cells, suggesting that proliferation was enhanced relative to control tissue. To determine whether transgenic B lymphocytes were growing faster than their normal counterparts, purified splenic B cells were stimulated in vitro and assessed for changes in proliferative status. In the presence of a low dose of lipopolysaccharide (5 μg/ml), transgenic B cells exhibited an increased rate of DNA synthesis, as determined by the rate of tritiated thymidine incorporation. On average, transgenic B cells incorporated 2.7 times more radioactive nucleotide than their nontransgenic counterparts (Fig. 5). Without mitogenic stimulation, transgenic B cells were quiescent, emphasizing that these cells do not proliferate independently of exogenous stimulation.
DISCUSSION
To investigate the functions of A-myb, we generated transgenic mice carrying the human A-myb cDNA under the control of heterologous promoters, MT-1 and MMTV LTR. Although high expression levels were found in a number of tissues, including the testes, where endogenous A-myb expression is tightly regulated, abnormalities were most evident within the lymphoid compartment. Ectopic A-myb expression resulted in the expansion of a follicular center B cell population in 57% of mice more than 9 months of age. The most consistent anatomical sites of hyperplasia were the lymph nodes and spleen, where cellularity and tissue size were increased 2.8- and 2.5-fold, respectively, over nontransgenic littermates. Histologic abnormalities in these tissues were strikingly similar to defects reported in Eμ-bcl-2 transgenic mice, in which deregulated gene expression induced a polyclonal expansion of mature follicular B cells concomitant with tissue hyperplasia and loss of morphological integrity (25). Mechanistically, hyperplasia in bcl-2 transgenic mice resulted from an ablation of apoptosis, where cell numbers increased through accretion. Viability studies performed on A-myb transgenic lymphocytes indicated that A-myb does not confer a survival advantage in liquid culture (data not shown), nor is bcl-2 expression up-regulated in this population, suggesting that although the pathology is similar, A-myb and bcl-2 appear to operate through independent mechanisms.
Histologic observation of A-myb transgenic spleen and lymph nodes revealed numerous mitotic figures, suggesting that hyperplasia resulted from increased lymphoproliferation. Thymidine incorporation studies indicated that transgenic B cells incorporated more [3H]thymidine than normal lymphocytes when stimulated with lipopolysaccharide, suggesting an enhanced proliferative potential in this population. In support of these data, fibroblasts transfected with a full-length A-myb cDNA were found to have a reduced cell cycle duration compared with mock-transfected controls. An abbreviated cell cycle was concomitant with a shortened G1/S transition, suggesting that A-myb may increase the rate of cell proliferation by reducing the duration of the cell cycle (unpublished observations). Other studies have demonstrated that A-myb expression is confined to a subset of primary tonsillar B lymphocytes that contained more than 95% cycling cells, suggesting a correlation between A-myb expression and enhanced cell proliferation within certain B cell subsets (20).
Fluorescent analysis of single cell suspensions derived from hyperplastic lymph node and spleen indicated an increased mature B cell population, demonstrated by positivity for Ig, κ light chain, and CD38. This phenotype is reminiscent of the highly proliferative, buoyant tonsillar B cell fraction [CD38+, CD39−, IgM− (IgG+/IgA+)], previously shown to express high levels of A-myb (20). CD38, a characteristic marker of germinal center B cells, tightly correlates with A-myb expression in vivo, which has led to the hypothesis that A-myb is specifically induced in activated germinal center B cells and may define a discreet developmental stage in B cell maturation (20, 21). In vitro studies coupled with data presented herein suggest that germinal center B cells are the primary target of A-myb. Although deregulated A-myb expression appears to result in increased cell proliferation, it is unclear whether proliferation occurs as a direct result of an abbreviated cell cycle or as a result of an expanded population of proliferating cells. Ectopic A-myb expression could interfere with normal B cell differentiation in a manner previously described for c-myb, where sustained expression resulted in a block in erythroid/myeloid maturation (12–14). In theory, A-myb expression could interfere with differentiation at a stage in which germinal center B cells are highly proliferative, resulting in the expansion of a subset with a high proliferative capacity. This would explain the predominant effect of ectopic A-myb expression in a subset of B cells despite the expression of the A-myb transgene in other tissues. The nature of B lymphocyte expansion in A-myb transgenic mice must be defined further. This information could help determine whether A-myb is impacting proliferative or developmental programs.
Acknowledgments
We thank Judy Morgan and Dr. Linda Siracusa for transgene microinjection, Dr. Fred Rock for assistance with animal autopsies, Dr. Tim Manser for providing the IgH enhancer probe, Andrew Engelhard and Dr. Ron Gartenhaus for critical reading of the manuscript, and Dr. Paolo Lusso for helpful and insightful discussions. This work was supported by National Institutes of Health Grants RO1 46782 (B.C.) and RO1 CA39481/CA47282 (R.I.). S.E.D. was supported by National Institutes of Health Training Grant 5T32HL07780.
ABBREVIATIONS
- LTR
long terminal repeat
- MMTV
mouse mammary tumor virus
References
- 1.Nomura N, Takahashi M, Matsui M, Ishii S, Date T, Sasamoto S, Ishizaki R. Nucleic Acids Res. 1988;16:11075–11089. doi: 10.1093/nar/16.23.11075. [DOI] [PMC free article] [PubMed] [Google Scholar]
- 2.Biedenkapp H, Borgmeyer U, Sippel A E, Klempnauer K H. Nature (London) 1988;335:835–837. doi: 10.1038/335835a0. [DOI] [PubMed] [Google Scholar]
- 3.Mizuguchi G, Nakagoshi H, Nagase T, Nomura N, Date T, Ueno Y, Ishii S. J Biol Chem. 1990;265:9280–9284. [PubMed] [Google Scholar]
- 4.Golay J, Loffarelli L, Luppi M, Castellano M, Introna M. Oncogene. 1994;9:2469–2479. [PubMed] [Google Scholar]
- 5.Foos G, Grimm S, Klempnauer K H. Oncogene. 1994;9:2481–2488. [PubMed] [Google Scholar]
- 6.Ma X, Calabretta B. Cancer Res. 1994;54:6512–6516. [PubMed] [Google Scholar]
- 7.Klempnauer K H, Gonda T J, Bishop J M. Cell. 1982;31:453–463. doi: 10.1016/0092-8674(82)90138-6. [DOI] [PubMed] [Google Scholar]
- 8.Moscovici C, Samarut J, Gazzolo L, Moscovici M G. Virology. 1981;113:765–768. doi: 10.1016/0042-6822(81)90205-1. [DOI] [PubMed] [Google Scholar]
- 9.Radke K, Beug H, Kornfeld S, Graf T. Cell. 1982;31:643–653. doi: 10.1016/0092-8674(82)90320-8. [DOI] [PubMed] [Google Scholar]
- 10.Hu Y L, Ramsay R G, Kanei-Ishii C, Ishii S, Gonda T J. Oncogene. 1991;6:1549–1553. [PubMed] [Google Scholar]
- 11.Lane T, Ibanez C, Garcia A, Graf T, Lipsick J. Mol Cell Biol. 1990;10:2591–2598. doi: 10.1128/mcb.10.6.2591. [DOI] [PMC free article] [PubMed] [Google Scholar]
- 12.Clarke M F, Kukowska-Latallo J F, Westin E, Smith M, Prochownik E. Mol Cell Biol. 1988;8:884–892. doi: 10.1128/mcb.8.2.884. [DOI] [PMC free article] [PubMed] [Google Scholar]
- 13.McMahon J, Howe K M, Watson R J. Oncogene. 1988;3:717–720. [PubMed] [Google Scholar]
- 14.Yanagisawa H, Nagasawa T, Kuramochi S, Abe T, Ikawa Y, Todokoro K. Biochim Biophys Acta. 1991;1088:380–384. doi: 10.1016/0167-4781(91)90128-9. [DOI] [PubMed] [Google Scholar]
- 15.Gerwirtz A M, Calabretta B. Science. 1988;242:1303–1306. doi: 10.1126/science.2461588. [DOI] [PubMed] [Google Scholar]
- 16.Gerwirtz A M, Anfossi G, Venturelli D, Valpreda S, Sims R, Calabretta B. Science. 1989;245:180–183. doi: 10.1126/science.2665077. [DOI] [PubMed] [Google Scholar]
- 17.Trauth K, Mutschler B, Jenkins N A, Gilbret D J, Copeland N B, Klempnauer K H. EMBO J. 1994;13:5994–6005. doi: 10.1002/j.1460-2075.1994.tb06945.x. [DOI] [PMC free article] [PubMed] [Google Scholar]
- 18.Sleeman J P. Oncogene. 1993;8:1931–1941. [PubMed] [Google Scholar]
- 19.Mettus R V, Litvin J, Wali A, Toscani A, Latham K, Hatton K, Reddy E P. Oncogene. 1994;9:3077–3086. [PubMed] [Google Scholar]
- 20.Golay J, Erba E, Bernasconi S, Peri G, Introna M. J Immunol. 1994;153:543–553. [PubMed] [Google Scholar]
- 21.Golay J, Luppi M, Songia S, Palvarini C, Lombardi L, Aiello A, Delia D, Lam K, Crawford D H, Biondi A, Barbui T, Rambaldi A, Introna M. Blood. 1996;5:1900–1911. [PubMed] [Google Scholar]
- 22.Sambrook J, Fritsch E F, Maniatis T. Molecular Cloning: A Laboratory Manual. 2nd Ed. Plainview, NY: Cold Spring Harbor Lab. Press; 1989. [Google Scholar]
- 23.Giusti A M, Coffee R, Manser T. Proc Natl Acad Sci USA. 1992;89:10321–10325. doi: 10.1073/pnas.89.21.10321. [DOI] [PMC free article] [PubMed] [Google Scholar]
- 24.Hogan B, Beddington R, Costantin F, Lacy E. Manipulating the Mouse Embryo: A Laboratory Manual. 2nd Ed. Plainview, NY: Cold Spring Harbor Lab. Press; 1994. [Google Scholar]
- 25.McDonnell T J, Deane N, Platt F M, Nunez G, Jaeger U, McKearn J P, Korsmeyer S J. Cell. 1989;57:79–88. doi: 10.1016/0092-8674(89)90174-8. [DOI] [PubMed] [Google Scholar]


