Abstract
Bone is a mechanosensitive tissue that adapts its mass, architecture and mechanical properties to external loading. Appropriate mechanical loads offer an effective means to stimulate bone remodeling and prevent bone loss. A role of in situ strain in bone is considered essential in enhancement of bone formation, and establishing a quantitative relationship between 3D strain distributions and a rate of local bone formation is important. Digital speckle pattern interferometry (DSPI) can achieve whole-field, non-contacting measurements of microscopic deformation for high-resolution determination of 3D strain distributions. However, the current system does not allow us to derive accurate strain distributions because of complex surface contours inherent to biological samples. Through development of a custom-made piezoelectric loading device as well as a new DSPI-based force calibration system, we built an advanced DSPI system and integrated local contour information to deformation data. Using a mouse femur in response to a knee loading modality as a model system, we determined 3D strain distributions and discussed effectiveness and limitations of the described system.
Keywords: Bone strain, digital speckle pattern interferometry (DSPI), ESPI, mechanical loading, deformation and contour information
1. INTRODUCTION
Mechanical loading is a potent osteogenic stimulator, and animal and clinical studies support that mechanical loading strengthens bone, and prevent bone loss [1-3]. Despite those outcomes, the mechanism of load-induced bone formation needs further investigation. It is proposed that mechanical strain is a principal determinant of bone formation and a minimum effective strain threshold may be surpassed to activate new bone formation. However, loading methods such as a knee loading modality is able to enhance bone formation with dozens of microstrains at the site of new bone formation. In order to examine the role of in situ strain in bone formation, it is therefore critical to evaluate local and global strain distributions at high resolution. Strain gauges, frequently used in bone mechanics, do not provide sufficient resolution or 3D components in strain distributions. A whole-field strain measurement can be conducted by digital image correlation (DIC) or digital speckle pattern interferometry (DSPI) techniques [4-9]. Since DIC is in general limited to strains above several hundreds of microstrains [9-13], we focused on DSPI in this study.
DSPI, originally known as electronic speckle pattern interferometry, is an interferometry based method that allows achieving whole-field, non-contacting measurements of microscopic deformation [14-19]. Although the current applications of DSPI system for bone strain measurement can provide 3D measurements [20-23], they do not evaluate any contour changes of the sample surface. Therefore, the local coordinate on the sample surface, particularly a complex surface of biological samples, can be significantly different from the sensor-fixed coordinate. Namely, if strains on a bone surface are determined without considering alteration of the sample contour, the result could be misleading because of deviations between the local coordinate and sensor-fixed coordinate [24-25].
Here, we considered not only deformations in the sensor-fixed coordinate but also load-driven deviations of the local coordinate using contour information. We used mouse femora as a model system and determined 3D high-resolution strains in response to the loads applied to the knee. To this end, we developed a custom-made piezoelectric loading device and a DSPI-based force calibration system. We first described the fundamentals of the DSPI system and then presented the experimental results under different loading conditions. The effectiveness and the limitation of the described DSPI system were discussed.
1. FUNDAMEANTAL OF DSPI FOR STRAIN MEASUREMENT ON 3D-OBJECT
2.1. DSPI for Deformation and Contour Measurement
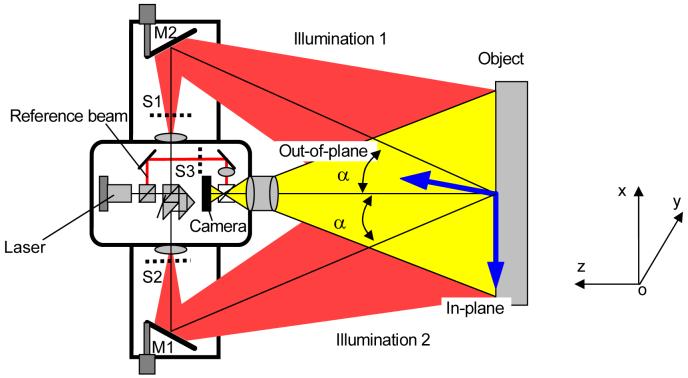
DSPI is a laser measuring technique for deformation and strain measurement based on speckle interferometry, digital data processing, and phase distribution calculation by a phase shift technique. Figure 1 depicts a schematic setup of 3D-DSPI measurement system. In brief, the laser beam is split into different directions (several laser illumination beams and a reference beam). By combining different pairs of laser beams, interferometers for measuring in-plane and out-of-plane deformation components are generated. Note that the labels S1, S2 and S3 indicate three path-controlling switches. An interferometer for out-of-plane measurement (out-of-plane deformation, w) is formed by opening the switches S1 and S3. Here, the sample is illuminated by laser beam 1. The reflected light from the sample surface interferes with the reference beam and generates an interference pattern, also called a speckle interferogram of a speckle pattern. An interferometer for in-plane measurement (in-plane deformation u or v) is generated by opening the switches S1 and S2, in which the sample is illuminated by a dual-beam illumination method. In this case, the illumination beams 1 and 2 with same angle “α” are used. The rays reflected from the object surface are recombined at the CCD-array of the CCD camera, and result in an interference pattern. The plane in which two illumination angles “α” lie is called the illumination plane. There are two in-plane components (u and v) and two in-plane interferometers with different illumination planes. In general, one dual beam illumination in xoz-plane is used for measuring a deformation component “u,” and the other in the yoz-plane for “v.”
Fig. 1.
The schematic setup of 3D-DSPI measurement system.
The intensities of interference patterns of three interferometers are recorded by the CCD cameras in succession by controlling the switches. Upon loading, a set of new interference patterns due to phase changes emerges and are recorded by the camera again. By comparing the intensities before and after loading, three visible fringe patterns are generated. The visible fringe patterns present the phase changes of each interferometer induced by the loading and the relationships between the deformations and the phase change are [26-27]:
| (1) |
where λ is the wavelength of laser, and Δu(x,y), Δv(x,y) and Δw(x,y) are the phase changes of two in-plane and one out-of-plane interferometers, respectively. The value of αxoz and αyoz represents an illumination angle in the xoz-plane and the yoz-plane, respectively.
As shown in equation 1, determination of three deformation components (u, v and w) needs evaluation of the phase changes [28]. To calculate a phase distribution from the digitized intensity data, a phase shift technique has to be applied in the measurement system. Different phase shift methods have been developed for phase calculation. Generally they can be divided into two categories (1) a temporal phase shift method and (2) a spatial phase shift method. The temporal phase shift method employs multi-interference images and the spatial phase shift method uses a single image [17]. Note that the temporal phase shift technique is suited for a static measurement and the spatial phase shift method is for a dynamic measurement, especially, for a transient vibration measurement. Here, since applied loads were static, the temporal phase shift technique was applied and the algorithm of four interference images was utilized.
While measuring contour, a dual-beam illumination is needed, where the optical layout is identical to in-plane interferometers for deformation measurements. The difference is that the two exposures are recorded when tilting the illumination beams by moving the mirrors M1 and M2 rather than loading the object as in deformation measurements. The mirrors M1 and M2 shown at the top and bottom in Fig.1 are driven by the piezoelectric actuator. The phase change due to the movement of mirrors M1 and M2 is linked to a surface contour of the sample. Similar to deformation measurements, the phase change is quantified by the temporal phase shift method [29-32].
2.2. Determination of Surface Deformations and Strains
When a sample has an extensive curved surface, a coordinate system on the object surface varies with the contour. The three deformation components on the object surface are expressed differently in the sensor coordinate. Here, the deformation components in the sensor coordinate are transformed into the object coordinate [33]:
| (2) |
where u, v, and w are the measured deformation components in the sensor coordinate system (xyz-coordinates), and u’, v’ and w’ are the deformation components on the object surface (x’y’z’-coordinates). Both xyz and x’y’z’ are the Cartesian coordinates. The elements of li, mi and ni are the direction cosines values between x’, y’ and z’ axes, and x, y and z axes. After the transformation from a set of u, v and w, into the other set of u’, v’ and w’, the in-plane strains on the curved surface are calculated:
| (3) |
The surface principal strains are determined according to the principle of Mohr’s circle:
| (4) |
3. EXPERIMENTAL PROCEDURES
3.1. Bone Samples
Murine femora were harvested from C57/BL6 female mice (a body weight, ∼ 20 g) (Harlan Sprague-Dawley, Inc.) after anesthetizing mice with CO2. The isolated femora were cleaned out of muscles and connective tissues, and experiments for strain measurements were conducted within 30 min after harvest. All procedures, performed in this study, were approved and in accordance with the Oakland University Animal Care and Use Committee guidelines.
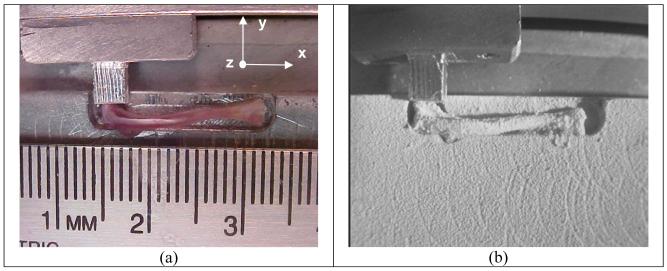
Figure 2a illustrates the image of a mouse femur that is positioned in a sample table of the custom-made piezoelectric mechanical loader. In order to increase surface reflectance, white powders were thinly sprayed onto the femoral surface (Fig. 2b). A T-form aluminum rod was used for loading. The narrow side of the rod was contacted to the distal epiphysis of the femur (knee side) and the wider side was fixed to the sample table.
Fig. 2.
Mouse femur on a sample table, (a) Sample prior to white spray, (b) Sample coated with white spray.
3.2. Loading System
The loads were applied laterally to the distal epiphysis in the knee, and Fig. 3 illustrates the custom-made piezoelectric loading device. This loading device consisted of 4 piezoelectric plates as actuators. Their top end was connected to the T-form aluminum rod and the bottom end was fixed to the stationary support. The device was driven by a voltage signal generated with a piezoelectric driver. During measurements, we applied 5 steps of loading in 10-sec interval with an increment of 11.8 V to the piezoelectric actuator. This voltage step generated a step force of 0.2 N, and the total force applied to the epiphysis was 1 N.
Fig. 3.
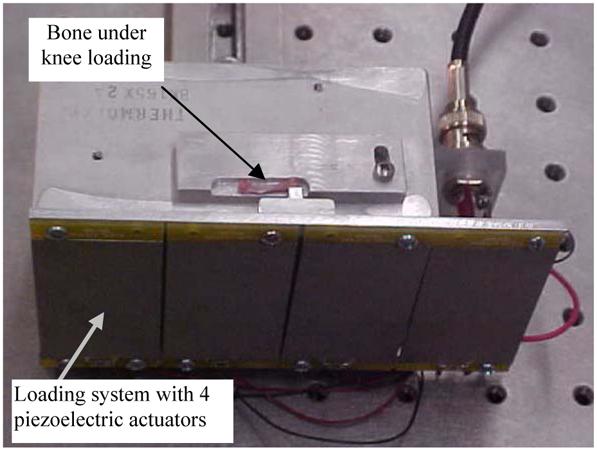
The custom-made piezoelectric loading device.
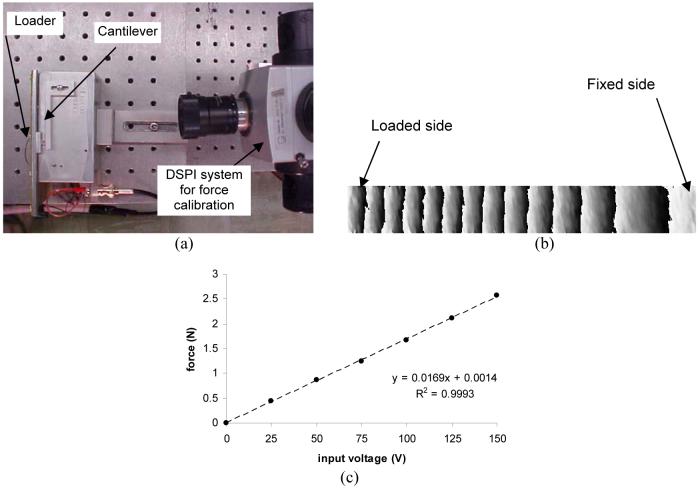
The force calibration was conducted using an out-of-place DSPI system with an aluminum cantilever (6061-T6; E = 73.1 GPa), whose dimensions was l = 4.2 cm (length), b = 0.5 cm (width), and h = 0.4 cm (height). Using the relationship of F = (3EI/l3) y, where F = force, E = modulus of elasticity, and I = moment of inertia, the applied force was estimated as a function of the voltage to the device.
3.3. Experimental Setup
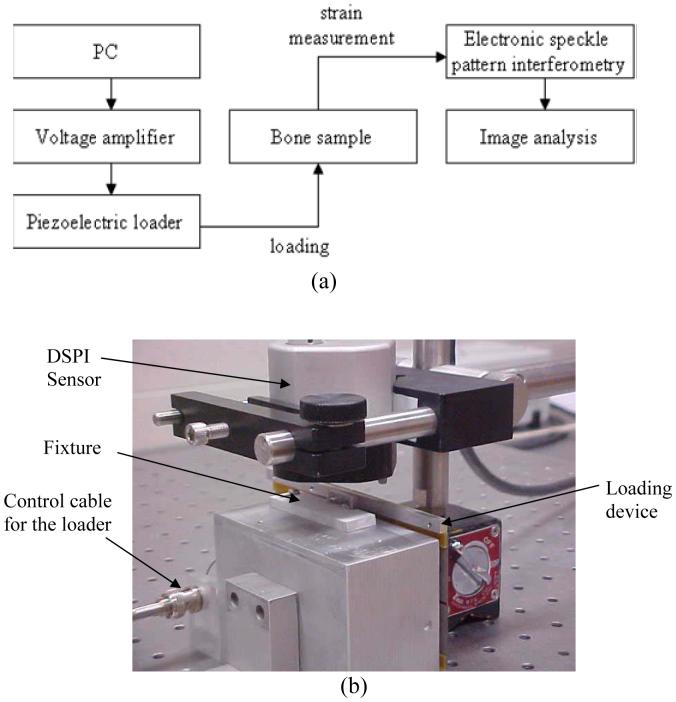
Figure 5 shows the strain measurement system including the flow chart of the experimental procedures and the experimental setup. The mouse femur was loaded by the piezoelectric loading device, and the device was driven with a voltage amplifier controlled by a PC. We used Q-100 DSPI system (Dantec-Dynamics GmbH, Germany), which is able to collect both deformation and contour information.
Fig. 5.
Strain measurement system, (a) Flow-chart of the experimental procedures, (b) Experimental setup consisting of DSPI, the piezoelectric loading device.
4. RESULTS AND DISCUSSION
4.1. Measurement Results
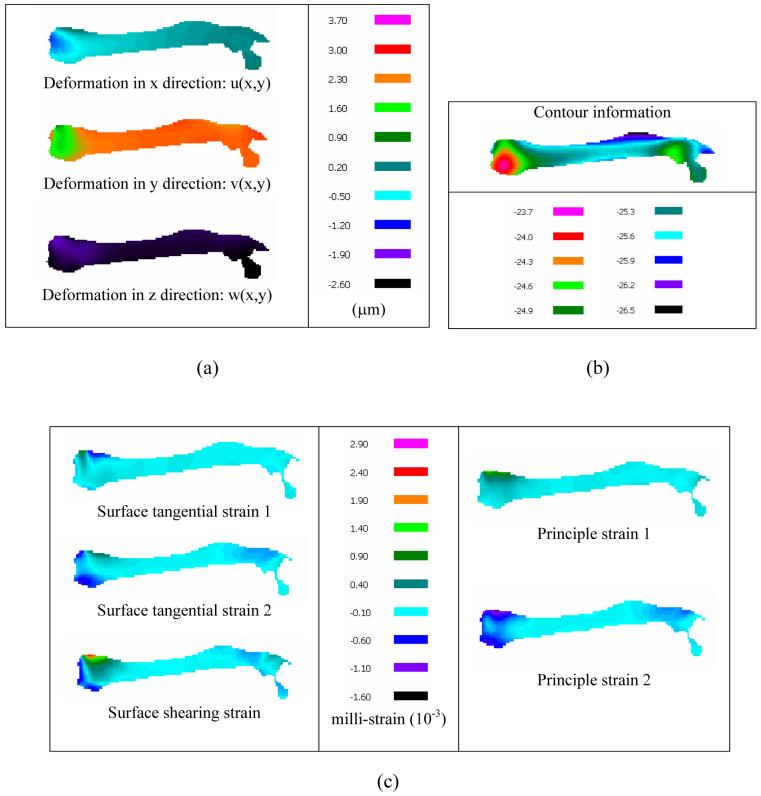
In response to 1 N force with knee loading, we measured 3D components of bone deformation as well as the bone surface contour and derived a set of strains (Fig. 6). The strains included three in-plane strains in the tangential plane and two principal strains 1 and 2. Note that the sample was loaded by compressive force and the principal strain 2 corresponds to compression strain at the loading site.
Fig. 6.
Microscopic deformations and strains on a femoral surface in response to 1 N, (a) 3D components of deformations, (b) Contour information, (c) Calculated strains.
In-plane strains
Strains such as surface tangential strains and shearing strain are denoted in the x’y’z’ coordinate system whose alignment is sensitive to and altered by the contour change. In this study, loading was compressive along the y-axis of the sensor-fixed coordinate (vertical direction in Fig. 6). Note that the y’-axis, used to define surface tangential strain 2, was shifted from this loading direction (y-direction). Therefore, we observed a region of tensile strains (positive value) in surface tangential strain 2 near the loading site in spite of compressive loads. Furthermore, bone is an inhomogeneous, anisotropic material, and its surface contour is easily changed by loading. The results clearly show that shearing strain was therefore non zero and in some regions even larger than surface tangential strains.
Principal strains
In order to examine complex strain profiles of the inhomogeneous and anisotropic sample with a significant alteration in its contour, we focused on evaluation of principal strains. Since the sample was loaded by compressive force, the principal strain 2 turned out to be the most meaningful term in our analyses (Fig. 6c). As expected, the result shows a strain distribution with the highest strain at the loading site. In the midshaft along the length of the femur, however, the primary principal strain was nearly zero (less than 0.1 milli-strain).
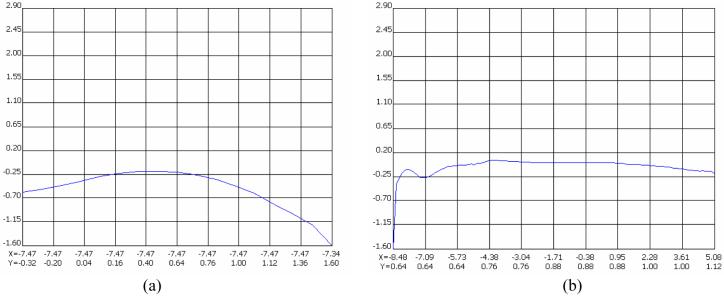
Figure 7 displays the vertical and horizontal profiles of the principle strain 2. The vertical profile exhibits complex strain variations at the loading site in the knee, while the horizontal profile depicts a nearly uniform strain distribution along the length of the femur except for the loading site near the figure origin. Note that the maximum compressive strain in the epiphysis at the loading site was approximately 1.6 milli-strain, and the stable compressive strain in the diaphysis of the femoral midshaft was nearly zero.
Fig. 7.
Profiles of the principle strain 2, (a) Profile along the vertical direction at the loading position, (b) Profile along the horizontal direction through the length of the femur.
Measurement repeatability
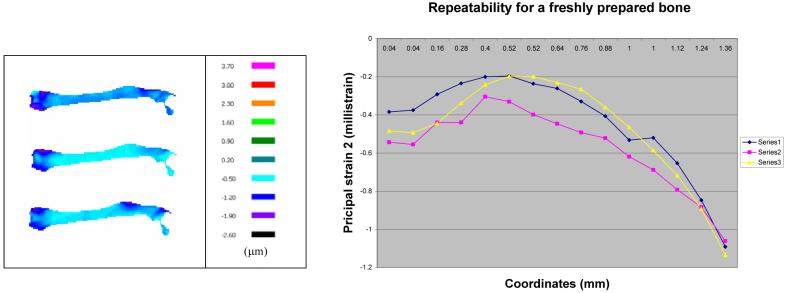
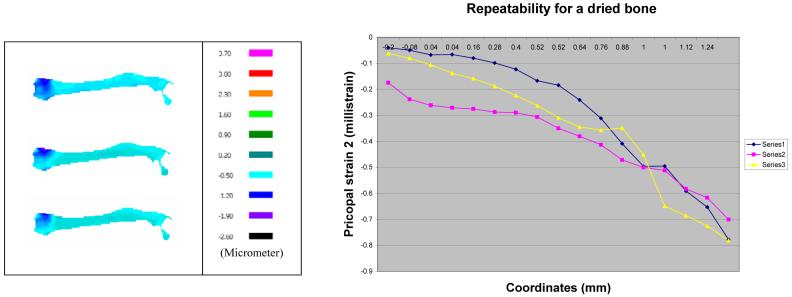
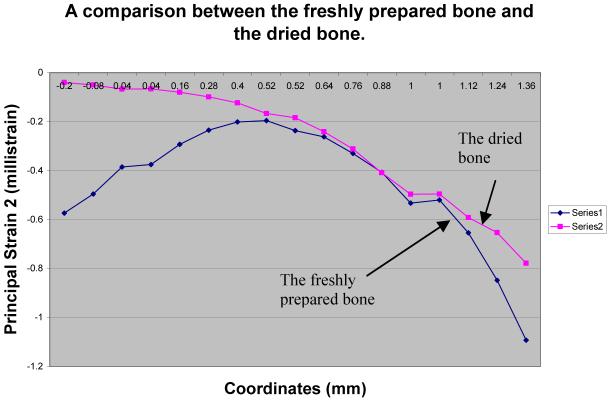
The measurement repeatability was examined using the freshly prepared samples as well as the dried samples. First, the freshly prepared sample within 30 minutes after harvest was used. Figure 8a shows the primary strain (the principal strain 2) distributions for three consecutive measurements, and Figure 8b presents their profiles in the vertical direction at the loading site. These data demonstrate that the strain profiles are repeatable with a maximum fluctuation of ∼ 0.2 milli strain. Second, we followed the same experimental procedure using the dried sample 2.5 hours after harvest (Fig. 9). Although we observed repeatability within three consecutive measurements, the observed strain pattern for the dried sample was significantly different from one for the freshly prepared samples. The primary strain of the dry bone was smaller than that of the fresh bone, possibly because of hardening of the dried sample (Fig. 10).
Fig. 8.
Repeatability test for a freshly prepared bone, (Left) Primary principal strains for three consecutive measurements, (Right) Strain profiles in the vertical direction at the loading site.
Fig. 9.
Repeatability test for a dried bone, (Left) Primary principal strains for three consecutive measurements, (Right) Strain profiles in the vertical direction at the loading site.
Fig. 10.
Comparison of the primary principal strains between the freshly prepared bone and the dried bone.
4.2. Discussion
DSPI is an optical technique that can provide a full-field, non-contacting, 3D strain measurements. The described system has high measurement sensitivity and thus well suited for detecting microscopic deformation. It also has a high-spatial resolution and can capture a peak strain in a high-strain gradient area. DSPI does not require any particular calibration preparation such as etching and polishing. Therefore, it can provide an alternative method to strain gauges for analyzing bone strains. The measurement system has the CCD camera consisting of 10,140 pixels per mm2 in an area of 7.6 mm × 5.8 mm, and it can provide spatial resolution sufficient to capture a subtle gradient of deformation.
The results here with DSPI-based measurements reveal that strain in the femoral diaphysis is significantly smaller (nearly zero) than that in the distal epiphysis at the loading site (> 1 milli-strain). Since knee loading is able to enhance bone formation in the femoral diaphysis with as small as 0.5 N force [34], the current study indicate that in situ strain is not necessarily required for load-driven bone formation. One of the working hypotheses underlying load-driven bone formation with knee loading is that loads applied to the epiphysis induce pressure alteration in the medullary cavity and this pressure gradient drives fluid flow and stimulates proliferation and development of bone cells [35]. Further analyses are required to evaluate the relationship among biomechanical factors such as strain, pressure gradient, and fluid flow in load-driven bone formation.
Application of the current DSPI system for characterization of biomaterials is yet to be improved. First, one of the requirements for measurements is specimen stabilization. Any motion induced by inappropriate fixture, wobble or tilt, rigid body rotation, or surface alteration causes speckle decorrelation and results in uninterpretable data. Hence, any sample should be immobilized tightly to the sample table but this immobilization procedure may alter original strain distributions. The challenge is to develop an algorithm that does not require stringent sample immobilization. Second, coating a sample surface with a white powder is necessary to increase surface reflectance. However, coating may alter the mechanical behavior of the sample. Third, the current technique has difficulty in measuring stains of a wet sample, since the wet surface tends to decorrelate speckle patterns. In spite of those limitations, potential applications of DSPI in characterization of biomaterials, particularly, of bones, are innumerable. With further developments and improvements, it will be a powerful tool for characterizing biomaterials and understanding the role of strains in biomedical processes.
5. CONCLUSIONS
The 3D high-resolution strain distributions on the mouse femur were determined in response to knee loading with 1 N force using DSPI and the custom-made piezoelectric loading device. A novel DSPI-based procedure was developed for strain determination by incorporating contour information of the complex sample surface as well as force calibration. We observed significant difference in the primary principal strains with and without considering contour information. The described DSPI system has advantages in analyzing small samples with complex surface morphology. In conclusion, the principal strains on the loaded femora were evaluated for the first time with the 3D-DSPI technique by taking into account the contour changes and the results suggested potential bone formation with virtually zero in situ strain in the femoral diaphysis with knee loading.
Fig. 4.
DSPI-based force calibration, (a) Configuration of a calibration system, (b) Deflection pattern detected by DSPI, (c) Calibration line between the input voltage to the device and force, The response is linear, and the loading device induces 1 N force per 59 V.
ACKNOWLEDGEMENT
This study was in part supported by NIH R01AR52144.
Footnotes
Publisher's Disclaimer: This is a PDF file of an unedited manuscript that has been accepted for publication. As a service to our customers we are providing this early version of the manuscript. The manuscript will undergo copyediting, typesetting, and review of the resulting proof before it is published in its final citable form. Please note that during the production process errors may be discovered which could affect the content, and all legal disclaimers that apply to the journal pertain.
REFERENCES
- 1.Turner CH. Three rules for bone adaptation to mechanical stimuli. Bone. 1998;23:399–404. doi: 10.1016/s8756-3282(98)00118-5. [DOI] [PubMed] [Google Scholar]
- 2.Carmeliet G, Vico L, Bouillon R. Space flight: a challenge for normal bone homeostasis. Critical Rev. Eukaryotic Gene Expression. 2001;11:131–144. [PubMed] [Google Scholar]
- 3.Ehrlich PJ, Lanyon LE. Mechanical strain and bone cell function: a review. Osteoporosis Int. 2002;13(3):257–264. doi: 10.1007/s001980200095. [DOI] [PubMed] [Google Scholar]
- 4.Vest CM. Holographic interferometrystberg. John Wiley and Sons; New York: 1979. [Google Scholar]
- 5.Osten W. Akademie Verlag; Berlin: 1991. Digital Verarbeitung und Auswertung von Interferenzbilden. [Google Scholar]
- 6.Steinchen W, Yang L. Digital Shearography - Theory and Application of Digital Speckle Pattern Shearing Interferometry. SPIE Press; Bellingham: 2003. [Google Scholar]
- 7.Hung PC, Voloshin AS. In-plane strain measurement by digital image correlation. J Braz Soc Mech Sci & Eng. 2003;25(3):215–221. [Google Scholar]
- 8.Carcie D, Orteu JJ, Penazzi L. A Combined temporal tracking and stereo-correlation technique for accurate measurement of 3D displacements: application to sheet metal forming. J. Material Processing Technology. 2002;125/126:736–742. [Google Scholar]
- 9.Sutton MA, Cheng MG, Peters WH, Chao YJ, Ncneill SR. Application of an optimized digital Correlation method to planar deformation analysis. Image and Vision Computing. 1986;4(3):143–151. [Google Scholar]
- 10.Bey MJ, Song HK, Wehrli FW, Soslowsky LJ, Noncontact A. Nondestructive Method for Quantifying Intratissue Deformations and Strain. J Biomech Eng - Transaction of the ASME. 2002;124:253–261. doi: 10.1115/1.1449917. [DOI] [PubMed] [Google Scholar]
- 11.Nicolella D, Nicholls AE, Lankford J, Davy D. Machine vision photogrammetry: a technique for measurement of microstructural strain in cortical bone. J. Biomechanics. 2001;34:135–139. doi: 10.1016/s0021-9290(00)00163-9. [DOI] [PubMed] [Google Scholar]
- 12.Zhang DS, Arola DD. Application of Digital Image Correlation to Biological Tissues. J Biomed Opt. 2004;9(4):691–699. doi: 10.1117/1.1753270. [DOI] [PubMed] [Google Scholar]
- 13.Bay BK. Texture Correlation: A Method for Measurement of Detailed Strain Distributions Whithin Trabecular Bone. J. Orthop Res. 1995;13:258–267. doi: 10.1002/jor.1100130214. [DOI] [PubMed] [Google Scholar]
- 14.Jones R, Wykes C. Holographic and Speckle Interferometry. Cambridge University Press; 1989. [Google Scholar]
- 15.Furlong C, Pryputniewicz RJ. Hybird Computation and Experimental Approach for the Study and Optimization of Mechanical Components. Opt Eng. 1998;37(5):1448–1455. [Google Scholar]
- 16.Xu L, Peng XY, Miao J, Asundi AK. Studies of Digital Microscopic Holography with application to Microstructure Testing. Applied Optics. 2001;40(28):5046–5051. doi: 10.1364/ao.40.005046. [DOI] [PubMed] [Google Scholar]
- 17.Kreis T. Holographic Interferometry: Principles and Methods. John Wiley & Sons, Inc; 1996. [Google Scholar]
- 18.Schmit J, Patorski K, Creath K. Simultaneous registration of in- and out-of-plane displacements in modified grating interferometry. Optical Engineering. 1997;36(8):2240–2248. [Google Scholar]
- 19.Seebacher S, Osten W, Jueptner WPO. Measuring shape and deformation of small objects using digital holography. Proc. of SPIE. 1998;3479:104–115. [Google Scholar]
- 20.Tyrer JR, Shelton JC. Chapter 4: Holographic interferometry; Briers JD. Chapter 5: Speckle techniques; Tyrer JR. Chapter 6: Electronic speckle pattern interferometry. In: Orr JF, Shelton JC, editors. Optical Measurement Methods in Biomechanics. Chapman and Hill; London: 1996. [Google Scholar]
- 21.Tyrer JR, Heras-Palou C, Slater T. Three-dimensional human femoral strain analysis using ESPI. Optics and Lasers in Engineering. 1995;23(5):291–303. [Google Scholar]
- 22.Zhang D, Arola DD, Rouland JA. Evaluating the elastic modulus of bone using electronic speckle pattern interferometry. Experimental Techniques. 2001;25:32–34. [Google Scholar]
- 23.Su M, Samala P, Jiang H, Liu S, Yang LX, Yokota H. Measurement of bone strain using electronic speckle pattern interferometry. J Holography and Speckle. 2005;2(1):34–39. [Google Scholar]
- 24.Ettemeyer A. Combination of 3-D deformation and shape measurement by electronic speckle-pattern interferometry for quantitative strain- stress analysis. Opt. Eng. 2000;39(1):212–215. [Google Scholar]
- 25.Yang L, Ettemeyer A. Strain measurement by three-dimensional electronic speckle pattern interferometry: potentials, limitations, and applications. Opt. Eng. 2003;42(5):1257–1266. [Google Scholar]
- 26.Yang L, Steinchen W, Schuth M, Kupfer G. Precision measurement and nondestructive testing by means of digital phase shifting speckle pattern and speckle pattern shearing interferometry. Measurement. 1995;16:149–160. [Google Scholar]
- 27.Bown B, Martin S, Toal V, Langhoff A, Whelan M. Dual in-plane electronic speckle pattern interferometry system with electro-optical switching and phase shifting. Applied Optics. 1999;38(4):666–673. doi: 10.1364/ao.38.000666. [DOI] [PubMed] [Google Scholar]
- 28.Creath K. Phase-shifting speckle interferometry. Appl. Opt. 1985;24(18):3053–3058. doi: 10.1364/ao.24.003053. [DOI] [PubMed] [Google Scholar]
- 29.Joenathan C, Mohanty RK, Sirohi RS. Contouring by speckle interferometry. Opt. Lett. 1985;10:579–581. doi: 10.1364/ol.10.000579. [DOI] [PubMed] [Google Scholar]
- 30.Joenathan C, Pfister B, Tiziani HJ. Contouring by electronic speckle pattern interferometry employing dual beam illumination. App. Opt. 1990;29(13):1905–1911. doi: 10.1364/AO.29.001905. [DOI] [PubMed] [Google Scholar]
- 31.Peng HY, Zou YL, Tiziani HJ. Contouring by modified dual-beam ESPI based on tilting illumination beams. Optik. 1992;90(2):61–64. [Google Scholar]
- 32.Seebacher S, Osten W, Jueptner WPO. Measuring shape and deformation of small objects using digital holography. Proc. of SPIE. 1998;3479:104–115. [Google Scholar]
- 33.Fung YC. A First course in continuum mechanics: for physical and biological engineers and scientists. Prentice Hall, Englewood Cliffs; NJ: 1994. [Google Scholar]
- 34.Zhang P, Tanaka SM, Jiang H, Su M, Yokota H. Diaphyseal bone formation in murine tibiae in response to knee loading. J. Appl. Physiol. 2006;100:1452–1459. doi: 10.1152/japplphysiol.00997.2005. [DOI] [PubMed] [Google Scholar]
- 35.Warden SJ. Breaking the rules for bone adaptation to mechanical loading. J. Appl. Physiol. 2006;100:1441–1442. doi: 10.1152/japplphysiol.00038.2006. [DOI] [PubMed] [Google Scholar]


