Abstract
Plants synthesize the osmoprotectant glycine betaine via the route choline → betaine aldehyde → glycine betaine. In spinach, the first step is catalyzed by choline monooxygenase (CMO), a ferredoxin-dependent stromal enzyme that has been hypothesized to be an oligomer of identical subunits and to be an Fe-S protein. Analysis by HPLC and matrix-assisted laser desorption ionization MS confirmed that native CMO contains only one type of subunit (Mr 42,864). Determination of acid-labile sulfur and nonheme iron demonstrated that there is one [2Fe-2S] cluster per subunit, and EPR spectral data indicated that this cluster is of the Rieske type—i.e., coordinated by two Cys and two His ligands. A full-length CMO cDNA (1,622 bp) was cloned from spinach using a probe generated by PCR amplification for which the primers were based on internal peptide sequences. The ORF encoded a 440-amino acid polypeptide that included a 60-residue transit peptide. The deduced amino acid sequence included two Cys-His pairs spaced 16 residues apart, a motif characteristic of Rieske-type Fe-S proteins. Larger regions that included this motif also showed some sequence similarity (≈40%) to Rieske-type proteins, particularly bacterial oxygenases. Otherwise there was very little similarity between CMO and proteins from plants or other organisms. RNA and immunoblot analyses showed that the expression of CMO in leaves increased several-fold during salinization. We conclude that CMO is a stress-inducible representative of a new class of plant oxygenases.
Keywords: metallobiochemistry, osmoprotectant biosynthesis, Rieske center, salinity, Spinacia oleracea L.
Organic solutes such as betaines, polyols, and proline are accumulated by many bacteria, animals and plants as an adaptation to salt or water stress (1, 2). These compounds, termed compatible osmolytes or osmoprotectants, are compatible with metabolism and can reduce ion toxicity (1). Their biosynthetic pathways were accordingly identified more than a decade ago as targets for metabolic engineering to improve stress tolerance. The potential of this approach has now been demonstrated by engineering the accumulation of glycine betaine in microorganisms (3, 4) and mannitol or proline in tobacco (5, 6).
Glycine betaine is a particularly widespread and effective osmoprotectant (1, 2, 7). In plants, it is synthesized by a two-step oxidation of choline: choline → betaine aldehyde → glycine betaine. In spinach, the first step is catalyzed by choline monooxygenase (CMO), a ferredoxin-dependent enzyme that produces the hydrate form of betaine aldehyde (8). The second step is mediated by betaine aldehyde dehydrogenase (BADH) (8). Both CMO and BADH are located in the chloroplast stroma and increase in activity in response to salt stress (8). It proved to be straightforward to purify BADH and to use protein sequence data to isolate BADH cDNAs from various plants (see refs. 9 and 10). Some of these have now been expressed in transgenic tobacco (10, 11). In contrast, cDNA cloning of CMO has been refractory because the enzyme itself is most unusual.
CMO is in fact unique to plants. In other organisms, flavoprotein dehydrogenases or oxidases catalyze the choline oxidation reaction (3, 12–15). CMO may also be unique among plant oxygenases. Unlike many of these, it appears not to be a P450 enzyme: it is not membrane-bound, it is not sensitive to CO, and its optical spectrum is not that of a heme protein (16, 17). The features of this spectrum suggest rather that CMO could be an Fe-S protein (17). The quaternary structure of CMO is not clear. Gel filtration and SDS/PAGE analyses suggested that CMO might be a homodimer of subunit Mr ≈ 45,000, but did not rule out additional subunits (16, 17). These considerations led us to study the subunit composition and prosthetic group of CMO and to isolate and characterize CMO cDNAs.
MATERIALS AND METHODS
Protein Isolation and Analyses.
Enzymatically active CMO was purified as described from leaves of spinach (Spinacia oleracea L. cv. Savoy Hybrid 612) plants that had been grown and salinized with 200 mM NaCl (17). CMO was assayed radiometrically (17). Nonheme iron (18) and acid-labile sulfur (19) were determined colorimetrically. Protein was assayed by the bicinchoninic acid method (20). The native Mr of CMO was estimated by the PAGE method of Hedrick and Smith (21) and by gel filtration chromatography as described (17), except that a Superose 12 column (Pharmacia) was placed in tandem ahead of the Superdex 200 column (Pharmacia) to increase resolution. The tandem column was calibrated using (Mr standards (Sigma MW-GF-200) with the addition of transferrin (Mr 80,000).
HPLC and Mass Spectrometry.
CMO isolated as above was fractionated using a microbore HPLC system equipped with a Reliasil C18 column (Michrom BioResources, Auburn, CA). Elution (50 μl·min−1) was with a 5–95% gradient of acetonitrile in water, with 0.1% trifluoroacetic acid present throughout; the gradient was completed in 20 min. The eluate was monitored by absorbance at 214 nm. Mr values of peaks were determined by matrix-assisted laser desorption ionization MS (MALDI-MS) (22, 23). Spectra were acquired with a Voyager Elite time-of-flight mass spectrometer (PerSeptive Biosystems, Framingham, MA) operated in linear mode. The matrix was sinapinic acid. CMO mass determinations were internally calibrated using trypsinogen (Mr 23,979) and bovine serum albumin (Mr 66,431).
EPR Spectroscopy.
Samples of purified CMO (≈250 μg in 250 μl) were adjusted to pH 10 with 50 μl of 1 M glycine-NaOH and reduced by adding 1 mg Na dithionite. They were analyzed using a Bruker ECS 106 EPR x-band spectrometer with ER 4116 DM resonator and an Oxford liquid helium cryostat. Temperature was controlled by an Oxford Intelligent controller and monitored with a thermocouple 3 mm beneath the sample tube with liquid nitrogen as the reference. The microwave frequency was sampled by a Hewlett–Packard model 5340A frequency counter. Data manipulations were carried out using the program igorpro 2.04 (Wavemetrics, Lake Oswego, OR).
Peptide Microsequencing.
Purified CMO was subjected to SDS/PAGE and the Mr ≈ 45,000 band was blotted to polyvinylidene difluoride membrane. Tryptic peptides were generated by the procedure of Fernandez et al. (24) and purified by reverse-phase HPLC using an Aquapore RP-300 (C8, 2.1 × 220 mm) column developed with a trifluoroacetic acid–acetonitrile gradient. Isolated peptides were subjected to sequence analysis on an Applied Biosystems model 476A protein/peptide sequencer (Perkin–Elmer). The N-terminal sequence of the intact protein was determined on a sample further purified by reverse-phase HPLC.
cDNA Cloning.
Total RNA from salinized spinach leaves was extracted as described (25), except that a step to precipitate carbohydrates with 75 mM BaCl2 was added prior to LiCl precipitation. Poly(A)+ RNA was isolated using poly(U) Sephadex (26) and used to construct a cDNA library (9 × 10⁶ plaque-forming units) in λUniZap XR (Stratagene). A 532-bp DNA fragment was generated by reverse transcription–PCR with primers based on CMO peptides; the (+) and (−) primers were, respectively, 5′-CCIGARCARAAYYTNGAYCCIAARG-3′ and 5′-CCATCATRTTYTCYTCDATRTARTARTC-3′. The PCR (100 μl) contained 3 ng first-strand cDNA, 40 pmol of each primer, 200 μM each of all four dNTPs, 50 mM KCl, 1.5 mM MgCl2, 0.001% (wt/vol) gelatin, and 2.5 units of AmpliTaq DNA polymerase (Perkin–Elmer) in 10 mM Tris·HCl (pH 8.3). Forty cycles of 0.5 min each at 94°C and 30°C and 1 min at 50°C were carried out. The 532-bp fragment was isolated from low-melting agarose (27), and labeled with [α-32P]dCTP (>3 × 10⁹ cpm/μg) by the random primer method. Library screening and in vivo excision were according to the supplier’s protocols. Screening the amplified library (≈2 × 10⁵ plaques) with this probe yielded 18 clones of which the longest was 1,189 bp. The unamplified library (≈2 × 10⁵ plaques) was then screened with a 223-bp EcoRI fragment from the 5′ region of this clone. Of eight positive clones, two (pRS3 and pRS5) were sequenced in both strands using the fluorescent chain terminating dideoxynucleotides method (28). They were identical except that pRS5 lacked 150 bp at the 5′ end and had one base change in the 3′ noncoding region. Sequences were analyzed with the GCG sequence analysis package (29).
DNA and RNA Blot Analyses.
Genomic DNA was prepared from leaves as described (27). Total RNA was isolated from control and salinized leaves (30), denatured and subjected to electrophoresis in formaldehyde/1.2% agarose gels (27). RNA was quantified by the orcinol method (31). Blotting and hybridizations were performed using standard protocols (27). Molecular size markers were an RNA ladder (0.24–9.5 kb; GIBCO/BRL) for RNA blots, and HindIII-digested λ DNA fragments for DNA blots. DNA blots were probed with an 1151-bp AccI–EcoRV fragment of clone pRS3.
Antibody Production and Immunoblot Analysis.
Rabbit antibodies were raised against CMO purified by SDS/PAGE. Mouse antibodies were raised against CMO purified by reverse-phase HPLC on a Delta-Pak C18 column (3.9 × 150 mm; Waters) using acetonitrile/water as the mobile phase. To determine the effect of salinization, spinach leaf proteins were precipitated with PEG 8000 (17), separated by SDS/PAGE, and transferred to nitrocellulose (32). Prestained Mr markers (Bio-Rad) were run simultaneously. Blots were probed with a 1:500 dilution of rabbit serum (32). CMO was detected after native PAGE using a 1:500 dilution of mouse ascites fluid.
RESULTS
Subunit Composition of CMO.
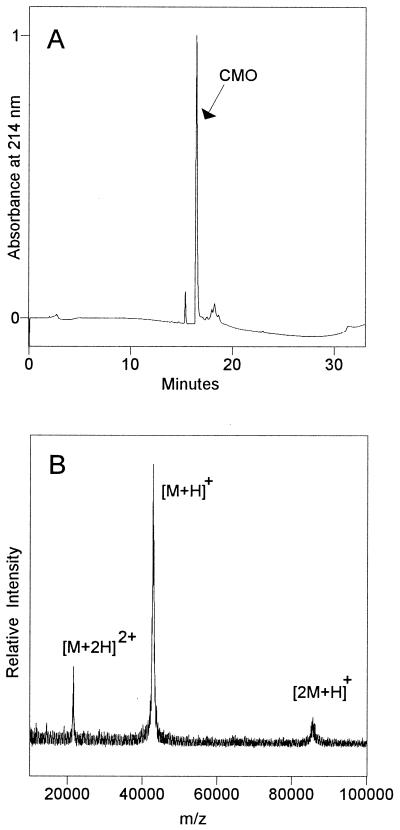
In previous work, the purest CMO preparations that still had enzyme activity contained one major polypeptide (Mr ≈ 45,000 by SDS/PAGE) and a few minor ones (17). To clarify whether the latter were contaminants or additional subunits, a highly purified, enzymatically active CMO preparation was fractionated by HPLC (Fig. 1A) and the CMO peak (identified by its immunoreactivity) and minor peaks were analyzed by MALDI-MS. The mass spectrum of the CMO peak showed a strong signal at m/z 42,864 ± 22 SD (n = 13 measurements); the symmetry of this signal suggested that just one polypeptide was present (Fig. 1B). The small peaks eluting at ≈17–19 min gave no MALDI-MS signals, suggesting that they were small-molecule contaminants. The peak eluting at ≈15 min gave a signal at m/z 11,698. However, the size of this peak relative to the CMO peak varied greatly between analyses of the same preparation (Fig. 1), making it unlikely to be a component of the CMO holoenzyme. Taken together, these data indicate that CMO has only one type of subunit. From this it follows that one gene is sufficient to encode an active CMO enzyme.
Figure 1.
Subunit composition of CMO and Mr of the monomer. (A) HPLC elution profile of a native CMO preparation (5.4 μg of protein). The cluster of small peaks eluting at ≈17–19 min contained no polypeptides detectable by MALDI-MS. Between analyses of the same preparation, the contaminant peak eluting at ≈15 min varied in size from <1% to 6% (shown here) of the CMO peak. (B) MALDI mass spectrum of the CMO peak from the HPLC separation above. The major signal corresponds to the singly protonated CMO monomer [M+H]+; other peaks are the singly charged CMO dimer [2M+H]+ and the doubly charged monomer [M+2H]2+. The spectrum is unsmoothed to maximize the detection of any heterogeneity.
Mr of Native CMO.
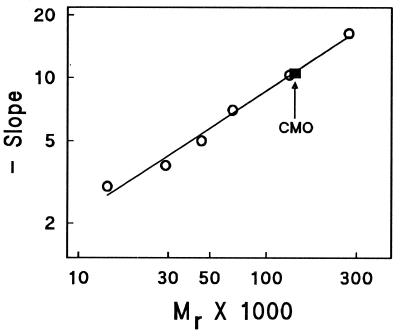
The Mr estimated from native PAGE for the CMO band was 135,000 (Fig. 2). A very similar value (Mr 133,000) was obtained from gel filtration on a tandem Superose 12–Superdex 200 column (not shown). These values are higher than the earlier estimate of Mr 98,000 from gel filtration on Ultrogel AcA 34 (16) and indicate that CMO may exist as a homotrimer rather than a homodimer. However, molecular shape and interactions with the media affect the mobility of proteins in gel electrophoresis and gel filtration chromatography so that none of these native Mr values is precise enough to distinguish with certainty between a trimer and a dimer.
Figure 2.
Estimation of the Mr of native CMO by nondenaturing PAGE. The standard proteins were α-lactalbumin (Mr 14,200), carbonic anhydrase (Mr 29,000), chicken egg albumin (Mr 45,000), bovine serum albumin monomer (Mr 66,000), dimer (Mr 132,000), and jack bean urease trimer (Mr 272,000). The coefficient of linear correlation for the regression line shown was 0.994. The interpolated Mr of CMO was 135,000.
Evidence for a Rieske-Type [2Fe-2S] Center.
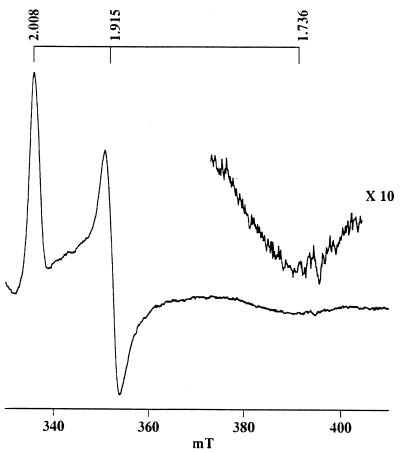
Definitive evidence for an Fe-S center was sought by EPR spectroscopy and by chemical assays of acid-labile sulfide and nonheme iron. In EPR studies, upon reduction by dithionite, a rhombic spectrum with apparent g values of 2.008, 1.915, and 1.736 was observed (Fig. 3). The narrow low field peak and broad high field trough resemble those reported for certain types of [2Fe-2S] cluster (33). The gavg (sum of g values/3) of this spectrum was 1.89, similar to that of many 2 His-, 2 Cys-liganded Rieske-type [2Fe-2S] clusters (33, 34). By contrast, [2Fe-2S] clusters liganded by 4 Cys residues typically have gavg = 1.94 (33, 34). The spectrum for CMO reached maximum intensity at 15 K, somewhat lower than is typical of Rieske-type clusters, but still within the expected range. Consistent with these data, CMO was found to contain approximately 2Fe and 2S per subunit (Table 1).
Figure 3.
EPR spectrum of CMO. Spectra of CMO reduced by sodium dithionite were acquired at 15 K with a microwave power of 20 mW and a modulation amplitude of 10 G. Apparent g values are indicated. The spectrum shown is the average of 16 measurements.
Table 1.
Nonheme iron and acid-labile sulfur content of CMO
| Analyte | nmol·ml−1 |
|---|---|
| CMO subunit | 57 (0.3) |
| FE | 105 (5.0) |
| S | 99 (6.0) |
Enzymatically active CMO was prepared as described (17). The reverse-phase HPLC elution profile (absorbance at 280 nm) of the preparation indicated that CMO was 51% of the total protein. This value, together with a Mr of 42,864 was used to calculate the molar concentration of CMO subunit. Values are means and SE (in parentheses) for three or four determinations.
cDNA Cloning.
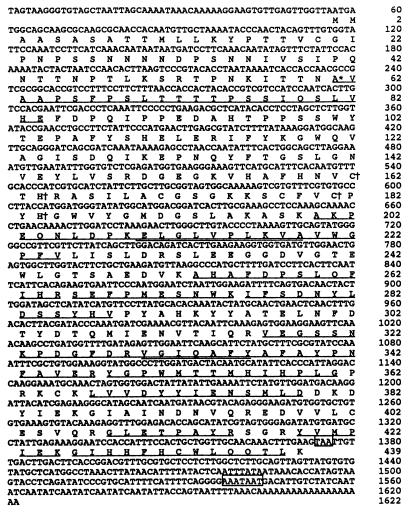
Amino acid sequences were obtained for the N terminus of CMO and for 12 tryptic peptides. Two internal sequences were used to design primers for reverse transcription–PCR, which gave a 532-bp DNA. Screening a library with this fragment yielded several truncated CMO cDNAs; the 5′ region from the longest of these was then used as a probe to isolate a full-length cDNA (Fig. 4). This cDNA (1622 bp) had 5′ and 3′ noncoding regions of 56 and 246 bp, respectively. A putative polyadenylylation signal (AAATAAT) preceded the poly(A) sequence by 58 bp. The ORF (1320 bp) encoded 440 amino acids that included a 60-residue transit peptide. As the ORF begins with two adjacent ATG codons, either could be the translational start. However, the sequences flanking the second ATG match the consensus translational initiation motif in plants (35). The coding region included all the amino acid sequences determined for purified CMO. The size and composition of the deduced transit peptide were typical for a chloroplast stromal targeting peptide (36), consistent with the stromal location of CMO (16). The predicted Mr of the processed polypeptide was 42,884. As this value differs from that obtained by MALDI-MS (Mr 42,864) by less than the experimental error of the method (≈0.1%) the CMO polypeptide can have very few if any posttranslational modifications.
Figure 4.
Nucleotide and deduced amino acid sequences of CMO cDNA clone pRS3. The amino acid sequences determined for tryptic peptides are underlined; overlaps between peptide sequences are underlined twice. The N terminus of the processed polypeptide is indicated with an asterisk. The Cys-His pairs conserved in Rieske-type iron-sulfur proteins are marked with daggers. The stop codon and putative polyadenylylation signal are boxed.
Primary Structure Comparisons.
No sequence in the data bases had significant homology with the entire CMO sequence so that no oxygenase of this kind is known to date. Rieske-type iron-sulfur proteins share a consensus sequence Cys-Xaa-His (15–17 amino acids) Cys-Xaa-Xaa-His, where Xaa = any amino acid. This motif, which is considered to be involved in binding the [2Fe-2S] cluster (34), was conserved in CMO (Fig. 4). This finding strongly supports the chemical and EPR data indicating that CMO has a [2Fe-2S] center. Between the Cys-His pairs, the CMO sequence had more residues in common with bacterial aromatic-ring dioxygenases than with other Rieske-type iron-sulfur proteins (37). Consistent with this, homologies in the region around the consensus sequence were somewhat stronger with these dioxygenases than with bacterial alkyl-group hydroxylases or Rieske iron-sulfur proteins of mitochondria and chloroplasts. Representative data for each of these families (38) are shown in Table 2.
Table 2.
Amino acid sequence homology between CMO and other proteins with Rieske-type iron-sulfur centers
| Sequence | Species | Size of region compared residues | Identity, % | Similarity, % |
|---|---|---|---|---|
| Naphthalene dioxygenase | Pseudomonas putida | 195 | 29.2 | 43.0 |
| Vanillate demethylase (hydroxylase component) | Pseudomonas sp. | 58 | 31.0 | 43.0 |
| Mitochondrial Rieske Fe-S protein | Zea mays | 72 | 29.2 | 36.1 |
The data shown are for representative members of the bacterial aromatic-ring dioxygenase and alkyl-group hydroxylase families (8) and of the Rieske protein family. The regions of homology that were compared included the conserved [2Fe-2S] cluster binding motif. Local homologies were first identified using blastp with nonredundant sequences in the National Center for Biotechnology Information (NCBI) database and individual entries were compared by fasta.
CMO Induction by Salinity.
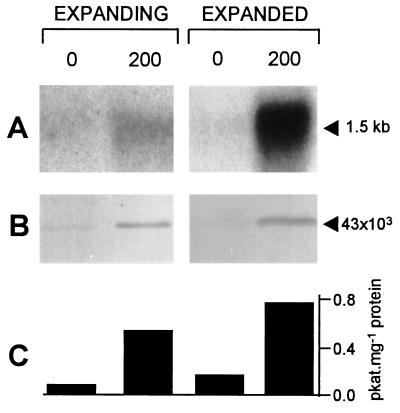
In unsalinized plants, CMO mRNA levels were low in both expanding and expanded leaves. Salinization increased these levels, especially in expanded leaves (Fig. 5A). CMO protein levels (Fig. 5B) and enzyme activity (Fig. 5C) broadly paralleled these changes. Most of the rise in CMO activity in salinized plants can therefore be ascribed to increased gene expression rather than to enzyme activation. The magnitude of the salt induction of CMO mRNA is comparable to that reported for BADH (8).
Figure 5.
CMO expression in expanding and expanded spinach leaves. Plants had been irrigated with nutrient solution (lane 0) or for 10 days before the experiment with nutrient solution containing 200 mM NaCl (lane 200). (A) RNA blot analysis. Lanes contained 5 μg of total RNA. The probe was a 532-bp DNA fragment [positions 660–1,191 of pRS3 (Fig. 4)]. Ethidium bromide staining demonstrated that all lanes contained equivalent amounts of RNA. Densitometry of autoradiographs indicated that salinization increased CMO mRNA levels 2-fold in expanding leaves and 7-fold in expanded leaves. (B) Immunoblot analysis. Lanes contained 40 μg of total leaf protein. Rabbit antibodies against SDS-denatured CMO were used for immunodetection. (C) Enzyme activity. CMO was assayed following precipitation of leaf proteins with PEG 8000 (17). Bars are means of three determinations; SE values were ≤16% of the means.
Analysis of Genomic DNA.
Following digestion of spinach genomic DNA with HindIII, EcoRV, or EcoRI, blot analysis revealed single bands of about 18, 9, and 3.7 kb, respectively (data not shown). This is consistent with there being one CMO gene containing a large intron(s). Reconstruction experiments also suggested a single copy of CMO per haploid genome (not shown).
DISCUSSION
Our results indicate that CMO is an oligomer of identical subunits, each of which has a Rieske-type [2Fe-2S] cluster—i.e., one that is liganded by two Cys and two His residues. The presence of this cluster, and the amino acid sequence of the protein, place CMO in a new class of plant oxygenases. Although without known relatives among plant oxygenases, CMO appears to be distantly related in structure to various bacterial oxygenases that, like CMO, require ferredoxin (or a ferredoxin-like domain in a larger protein) as electron donor (34). It is therefore reasonable to speculate that CMO is, in common with other nuclear-encoded chloroplastic enzymes (39), of prokaryotic origin.
The cDNA cloning of CMO and the finding that salt stress enhances CMO expression have implications for agriculture. As stated in the Introduction, it has been thought for some time that engineering the synthesis and accumulation of glycine betaine into crops naturally lacking it could improve their stress tolerance (40, 41). Although bacterial choline oxidases (3) or dehydrogenases (42) are being explored for this purpose, use of CMO (in conjunction with BADH) may be preferable for two reasons. First, the reduced ferredoxin requirement of CMO links glycine betaine synthesis with the light reactions of photosynthesis. This could help to match the supply of glycine betaine with the demand for osmotic adjustment and osmoprotection, which climbs rapidly after sunrise as the water potential and water content of salt- or drought-stressed leaves start falling (43). Second, the spinach CMO gene, like the BADH gene (8), presumably has stress-responsive cis regulatory elements. These may be essential to reproduce the natural pattern of stress-induced glycine betaine accumulation in engineered crops. It is now possible to isolate CMO genes and to begin identifying these elements.
Acknowledgments
This research was supported in part by U.S. Department of Agriculture National Research Initiative Competitive Grants Program Grant 95-37100-1596 (to A.D.H.), by National Science Foundation Grant MCB-92-05756 (to J.H.G.), and by an endowment from the C. V. Griffin, Sr. Foundation. Mass spectral data were acquired at the Michigan State University–National Institutes of Health Mass Spectrometry Facility, which is supported by National Institutes of Health Grant RR 00484. This is Florida Agricultural Experiment Station journal series no. R-05577.
ABBREVIATIONS
- CMO
choline monooxygenase
- BADH
betaine aldehyde dehydrogenase
- MALDI-MS
matrix-assisted laser desorption ionization mass spectrometry
Footnotes
References
- 1.Yancey P H. In: Cellular and Molecular Physiology of Cell Volume Regulation. Strange K, editor. Boca Raton, FL: CRC; 1994. pp. 81–109. [Google Scholar]
- 2.Gorham J. In: Amino acids and Their Derivatives in Higher Plants. Wallsgrove R M, editor. Cambridge, U.K.: Cambridge Univ. Press; 1995. pp. 173–203. [Google Scholar]
- 3.Rozwadowski K L, Khachatourians G G, Selvaraj G. J Bacteriol. 1991;173:472–478. doi: 10.1128/jb.173.2.472-478.1991. [DOI] [PMC free article] [PubMed] [Google Scholar]
- 4.Nomura M, Ishitani M, Takabe T, Rai A K, Takabe T. Plant Physiol. 1995;107:703–708. doi: 10.1104/pp.107.3.703. [DOI] [PMC free article] [PubMed] [Google Scholar]
- 5.Tarczynski M C, Jensen R G, Bohnert H J. Science. 1993;259:508–510. doi: 10.1126/science.259.5094.508. [DOI] [PubMed] [Google Scholar]
- 6.Kishor P B K, Hong Z, Miao G, Hu C, Verma D P S. Plant Physiol. 1995;108:1387–1394. doi: 10.1104/pp.108.4.1387. [DOI] [PMC free article] [PubMed] [Google Scholar]
- 7.Papageorgiou G C, Murata N. Photosynth Res. 1995;44:243–252. doi: 10.1007/BF00048597. [DOI] [PubMed] [Google Scholar]
- 8.Rhodes D, Hanson A D. Annu Rev Plant Physiol Plant Mol Biol. 1993;44:357–384. [Google Scholar]
- 9.McCue K F, Hanson A D. Plant Mol Biol. 1992;18:1–11. doi: 10.1007/BF00018451. [DOI] [PubMed] [Google Scholar]
- 10.Ishitani M, Nakamura T, Han S Y, Takabe T. Plant Mol Biol. 1995;27:307–315. doi: 10.1007/BF00020185. [DOI] [PubMed] [Google Scholar]
- 11.Rathinasabapathi B, McCue K F, Gage D A, Hanson A D. Planta. 1994;193:155–162. doi: 10.1007/BF00192524. [DOI] [PubMed] [Google Scholar]
- 12.Landfald B, Strom A R. J Bacteriol. 1986;165:849–855. doi: 10.1128/jb.165.3.849-855.1986. [DOI] [PMC free article] [PubMed] [Google Scholar]
- 13.Nagasawa T, Mori N, Tani Y, Ogata K. Agric Biol Chem. 1976;40:2077–2084. [Google Scholar]
- 14.Tsuge H, Nakano Y, Onishi H, Futamura Y, Ohashi K. Biochim Biophys Acta. 1980;614:274–284. doi: 10.1016/0005-2744(80)90217-x. [DOI] [PubMed] [Google Scholar]
- 15.Yamada H, Mori N, Tani Y. Agric Biol Chem. 1979;43:2173–2177. [Google Scholar]
- 16.Brouquisse R, Weigel P, Rhodes D, Yocum C F, Hanson A D. Plant Physiol. 1989;90:322–329. doi: 10.1104/pp.90.1.322. [DOI] [PMC free article] [PubMed] [Google Scholar]
- 17.Burnet M, Lafontaine P J, Hanson A D. Plant Physiol. 1995;108:581–588. doi: 10.1104/pp.108.2.581. [DOI] [PMC free article] [PubMed] [Google Scholar]
- 18.Atkin C L, Thelander L, Reichard P. J Biol Chem. 1973;248:7464–7472. [PubMed] [Google Scholar]
- 19.Beinert H. Anal Biochem. 1983;131:373–378. doi: 10.1016/0003-2697(83)90186-0. [DOI] [PubMed] [Google Scholar]
- 20.Smith P K, Krohn R I, Hermanson G T, Mallia A K, Gartner F H, Provenzano M D, Fujimoto E K, Goeke N M, Olson B J, Klenk D C. Anal Biochem. 1985;150:76–85. doi: 10.1016/0003-2697(85)90442-7. [DOI] [PubMed] [Google Scholar]
- 21.Hedrick J L, Smith A J. Arch Biochem Biophys. 1968;126:155–164. doi: 10.1016/0003-9861(68)90569-9. [DOI] [PubMed] [Google Scholar]
- 22.Suizdak G. Proc Natl Acad Sci USA. 1994;91:11290–11297. doi: 10.1073/pnas.91.24.11290. [DOI] [PMC free article] [PubMed] [Google Scholar]
- 23.Geisow N J. Trends Biotechnol. 1992;10:432–441. doi: 10.1016/0167-7799(92)90293-5. [DOI] [PubMed] [Google Scholar]
- 24.Fernandez J, Andrews L, Mische S M. In: Techniques in Protein Chemistry. 5th Ed. Crabb J W, editor. New York: Academic; 1994. pp. 215–222. [Google Scholar]
- 25.Hall T C, Ma Y, Buchbinder B U, Pyne J W, Sun S M, Bliss F A. Proc Natl Acad Sci USA. 1978;75:3196–3200. doi: 10.1073/pnas.75.7.3196. [DOI] [PMC free article] [PubMed] [Google Scholar]
- 26.Hondred D, Wadle D-W, Titus D E, Becker W M. Plant Mol Biol. 1987;9:259–275. doi: 10.1007/BF00166462. [DOI] [PubMed] [Google Scholar]
- 27.Ausubel F M, Brent R, Kingston R E, Moore D D, Seidman J G, Smith J A, Struhl K, editors. Current Protocols in Molecular Biology. New York: Wiley; 1995. Vols. 1–3. [Google Scholar]
- 28.Prober J M, Trainor G L, Dam R J, Hobbs F W, Robertson C W, Zagursky R J, Cocuzza A J, Jensen M A, Baumeister K. Science. 1987;238:336–341. doi: 10.1126/science.2443975. [DOI] [PubMed] [Google Scholar]
- 29.Devereux J R. GCG Sequence Analysis Software Package. Madison, WI: Genetics Computer Group; 1994. Version 8.0. [Google Scholar]
- 30.Puissant C, Houdebine L-M. BioTechniques. 1990;8:148–149. [PubMed] [Google Scholar]
- 31.Dawson R M C, Elliott D C, Elliott W H, Jones K M. Data for Biochemical Research. 3rd Ed. Oxford: Clarendon; 1986. pp. 543–544. [Google Scholar]
- 32.Tokuhisa J G, Daniels S M, Quail P H. Planta. 1985;164:321–332. doi: 10.1007/BF00402943. [DOI] [PubMed] [Google Scholar]
- 33.Johnson M K. In: Encyclopedia of Inorganic Chemistry. King R B, editor. Vol. 4. New York: Wiley; 1994. pp. 1896–1915. [Google Scholar]
- 34.Mason J R, Cammack R. Annu Rev Microbiol. 1992;46:277–305. doi: 10.1146/annurev.mi.46.100192.001425. [DOI] [PubMed] [Google Scholar]
- 35.Joshi C P. Nucleic Acids Res. 1987;15:6643–6653. doi: 10.1093/nar/15.16.6643. [DOI] [PMC free article] [PubMed] [Google Scholar]
- 36.Cline K, Henry R. Annu Rev Cell Dev Biol. 1996;12:1–26. doi: 10.1146/annurev.cellbio.12.1.1. [DOI] [PubMed] [Google Scholar]
- 37.Neidle E L, Hartnett C, Ornston L N, Bairoch A, Rekik M, Harayama S. J Bacteriol. 1991;173:5385–5395. doi: 10.1128/jb.173.17.5385-5395.1991. [DOI] [PMC free article] [PubMed] [Google Scholar]
- 38.Harayama S, Kok M, Neidle E L. Annu Rev Microbiol. 1992;46:565–601. doi: 10.1146/annurev.mi.46.100192.003025. [DOI] [PubMed] [Google Scholar]
- 39.Brinkmann H, Martin W. Plant Mol Biol. 1995;30:65–75. doi: 10.1007/BF00017803. [DOI] [PubMed] [Google Scholar]
- 40.LeRudulier D, Strom A R, Dandekar A M, Smith L T, Valentine R C. Science. 1984;224:1064–1068. doi: 10.1126/science.224.4653.1064. [DOI] [PubMed] [Google Scholar]
- 41.McCue K F, Hanson A D. Trends Biotechnol. 1990;8:358–362. [Google Scholar]
- 42.Lilius G, Holmberg N, Bulow L. Bio/Technology. 1996;14:177–180. [Google Scholar]
- 43.Hanson A D, Hitz W D. Annu Rev Plant Physiol. 1982;33:163–203. [Google Scholar]


