Abstract
Response data were collected for a carbon black-polymer composite electronic nose array during exposure to homologous series of alkanes and alcohols. The mean response intensity of the electronic nose detectors and the response intensity of the most strongly driven set of electronic nose detectors were essentially constant for members of a chemically homologous odorant series when the concentration of each odorant in the gas phase was maintained at a constant fraction of the odorant’s vapor pressure. A similar trend is observed in human odor detection threshold values for these same homologous series of odorants. Because the thermodynamic activity of an odorant at equilibrium in a sorbent phase is equal to the partial pressure of the odorant in the gas phase divided by the vapor pressure of the odorant and because the activity coefficients are similar within these homologous series of odorants for sorption of the vapors into specific polymer films, the data imply that the trends in detector response can be understood based on the thermodynamic tendency to establish a relatively constant concentration of sorbed odorant into each of the polymeric films of the electronic nose at a constant fraction of the odorant’s vapor pressure. Similarly, the data are consistent with the hypothesis that the odor detection thresholds observed in human psychophysical experiments for the odorants studied herein are driven predominantly by the similarity in odorant concentrations sorbed into the olfactory epithelium at a constant fraction of the odorant’s vapor pressure.
Keywords: carbon black composites, olfaction, vapor sensor, odor threshold
Numerous attempts have been made to understand the trends in odor detection thresholds that are displayed by the human olfactory sense. High odor detection thresholds are observed for most odorants that are gases under standard pressure and temperature conditions, whereas odorants with low vapor pressures generally have low odor detection thresholds (1). Quantitative structure–activity relationships have been formulated in an attempt to correlate trends in olfactory odor intensity with specific microscopic and macroscopic properties of various odorants. For example, many workers have proposed that trends in odor detection thresholds arise from the presence of important steric and functional group features in certain olfactory receptors (2, 3). Such receptors could then primarily respond to chemically specific features such as odorant molecular length and polarity (3–6). Other workers have empirically correlated trends in human odor detection thresholds with macroscopic properties of the odorant, such as the boiling point of the liquid phase of the odorant species (7–9). Some workers have noted the correlation between odor thresholds and the vapor pressure of the odorant (10–14).
In this work, we have measured the response intensities of an electronic nose (15), based on an array of carbon black-polymer composite detectors, to straight chain alkanes and alcohols. We propose a fundamental first-order explanation for the observed trends in response intensity of the detectors in the electronic nose, based on the thermodynamic tendency for odorants to partition into sorbent phases as a function of the odorant’s vapor pressure. A striking resemblance has been observed in the odor intensity trends for the human and electronic olfactory systems for these series of odorants. This similarity in odor intensity behavior occurs even though the detectors in the electronic nose array have no specific receptor sites and even though the electronic nose array is not a structural model for the human olfactory system.
MATERIALS AND METHODS
The electronic nose is an array of vapor detectors, with each detector consisting of a dispersion of carbon black particles in a swellable insulating organic polymer film. Swelling of each carbon black-polymer composite in response to the presence of an odorant produces a change in the electrical resistance of the detector film. The pattern of responses produced by an array of chemically different carbon black-polymer composites identifies the odorant, and the pattern height is correlated with the odorant concentration. The resistance change of a detector is reversible, is linear over at least an order of magnitude of odorant concentration, and is quite reproducible (15). The detectors were fabricated, and their characteristics were measured, as described (15), except that for convenience surface mount universal boards (surfboards, part 6012 from Capital Advanced Technologies, Carol Stream, IL) were used as a substrate for the composites rather than modified glass slides or capacitors. For simplicity, during this study the partial pressures of the odorants were fixed at a constant fraction of their vapor pressures at 22°C. Vapor pressure values were calculated by using accepted formulas as described (16).
RESULTS
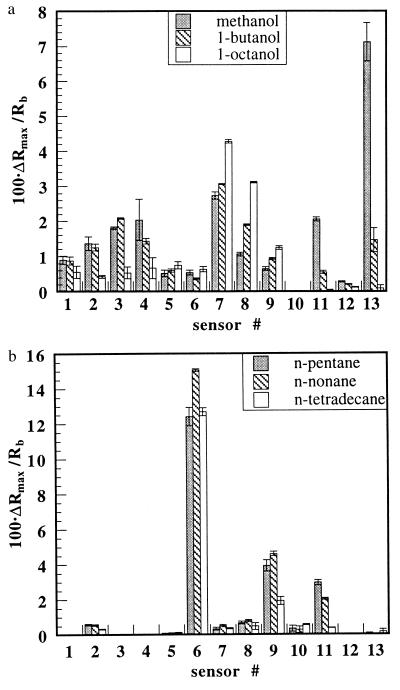
Straight-chain alcohols and straight-chain alkanes were investigated because they define two homologous series of odorants that vary regularly in their chemical properties as the carbon chain length is increased and because human psychophysical data on odor detection thresholds are available for these odorants (1). Fig. 1 displays the responses, ΔRmax/Rb, where Rb is the baseline resistance of the detector immediately before the exposure and ΔRmax is the amplitude of the maximum resistance change during the 5 min the detector was exposed to the odorant, for an array of carbon black-polymer composite detectors exposed to methanol, 1-butanol, 1-octanol, n-pentane, n-nonane, and n-tetradecane at partial pressures, P, corresponding to 10% of the vapor pressure of the odorant, Po. The different response patterns across the array of detectors correspond to differences in odor quality data produced by the electronic nose, whereas the signal intensities correspond to differences in odor intensity that are obtained from the raw unprocessed signals of the detectors.
Figure 1.
Histograms showing the response patterns of a 13-detector array of carbon black-polymer detectors exposed in air to methanol at 11 torr, 1-butanol at 0.57 torr, and 1-octanol at 5.8 × 10⁻³ torr (a) and n-pentane at 46 torr, n-nonane at 0.37 torr, and n-tetradecane at 8.5 × 10⁻⁴ torr (b). The odorant partial pressures correspond to 10% of their vapor pressures in ambient air. Each histogram bar represents the average of more than six exposures of a single detector to a single odorant for 5 min. The error bars represent one SD in each sensor’s responses. The polymers in detectors 1–13 were poly(4-vinyl phenol), poly(α-methyl styrene), poly(vinyl acetate), poly(sulfone), poly(caprolactone), poly(ethylene-co-vinyl acetate) (82% ethylene), poly(ethylene oxide), poly(ethylene), poly(butadiene), poly(vinylidene fluoride), poly(n-butyl methacrylate), poly(epichlorohydrin), and poly(ethylene glycol).
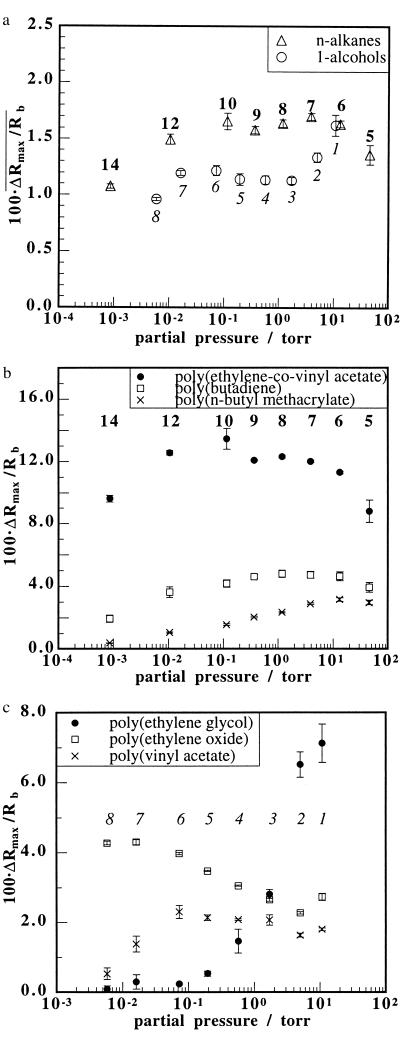
A striking feature of the electronic nose data is that, when the mean signal intensity, defined as the mean value of ΔRmax/Rb that was observed for all 13 detectors in the array on exposure to an odorant, is plotted vs. the partial pressure of odorant present in the vapor phase, the electronic nose exhibits increased sensitivity (i.e., a similar response intensity to a lesser odorant concentration) to lower vapor pressure alkanes and alcohols (Fig. 2a). The 13 polymers in the array of detectors [poly(4-vinyl phenol), poly(α-methyl styrene), poly(vinyl acetate), poly(sulfone), poly(caprolactone), poly(ethylene-co-vinyl acetate) (82% ethylene), poly(ethylene oxide), poly(ethylene), poly(butadiene), poly(vinylidene fluoride), poly(n-butyl methacrylate), poly(epichlorohydrin), and poly(ethylene glycol)] were chosen to include a broad range of chemical properties, thereby minimizing biases that would result from averaging the responses over sets of detectors that had a limited chemical diversity.
Figure 2.
(a) Mean signal intensity, defined as the average over all 13 detector responses in the electronic nose array to an odorant, plotted vs. the partial pressures of homologous series of alkane and alcohol odorants. (b) Responses, ΔRmax/Rb, of three individual electronic nose detectors [poly(ethylene-co-vinyl acetate), poly(butadiene), and poly(n-butyl methacrylate)] that produced the largest responses to a homologous series of straight chain alkanes, plotted vs. the partial pressures of the odorants in each series. (c) Responses of three individual detectors [poly(ethylene glycol), poly(ethylene oxide), and poly(vinyl acetate)] that produced the largest responses to a straight chain homologous series of 1-alcohols, plotted vs. the partial pressures of the odorants in each series. The alkanes used in a and b were n-pentane, n-hexane, n-heptane, n-octane, n-nonane, n-decane, n-dodecane, and n-tetradecane. The straight chain alcohols used in a and c were methanol, ethanol, 1-propanol, 1-butanol, 1-pentanol, 1-hexanol, 1-heptanol, and 1-octanol. Each odorant was maintained at a partial pressure equivalent to 10% of its vapor pressure, and the background was ambient air. For clarity, the number of carbons in each odorant is indicated for each data point, in italic type for the alcohols and in nonitalic type for the alkanes. The error bars represent one SD unit in the responses to six exposures of each odorant.
A better analogy to detection of an odorant at the human odor detection threshold, at which the presence of an odor can be identified as compared with a moist air blank, but the quality of the odor cannot be determined, might be obtained by plotting the trends in response intensity for the most strongly driven detectors in the electronic nose toward the series of odorants studied in this work. Such data are displayed in Fig. 2 b and c for the alkanes and alcohols, respectively. These data confirm the trend observed in Fig. 2a and show that the response intensity of an individual detector is essentially independent of the odorant in the series, if the odorant is present in the gas phase at a constant fraction of its vapor pressure. Thus, the electronic nose detectors produced nearly the same odor intensity from their raw signal outputs for P = 0.1Po of pentane (P = 46 torr in 707 torr of air = 61 parts per thousand; 1 torr = 133.3 Pa) as they did for P = 0.1Po of tetradecane (P = 8.5 × 10⁻⁴ torr in 707 torr air = 1.1 parts per million).
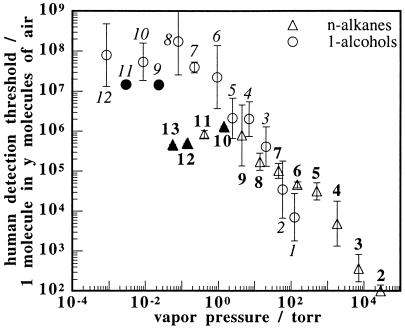
Fig. 3 displays human odor detection thresholds, obtained as mean values from several published sets of psychophysical data, for the 1-alcohol and n-alkane homologous series of odorants (1). As was observed for the electronic nose signals, these mean human olfactory odor detection thresholds, when based on odorant partial pressure, increase as the vapor pressure of the odorant increases. However, when the data are referenced to the fraction of the room temperature vapor pressure of each odorant, the mean literature detection thresholds are essentially constant across this vapor pressure range for the various odorants in the series. At vapor pressures below approximately 1 torr the thresholds appear to plateau. This could be the result of difficulties in delivering equilibrium concentrations of low vapor pressure odorants to the human sensory panels (17) or the result of steric inhibition as odorants become large relative to olfactory receptor binding sites (18).
Figure 3.
Plot of human olfactory detection thresholds versus the vapor pressure (at 25°C) of a homologous series of straight chain alkanes, ranging from ethane to tridecane, and of 1-alcohols ranging from methanol to dodecanol. For clarity, number of carbons in each odorant is indicated next to the corresponding data point, in italic type for the alcohols and nonitalic type for the alkanes. An average human can detect one odorant molecule in the number of air molecules plotted on the ordinate. The error bars represent one SD unit in the standardized results reported by at least two, and up to 20, authors (1). A solid data point is used if only one author reported results. A best straight line fit through the alcohols from methanol to octanol gives a slope of −1.3 ± 0.1 and an r2 value of 0.96. Similarly, a best straight line fit through the alkanes from ethane through decane gives a slope of −0.94 ± 0.08 and an r2 value of 0.96.
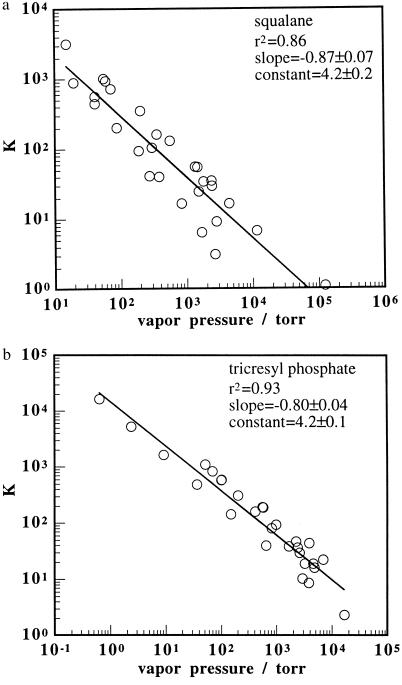
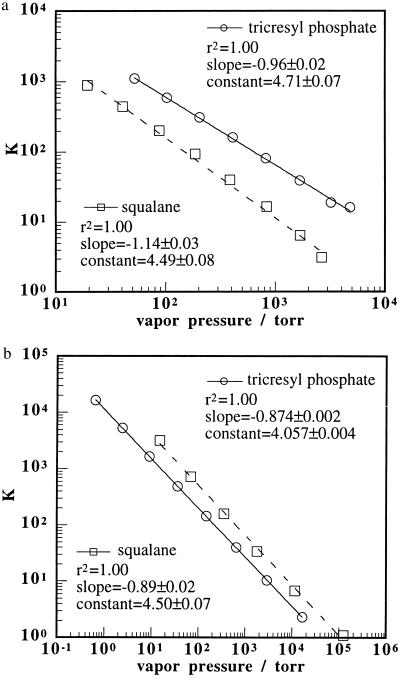
The trends displayed in Figs. 2 and 3 were also observed in an analysis of gas chromatography data. Retention volumes (19) for odorants with a wide range of vapor pressures were converted into gas/support partition coefficients (20), K, and the data were collated for two selected stationary phases, one polar (tricresyl phosphate) and one nonpolar (squalane) in character. The values of log K for each odorant into each sorbent phase were then regressed against log Po for every odorant in the data set. As displayed in Fig. 4, the regressions yielded straight lines with slopes of −0.87 ± 0.07 and −0.80 ± 0.04 and r2 values of 0.86 and 0.93, respectively. Taking a cut through the sample set to leave only odorants in either the alkane or alcohol homologous series yielded a much better fit to a straight line dependence of log K on log Po. Slopes were approximately −1.0 and r2 values were 1.0 for both the alcohol and alkane homologous series (Fig. 5). This reduction in variance is expected because the variation in chemically based gas/support partition coefficients that contribute to the variance in the entire data set is reduced when only partition coefficients for a series of homologous odorants are considered. The activity coefficients at infinite dilution for these series of alcohols and alkanes in the two stationary phases are presented in Table 1 (19). It is apparent that the activity coefficients for members of each homologous series are relatively similar relative to the variation in vapor pressures, which spans many orders of magnitude, for each series of odorants.
Figure 4.
Plots of the partition coefficients, K, for odorants sorbing into the stationary phases with squalane at 100°C (a) and tricresyl phosphate at 120°C (b), obtained from gas chromatography data (19), vs. odorant vapor pressure. The odorants plotted in both plots are methanol, ethanol, acetone, dichloromethane, 1-propanol, ethyl acetate, 2,3-dimethylbutane, n-hexane, chloroform, 1-butanol, 2-chloroethanol, tetrachloromethane, benzene, 1-pentanol, cyclopentanone, toluene, n-octane, 1-hexanol, 1-heptanol, 2-octanol, n-decane, n-butane, 1-octanol, and n-dodecane. Additional odorants plotted only in a are ethane, m-diethylbenzene, o-diethylbenzene, and o-xylene. Additional odorants plotted only in b are ethylene glycol diacetate, n-hexadecane, n-tetradecane, and n-octadecane. The solid lines represent the best line fits through the data points, with the fitting parameters given in the figures.
Figure 5.
Plots of the partition coefficient, K, vs. the vapor pressure of homologous series of 1-alcohols (a) and n-alkanes (b) on the squalane stationary phase at 100°C and the tricresyl phosphate stationary phase at 120°C. The series of alcohols plotted in a ranged from methanol to 1-octanol inclusively. The series of alkanes plotted in b consisted of even carbon n-alkanes ranging from ethane to n-dodecane inclusively on the squalane stationary phase and n-butane to n-octadecane inclusively on the tricresyl phosphate stationary phase. The lines indicate the best linear fits and the fitting parameters are given in the figures.
Table 1.
Activity coefficients for infinitely dilute straight chain alkanes and 1-alcohols in specific gas chromatography stationary phases
| Odorant | Squalane | Tricresyl phosphate | Poly(vinyl acetate) | Poly(ethylene oxide) | Poly(ethylene glycol) |
|---|---|---|---|---|---|
| Ethane | 0.33 | ||||
| Butane | 0.58 | 2.0 | 6.1 | ||
| Pentane | 2.1 | ||||
| Hexane | 0.73 | 2.6 | 0.030 | 2.6 | 12 |
| Heptane | 0.040 | 3.3 | |||
| Octane | 0.80 | 2.9 | 0.050 | 4.1 | 18 |
| Nonane | 0.082 | 5.2 | |||
| Decane | 0.88 | 3.6 | 0.095 | 6.5 | 27 |
| Unedecane | 0.12 | 8.0 | |||
| Dodecane | 0.93 | 4.3 | 0.15 | 8.8 | 42 |
| Tetradecane | 5.1 | 0.23 | 66 | ||
| Hexadecane | 6.0 | 0.34 | 83 | ||
| Octadecane | 7.3 | 124 | |||
| Methanol | 5.4 | 1.0 | 0.0049 | 0.63 | |
| Ethanol | 4.1 | 1.3 | 0.0058 | 0.31 | 0.81 |
| Propanol | 3.2 | 1.2 | 0.0081 | 0.29 | 0.93 |
| Butanol | 2.9 | 1.2 | 0.0093 | 0.41 | 1.1 |
| Pentanol | 2.5 | 1.2 | 0.011 | 1.2 | |
| Hexanol | 2.5 | 1.2 | 0.013 | 1.5 | |
| Heptanol | 2.5 | 1.3 | 0.015 | 1.8 | |
| Octanol | 2.6 | 1.3 | 0.018 | 2.2 | |
| Decanol | 0.026 |
Squalane, temperature = 373 K and molecular weight = 422.8 g/mol; tricresyl phosphate, temperature = 393 K and molecular weight = 368.4 g/mol; poly(vinyl acetate), temperature = 417 K and molecular weight ≈ 500,000 g/mol; poly(ethylene oxide), temperature = 352 K and molecular weight ≈ 1,000 g/mol; poly(ethylene glycol), temperature = 373 K and molecular weight ≈ 300 g/mol.
Activity coefficient data were also culled from the literature (19, 21) for some of the specific polymers in the electronic nose detectors. Data for poly(vinyl acetate), poly(ethylene oxide), and poly(ethylene glycol) are presented in Table 1. The activity coefficients at infinite dilution for the odorants within either the alcohol or alkane series, sorbed into these specific polymers, are clearly similar relative to the large variation in their vapor pressures.
DISCUSSION
The polymer-based electronic nose exhibits a characteristic displayed by the human olfactory system in that it discriminates against ambient background gases in air, such as O2, N2, and CO2, and is more sensitive, based on the partial pressure of odorant in the gas phase, to odorants with lower vapor pressures (Figs. 2 and 3). A similar trend has also been noted previously in a qualitative study of the response of a different polypyrrole-based electronic nose detector array to fixed partial pressures of methanol, ethanol, 1-propanol, 1-butanol, and 1-pentanol, but no explanation was advanced for the origin of the variation in mean signal response of this system (22).
The primary trends observed in Figs. 2, 4, and 5 can be explained by using simple thermodynamic principles. At equilibrium, the chemical potential, μ, of an odorant must be equal in both the sorbed and vapor phases (23). The equilibrium mole fraction χ of the odorant in the sorbed phase is, therefore, related to the fraction of the vapor pressure of the odorant and to the chemical potential, by the relationships (23):
 |
1 |
and
 |
2 |
where μo is the chemical potential of the odorant in its saturated vapor standard state, R is the gas constant, T is the temperature, γ is the odorant activity coefficient, and a is the odorant activity. If the activity coefficients, which account for the specific solvation interactions between the sorbent phase and the odorant molecules, are similar for odorants within a homologous series being sorbed into a given polymer, then the concentration of any member of the homologous odorant series sorbed into a specific polymer will be primarily determined by the fraction of the vapor pressure of the odorant in the gas phase, as opposed to being determined primarily by the absolute concentration of the odorant in the vapor phase.
This situation is consistent with observed response trends of the electronic nose detectors to the homologous series of alkane and alcohol odorants. The data in Table 1 suggest that the variation in the activity coefficients, within our two homologous series of odorants sorbing into the polymers used the electronic nose, is small relative to the variation in the vapor pressures across the homologous series. The data thus indicate that the relative changes in the signals produced by the polymer composite detectors in response to exposures to members of each homologous series of odorants studied herein are, to first order, independent of specific binding features of the odorant into the polymer phase and instead depend primarily on the equilibrium concentration of the odorant that is attained in the polymeric detector material. In other words, conceptually dividing the events leading to the production of an electronic nose output signal into three components: (i) sorption of the odorant into the polymeric detector material, (ii) binding of the dissolved odorant molecule to specific signal transduction sites, and (iii) molecularly specific amplification events of the signals during the output stage, the data show that processes ii and iii are essentially constant for the electronic nose detector responses to odorants in the two homologous series that have been studied in this work.
As displayed in Fig. 3, the mean human olfactory detection thresholds for both series of odorants show behavior that is similar to that of the electronic nose. The human data are thus consistent with the suggestion that the trends in olfactory detection thresholds for these odorants are dictated primarily by a physical sorption effect (12). Deviations from this behavior would then be taken to indicate variations in chemical interactions between odorants and the olfactory receptors. Of course, isolation of one thermodynamically based factor is difficult for the human olfactory system, in which equilibrium partitioning of the odorants in the various phases of concern may not be reached during olfaction and for which the perception of an odorant depends not only on the response of the detectors in the olfactory bulb but also on the processing of the signals in the brain. Nevertheless, the comparison between the human and electronic nose response data is consistent with a common sorption-based effect dominating the odor intensity trends for the series of odorants studied herein.
We chose two series of odorants in this work for which we hypothesize that relatively little evolutionary pressure has been exerted on humans to develop enhanced olfactory sensitivity relative to that expected from the thermodynamically based vapor pressure trend. The correlation of vapor pressure with odor detection threshold displayed in Fig. 3 for the human nose would be expected to break down for hydrogen sulfide, alkylamines, and other odorants that either are related to decaying food or that are toxic gases that have been present for evolutionarily significant time periods in the atmosphere. An examination of human olfactory threshold data confirms this hypothesis, because the trend of decreasing odor intensity thresholds for odorants with lower vapor pressures is not observed for alkylamines or alkylthiols, toward which humans exhibit much increased olfactory sensitivity as compared with the alkanes or alcohols that have the same vapor pressure (1). Additionally, recent studies by Zhao et al. (24) indicate that an individual olfactory receptor type has significantly more specificity to odorant chain length than do the detectors in the polymer-based electronic nose (24), again indicating the differences for certain odorants that are likely to be observed between the response of the electronic nose and that of the mammalian olfactory system.
At a given odorant activity in the polymeric films (or in the epithelium for the human olfactory system), there must, of course, be some variation in sorbed odorant concentration, and in the resulting signal response, for different polymer (receptor) types, otherwise it would be impossible to obtain odor quality information from the output of an array of sensing elements. In the electronic nose, differential sorption of odorants, with various activity coefficients, into the various polymers produces a differential swelling and, therefore, produces the differential ΔRmax/Rb output pattern of signals that can be used to identify odorants (Fig. 1). Similarly, from the gas chromatographic partition coefficient data of Fig. 5, it is clear that the alcohols sorb preferentially into the polar support (tricresyl phosphate) over the nonpolar support (squalane) but that the alkanes exhibit the opposite trend and sorb preferentially into the nonpolar support relative to the polar support. These differences in signal intensity are clearly caused by specific chemical interactions between the odorant and polymer molecules, as reflected in the variation in activity coefficients that act in conjunction with the sorption effects expected for an ideal sorbent/solute system to determine the response of an individual detector in the array to the odorant of concern. The data presented herein clearly show, however, that for the odorants studied in this work, the response intensity of the electronic nose detectors is determined, to first order, by the thermodynamic activity effects that dictate the concentration of odorant in the film, whereas the (smaller) deviations from the mean response intensity exhibited by the various individual detectors produce the outputs that can be used to extract odor quality information from the array. Interestingly, in the electronic nose, it is clear that a fixed, and relatively constant, collection of detectors is being fired in response to the various members of a homologous series of odorants. However, the present experiments yield no information on whether the response of the human system at odor detection threshold is produced by the same or by a significantly different collection of receptors as the identity of the odorant is varied.
Acknowledgments
We acknowledge Prof. J. Bower and C. Chee-Ruiter of Caltech for numerous helpful discussions and for their critical comments on this manuscript. We thank the National Aeronautics and Space Administration, the Army Research Office, and the Defense Advanced Research Projects Agency for their support of this work, and B.D. acknowledges the Government of Canada for a Natural Sciences and Engineering Research Council 1967 Centennial Graduate Fellowship.
References
- 1.Devos M, Patte F, Rouault J, Laffort P, Van Gemert L J. Standardized Human Olfactory Thresholds. New York: Oxford Univ. Press; 1990. [Google Scholar]
- 2.Ohloff G. Scent and Fragrances, the Fashion of Odors and Their Chemical Perspectives. New York: Springer; 1994. [Google Scholar]
- 3.Amoore J E. Molecular Basis of Odour. Springfield, IL: Thomas; 1970. [Google Scholar]
- 4.Dravnieks A. Flavor Quality: Objective Measurement. Washington, DC: Am. Chem. Soc.; 1977. pp. 11–28. [Google Scholar]
- 5.Edwards P A, Jurs P C. Chem Senses. 1989;14:281–291. [Google Scholar]
- 6.Edwards P A, Anker L S, Jurs P C. Chem Senses. 1991;16:447–465. [Google Scholar]
- 7.Abraham M H. In: Indoor Air and Human Health. Gammage R B, Berven B A, editors. Boca Raton, FL: CRC; 1996. pp. 67–91. [Google Scholar]
- 8.Greenberg M J. Odor Quality and Chemical Structure. Washington, DC: Am. Chem. Soc.; 1981. pp. 177–194. [Google Scholar]
- 9.Laffort P, Patte F, Etcheto M. Ann NY Acad Sci. 1974;237:192–208. doi: 10.1111/j.1749-6632.1974.tb49854.x. [DOI] [PubMed] [Google Scholar]
- 10.Moulton D G, Eayrs J T. Q J Exp Psychol. 1960;12:99–109. [Google Scholar]
- 11.Cometto-Muñiz J E, Cain W S. Indoor Air. 1994;4:140–145. doi: 10.1111/j.1600-0668.2004.00297.x. [DOI] [PubMed] [Google Scholar]
- 12.Cometto-Muñiz J E, Cain W S. Physiol Behav. 1990;48:719–725. doi: 10.1016/0031-9384(90)90217-r. [DOI] [PubMed] [Google Scholar]
- 13.Mullins L J. Ann NY Acad Sci. 1955;62:247–276. [Google Scholar]
- 14.Ottonson D. Acta Physiol Scand. 1958;43:167–181. doi: 10.1111/j.1748-1716.1958.tb01585.x. [DOI] [PubMed] [Google Scholar]
- 15.Lonergan M C, Severin E J, Doleman B J, Beaber S A, Grubbs R H, Lewis N S. Chem Mater. 1996;8:2298–2312. [Google Scholar]
- 16.Yaws C L, Lin X, Bu L. Handbook of Vapor Pressure. London: Gulf; 1994. [Google Scholar]
- 17.Punter P H. Chem Senses. 1983;7:215–235. [Google Scholar]
- 18.Franks N P, Lieb W R. Nature (London) 1985;316:349–351. doi: 10.1038/316349a0. [DOI] [PubMed] [Google Scholar]
- 19.McReynolds W O. Gas Chromatographic Retention Data. Evanston, IL: Preston Technical Abstracts; 1966. [Google Scholar]
- 20.Littlewood A B. Gas Chromatography. New York: Academic; 1962. [Google Scholar]
- 21.Hao W, Elbro H S, Alessi P. Polymer Solution Data Collection. Frankfurt: Deutsche Gesellschaft für Chemisches Apparatewesen; 1992. [Google Scholar]
- 22.Hatfield J V, Neaves P, Hicks P J, Persaud K, Travers P. Sens Actuators B. 1994;18:221–228. [Google Scholar]
- 23.Schwarzenbach R P, Gschwend P M, Imboden D M. Environmental Organic Chemistry. New York: Wiley; 1993. pp. 42–51. [Google Scholar]
- 24.Zhao H Q, Ivic L, Otaki J M, Hashimoto M, Mikoshiba K, Firestein S. Science. 1998;279:237–242. doi: 10.1126/science.279.5348.237. [DOI] [PubMed] [Google Scholar]


