

Abstract
Ketamine is widely used as an anesthetic in a variety of drug combinations in human and veterinary medicine. Recently, it gained new interest for use in long-term pain therapy administered in sub-anesthetic doses in humans and animals. The purpose of this study was to develop a physiologically based pharmacokinetic (PBPk) model for ketamine in ponies and to investigate the effect of low-dose ketamine infusion on the amplitude and the duration of the nociceptive withdrawal reflex (NWR).
A target-controlled infusion (TCI) of ketamine with a target plasma level of 1 μg/ml S-ketamine over 120 min under isoflurane anesthesia was performed in Shetland ponies. A quantitative electromyographic assessment of the NWR was done before, during and after the TCI. Plasma levels of R-/S-ketamine and R-/S-norketamine were determined by enantioselective capillary electrophoresis. These data and two additional data sets from bolus studies were used to build a PBPk model for ketamine in ponies.
The peak-to-peak amplitude and the duration of the NWR decreased significantly during TCI and returned slowly toward baseline values after the end of TCI. The PBPk model provides reliable prediction of plasma and tissue levels of R- and S-ketamine and R- and S-norketamine. Furthermore, biotransformation of ketamine takes place in the liver and in the lung via first-pass metabolism. Plasma concentrations of S-norketamine were higher compared to R-norketamine during TCI at all time points. Analysis of the data suggested identical biotransformation rates from the parent compounds to the principle metabolites (R- and S-norketamine) but different downstream metabolism to further metabolites. The PBPk model can provide predictions of R- and S-ketamine and norketamine concentrations in other clinical settings (e.g. horses).
Keywords: Physiologically based pharmacokinetic (PBPk) model, Ketamine, Norketamine, Nociceptive withdrawal reflex (NWR), Enantioselective metabolism, Target-controlled infusion (TCI)
Introduction
Ketamine, a non-competitive antagonist of the N-methyld-aspartate (NMDA) receptor, has been used as anesthetic in humans for over 30 years. The racemic compound consists of two optical isomers: R- and S-ketamine. Major characteristics of the pure S-enantiomer are its fourfold greater affinity for NMDA receptors in comparison to R-ketamine (Oye et al., 1992). S-ketamine's analgesic potency has been reported to be approximately two times greater than that of racemic ketamine (Arendt-Nielsen et al., 1996) and four times greater than that of R-ketamine (Klepstad et al., 1990).
Besides its affinity to the NMDA receptor, ketamine interacts with other receptors, including non-NMDA glutamate receptors, opioid receptors, nicotinic and muscarinic acetycholine receptors and GABA receptor type A. However, most of its analgesic, amnesic, psychomimetic, and neuroprotective effects (Chang et al., 2002), are mediated via the NMDA receptor (for a review, see Kohrs and Durieux, 1998).
Besides ketamine's characteristic advantages of producing indirect cardiovascular stimulation (Zielmann et al., 1997) and only mild respiratory depression (Werner et al., 1997), numerous studies demonstrated the analgesic properties of ketamine when administered in sub-anesthetic doses (Laulin et al., 2002; Menigaux et al., 2001). Ketamine is used in patients suffering from hemodynamic shock, active asthmatic disease, and anesthesia in children and intensive care settings (Kohrs and Durieux, 1998). However, phencyclidine-like psychomimetic adverse effects have restricted its use in humans, and abuse is common for this compound (Jansen, 2000). Recently, ketamine has been shown to induce neuronal death in rats during early development (Scallet et al., 2004).
In veterinary medicine, racemic ketamine is one of the most frequently used anesthetic agents in a wide range of dosages in almost all species (Wright, 1982).
A variety of pharmacokinetic studies on ketamine using conventional two or three compartment models are available for humans (Hijazi et al., 2003), rats (White et al., 1976), pigs (Loscher et al., 1990), cats (Waterman, 1983), dogs (Schwieger et al., 1991) and horses (Waterman et al., 1987; Muir and Sams, 1992). These studies do not consider individual enantiomers, and only a few studies consider the stereoselectivity of ketamine (White et al., 1985; Delatour et al., 1991; Geisslinger et al., 1993; Henthorn et al., 1999; Ihmsen et al., 2001; Edwards and Mather, 2001). Significant differences in the pharmacokinetic profile, e.g. clearance, of both enantiomers were seen in these experiments. PBPk models for ketamine are not available in the literature. These models were developed in the early 1980s (Lutz et al., 1980) and offer advantages for extrapolation between species, estimation of tissue concentrations and changing dosing regimens. Currently, PBPk models are commonly used for the analysis of absorption, distribution, metabolism and elimination data (ADME) for pharmaceuticals and toxics.
Animal studies on the pharmacodynamic effects of ketamine have shown that NMDA antagonists inhibit the ‘wind-up’ phenomenon (Woolf and Thompson, 1991), which plays a major role in the development of chronic pain. The term ‘wind-up’ was defined by Mendell and Wall (1965) who observed that repetition of a fixed stimulus at low frequency resulting in an activation of C fibers leads to a progressive build up in the amplitude of the response, recorded as action potential discharge in dorsal horn neurons. Temporal summation, defined by the increase of the perceived pain during repetitive application of stimuli of constant intensity, has been proposed as a psychophysical correlate of the early phase of ‘wind-up’ in humans (Price et al., 1994). Studies in humans clearly demonstrate a reduction of temporal summation under ketamine administration (Arendt-Nielsen et al., 1996; Guirimand et al., 2000).
In veterinary medicine, clinical studies on the use of ketamine for pain management are also available (Joubert, 1998; Wagner et al., 2002). A dose-dependent reduction in minimal alveolar concentration (MAC) of halothane of up to 37% during low-dose ketamine infusion in horses is reported (Muir and Sams, 1992).
One main goal of our study was the development of a PBPk model for ketamine in ponies to predict tissue levels, estimate dose schedules for different indications and create subsequent extrapolation of the model for horses. Given the promising results of ketamine treatment in chronic pain, experiments on long-term infusion versus experiments on bolus administration are of interest. Quantitative assessment of the nociceptive withdrawal reflex (NWR) and its facilitation as a measure of temporal summation has been previously described in horses (Spadavecchia et al., 2002, 2004). A second goal of our study was to investigate the amplitude and the duration of the NWR before, during and after target-controlled infusion of ketamine.
Materials and methods
Animals
The study was performed on 5-year-old healthy gelding Shetland ponies (n=6), weighing between 92 and 158 kg (mean±SD, 123.33±22.15). For each pony, the left carotid artery was surgically elevated to subcutaneous tissue 2 years before the experiment. The in vivo experiments were approved by the committee for animal experimentation, Kanton Bern, Switzerland. The ponies were fasted 24 h with access to water prior to experiments. On the study day, ponies were physically examined and complete blood analysis was performed.
Anesthesia
After preoxygenation, anesthesia was induced with isoflurane1 in oxygen via a face mask that was connected to a conventional circle anesthetic system.2 Gradual increment of inspired isoflurane concentration and physical restraint allowed stress-free induction and oro-tracheal intubation. Anesthesia was maintained with isoflurane in oxygen throughout the whole experiment at individual minimal alveolar concentration that had been determined in a previous study (Spadavecchia et al., 2005). Saphenous vein and carotid artery catheterization were performed for Ringer lactate, ketamine administration and blood pressure monitoring. Sixty minutes after induction of anesthesia, a target-controlled infusion (TCI) of racemic ketamine3 was initiated. The TCI system was developed in a pilot study according to an algorithm of Maitre and Shafer (1990). To achieve a constant plasma level of 1 μg/ml of S-ketamine, a computer-controlled infusion pump was used. Racemic ketamine was given as a bolus followed by an infusion over 120 min. The volume of the bolus was 10 ml, and the vehicle was sodium chloride (0.9%). Dosing for each animal was based on results obtained from a previous single dose study using a two-compartment model. A target plasma level of 1 μg/ml (4.2 μM) of S-ket over 120 min was anticipated by administration of an iv bolus dose (mean (SD)=376 (±123) μg/kg) followed by a linearly decreasing infusion rate of racemic ketamine (mean (SD) values at 0 and 120 min of 152 (±38) and 85 (±21) μg/kg/min, respectively). Mechanical ventilation was performed to maintain end-tidal CO2 in between 35 and 45 mm Hg during the entire experiment. Esophageal body temperature, ECG, pulsoxymetry, arterial blood pressure, inspired and end-tidal concentration of O2,CO2 and isoflurane were continuously monitored with a calibrated unit.4 Mean arterial blood pressure was always maintained above 70 mm Hg with iv dobutamine administration if necessary. Arterial blood gas analysis was performed every hour. After the end of each experiment, ponies were assisted for recovery.
Blood sample collection
Arterial blood samples were taken from the left carotid artery in heparinized tubes shortly before bolus ketamine application and at 0, 0.5, 1, 2, 3, 6, 10, 30, 50, 70, 90, 110, 120, 121, 123, 126, 130, 150, 170 and 190 min after starting the ketamine infusion. All samples were immediately put on ice, centrifuged and the plasma was stored at −80 °C for the determination of ketamine and norketamine enantiomers.
Enantioselective analysis of ketamine and norketamine in plasma
Enantiomers of ketamine and its active metabolite norketamine were measured in plasma using capillary electrophoresis (Theurillat et al., 2005). Briefly, the assay is based upon liquid–liquid extraction of ketamine and norketamine from 1 ml plasma followed by analysis of the reconstituted extract by capillary electrophoresis in the presence of a phosphate buffer (pH 2.5) containing 10 mg/ml highly sulfated β-cyclodextrin5 as a chiral selector. For each ketamine enantiomer, the calibration range was between 0.04 and 2.17 μg/ml and between 0.05 and 2.5 μg/ml for the enantiomers of norketamine,6 respectively. Lamotrigine7 was used as an internal standard (IST). Analyses were performed on a capillary electrophoresis analyzer8 using a 50 μm ID fused-silica capillary9 of 28 cm effective length, an applied voltage of 20 kV and a cartridge temperature of 30 °C. The detection wavelength was 195 nm. The detection limit for the enantiomers of ketamine and norketamine was 0.01 μg/ml. Typical electropherograms are presented in Fig. 1.
Fig. 1.

Electropherograms of samples from one pony that were collected before TCI (A), during TCI (90 min after start of TCI) (B) and 3 min after end of TCI (C). Concentrations of S-ket, R-ket, S-nor, and R-nor in the plasma of panel B were determined to be 1.39, 1.42, 0.85, and 0.41 μg/ml, respectively and in panel C, 0.78, 0.79, 0.85, and 0.40 μg/ml, respectively. Asterisks in (B) and (C) mark peaks of unidentified ketamine metabolites. (D) depicts the temporal behaviour of the current of (C).
Physiologically based pharmacokinetic (PBPk) model
Fig. 2 illustrates the six-compartment flow-limited PBPk model used to analyze the blood concentration data (described above) on R-ketamine (R-ket), S-ketamine (S-ket), R-norketamine (R-nor) and S-norketamine (S-nor) obtained during TCI in the present study. Furthermore, plasma concentrations of R-ket, S-ket, R-nor and S-nor obtained from two additional bolus studies (2.2 mg/kg racemic ketamine iv and 1.1 mg/kg S-ketamine10 iv) under isoflurane anesthesia in the same animals [data from a different study] were fit to the model. Ketamine, as a 50–50 racemic mixture of R-ket and S-ket, was administered via iv dose into the saphenous vein over varying time periods directly into the venous blood where it is considered to become rapidly mixed as it moves through the lung into the arterial blood. From the arterial blood, R-ket and S-ket distributed to the liver, kidney, fat, rapidly perfused tissues (a grouping of organs such as pancreas and heart) and the slowly perfused tissues (a grouping of organs such as muscle and skin). The equations used to model the physiology and the distribution of ketamine are given in Appendix A and closely follow the flow-limited models used by numerous other authors for different compounds (Kohn and Melnick, 1996; Reddy et al., 2003).
Fig. 2.

A schematic representation of the six-compartment physiologically based pharmacokinetic (PBPk) model describing the absorption, distribution, metabolism, and elimination of R-ket, S-ket and R-nor, S-nor in ponies.
In liver and lung, R-ket and S-ket are assumed to be metabolized through Hill kinetics to R-nor and S-nor, respectively. The Hill kinetic equation used has the general form:
| (1) |
where Cct is the concentration of compound c (R-ket or S-ket) in tissue t (this subscripting is used for all values), Vxct is the maximal rate of reaction (Vmax) for metabolism, kmct is the concentration yielding half of the maximal rate and nct is the Hill coefficient governing the shape of the reaction as C increases. In addition, both R-ket and S-ket are assumed to have a secondary first-order metabolic pathway in both the liver and lung (see Appendix A). The R-nor and S-nor are followed explicitly through a parallel PBPk model (see Appendix A) with further metabolism via Hill kinetics in both the liver and lung.
Parameter estimation
The individual pony body weights were used in the model with tissue volumes (VT) calculated as a proportion of mean body weight using literature values (Manohar et al., 1987; Deavers et al., 1973; Baggot, 1977; Barone, 1984a,b, 1989, 1990, 1996; Berg, 1995; Engelhardt, 2000; Nickel et al., 1995). Blood flow rates to the tissues (Qt) were calculated as a proportion of total cardiac output using literature values (McConaghy et al., 1996; Parks and Manohar, 1983). These are summarized in Table A1. Partition coefficients for R-ket and S-ket were calculated based upon the octanol–water partition coefficient for ketamine (3.1) and an allometric relationship (Poulin and Krishnan, 1996) for calculating partition coefficients linked to lipid content in tissue (Haddad et al., 2000). The partition coefficients for R-nor and S-nor were assumed to be 1 based upon the hydrophilicity of norketamine. The partition coefficients are presented in Table A2.
Metabolic parameters were estimated by maximum likelihood estimation where it was assumed that the data for R-ket, S-ket, R-nor and S-nor were log-normally distributed with constant variance over time. Separate variances were estimated for ketamine and norketamine enantiomers. Data below the limit of detection were treated as censored observations using the method of Koo et al. (2002). Estimated parameters are presented in Table 1. They included the two variances, the metabolic constants (Vxct, kmct, nct and kect) and the elimination rate constant for R-nor and S-nor from the kidney (kect) where c is the compound (ketamine or norketamine).
Table 1.
Estimated metabolic parameters (ketamine (subscript ket) or norketamine (subscript nor)) used in the PBPk model for enantiomers of ketamine and norketamine in ponies
| Parameter | Description | Liver |
Lung |
Kidney |
Units | |||
|---|---|---|---|---|---|---|---|---|
| R | S | R | S | R | S | |||
| Vxkett | Maximal rate of metabolism ketamine → norketamine | 71.7556 | 71.7556 | 304.6433 | 304.6433 | – | mmol norketamine/mmol ketamine/min | |
| kmkett | Dissociation constant for ketamine | 0.020965 | 0.020965 | 23.5331 | 23.5331 | – | mmol ketamine | |
| nkett | Hill Coefficient for metabolism ketamine → norketamine | 9.8481 | 9.8481 | 5.284 | 5.284 | – | Unitless | |
| kekett | The first-order rate of elimination of ketamine | 0.001255 | 0.001255 | 0.0010614 | 0.0010614 | – | l/min | |
| Vxnort | Maximal rate of metabolism norketamine → other | 1.1025 | 0.24569 | 31.0721 | 69.5397 | – | mmol other/mmol norketamine/min | |
| kmnort | Dissociation constant for norketamine | 0.0023946 | 0.0020467 | 1.6809 | 6.9547 | – | mmol norketamine | |
| nnort | Hill coefficient for metabolism norketamine → other | 9.8377 | 9.9771 | 1.5661 | 2.6643 | – | mmol norketamine | |
| kenort | The first-order rate of elimination of norketamine | – | – | 0.090819 | ||||
| l/min | ||||||||
Confidence bounds for the estimated parameters and statistical tests based on the model were all done using the likelihood ratio test as described by Koo et al. (2002). Standard deviation for the model for ketamine (R or S) and for norketamine (R or S) were 3.03 and 1.00, respectively. The modeling and parameter estimation were done using MATLAB language version 6.5 (The Mathworks Inc., 2002, Natick, MA, USA).
Electrophysiological recordings and quantification
The method used to assess NWR in horses has been described in detail by Spadavecchia et al. (2002). Briefly, NWR was evoked by a transcutaneous electrical stimulus that consisted of a train-of-five 1-ms constant-current square wave pulses delivered at a frequency of 200 Hz. For stimulation, two self-adhesive surface electrodes11 were applied to the clipped skin over the palmar lateral digital nerve. Resistance of stimulation electrodes had to be lower than 2 kΩ. The ground electrode was placed on the back of each pony. For electromyographic (EMG) recordings, a pair of self-adhesive electrodes12 was placed over the deltoid muscle. Stimulations and recordings were performed through a specially designed computerized system. EMG signals were amplified with an overall gain of 5000 and bandpass filtered (7 to 200 Hz; first-order active filters with 6 dB/octave slope). In order to record and quantify the EMG reflex activity in response to stimulation, the EMG was recorded from 100 ms prior to until 400 ms after the stimulus, resulting in a total recording time of 500 ms with 512 sampling points at a sampling frequency of 1024 Hz.
Electrical stimulations were performed before TCI under isoflurane anesthesia (Time Point 1=TP 1), 25 min (TP 2) and 105 min (TP 3) after start of ketamine TCI and 5 min (TP 4) and 65 min (TP 5) after end of ketamine TCI under isoflurane alone. Each stimulation consisted of 60 consecutive stimuli at the fixed intensity of 44 mA and a frequency of 1 Hz. The EMG responses obtained were averaged, and their morphology was analyzed to quantify the peak-to-peak amplitude and the reflex duration. To be considered a reflex response, the EMG burst following stimulation had to be at least 3 times the amplitude of the background activity with a duration of at least 10 ms within the epoch occurring 20 to 70 ms after the stimulation onset. To quantify the muscular response, the root-mean-square (RMS) value for reflex amplitude was calculated for the 20–70 ms epoch after stimulation. The background EMG amplitude was calculated as the RMS amplitude during the 100 ms interval before stimulation. To minimize the influence of possible variability among animals, the relative amplitude of the reflex in the range from 20 to 70 ms was calculated as the ratio between the RMS amplitude detected during such epoch and the RMS of the background EMG in the prestimulation interval.
Statistical analysis
Peak-to-peak amplitude and reflex duration of the NWR were analyzed by Friedman repeated measures ANOVA on ranks followed by the post hoc Tukey test for multiple comparisons. A value of p<0.05 was considered significant. The statistical analysis was performed using SigmaStat software (Systat Software inc., version 3.10, Point Richmond, CA, USA). Statistical evaluations within the context of the PBPk model were performed using a likelihood ratio test (Bard, 1974—Bard, J. Nonlinear Parameter Estimation, Academic Press, Inc., New York City).
Results
Physiological parameters
The infusion regime was well tolerated and no adverse effects were observed. All continuously monitored data stayed within physiological ranges throughout the experiments. Mean (SD) total anesthesia duration was 345 (±52) min. All animals recovered uneventfully from anesthesia.
Time courses of blood concentrations of R-/S-ketamine and R-/S-norketamine
A target plasma level of 1 μg/ml (4.2 μM) of S-ket over 120 min was anticipated by administration of an iv bolus dose (mean (SD)=376 (±123) μg/kg) followed by a linearly decreasing infusion rate of racemic ketamine (mean (SD) values at 0 and 120 min of 152 (±38) and 85 (±21) μg/kg/min, respectively). During TCI, plasma levels of ketamine enantiomers were determined to be at 6.81 μM±1.19 (mean±SD) (range 5.47–9.35 μM). Values obtained for arterial blood concentrations of S- and R-ket were similar at all time points (Fig. 3A).
Fig. 3.
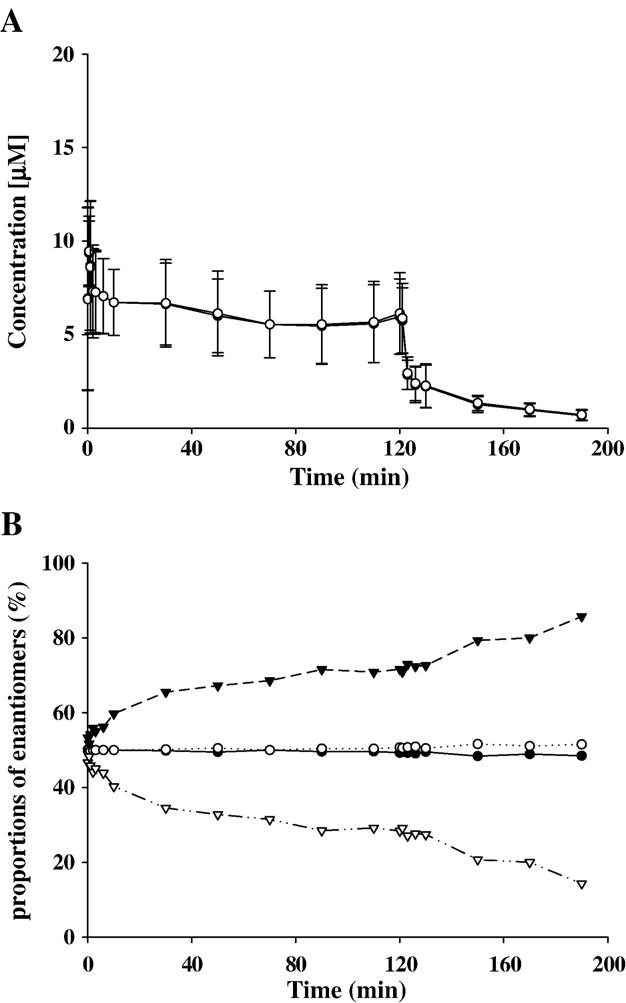
Plasma concentrations of R-ket and S-ket (not discernably different) in ponies (n=6) during and after TCI (presented as mean±SD) (A). Proportions of R-ket (open circles), S-ket (filled circles), R-nor (open triangle), and S-nor (filled triangle) in percent in plasma of ponies (n=6) during and after TCI (data are presented as mean) (B).
R-nor and S-nor were detected 60 s after ketamine administration. Plasma concentrations for norketamine enantiomers were determined to be lower compared to those of the parent compound in all but one of the animals and during the entire sampling period (see Fig. 4A).
Fig. 4.

Predicted (dashed line) plasma concentrations and 95% confidence intervals (dotted lines) for R-ket, S-ket, R-nor, and S-nor in one pony following ketamine TCI (A), intravenous bolus administration of 2.2 mg/kg racemic ketamine (B) and intravenous bolus administration of 1.1 mg/kg S-ketamine (C). Open circles represent measured plasma concentrations.
Interestingly, the plasma levels of S-nor exceeded those of R-nor in all samples later than 3 min after start of the TCI (Fig. 3B).
Additional peaks that were detected in plasma samples (see peaks marked with an asterisk in Fig. 1) were found to increase over time. Comparison of the UV spectra of those peaks revealed spectra similar to those of ketamine and norketamine. Therefore, they represent enantiomers of metabolites of ketamine and norketamine. Due to lack of standards, however, these compounds could not be identified.
PBPk model
The model was developed using the physiological parameters given in Table A1, and the partition coefficients given in Table A2. The value for cardiac output obtained from the literature (Manohar et al., 1987) was reduced by 60% under isoflurane anesthesia at 1 MAC.
The fits of R- and S-ket and R- and S-nor during and after TCI using the PBPk model are given for one pony in Fig. 4A. Note that all ponies were used in the estimation of model parameters, this figure is representative of the quality of the fit for all of the ponies. The time course for the metabolites R- and S-nor during and after TCI is characterized by an initial rise immediately after the bolus application (shortly before initiation of TCI) and a rapid decline at the end of TCI. The model provides an excellent fit for plasma concentrations of R- and S-nor with respect to the remarkable differences seen between measured plasma levels.
IV bolus administration of racemic ketamine (2.2 mg/kg) and S-ket (1.1 mg/kg) are shown in Figs. 4B and C, respectively. In general, a rapid decline was seen after iv bolus injection. This rapid decline is driven by the metabolism. Because of the high values for the Hill coefficients, the decline becomes much less rapid as tissue concentrations go below approximately 23 mM (see Fig. 5) due to the highly nonlinear metabolism in the lung. In the liver, due to the low km value and the large Hill coefficient, the metabolism from racemic ketamine to norketamine is effectively zero order. Both measured and predicted data show no difference in S-ket levels for administration of the racemic mixture (Fig. 4B) and S-ket alone (Fig. 4C).
Fig. 5.
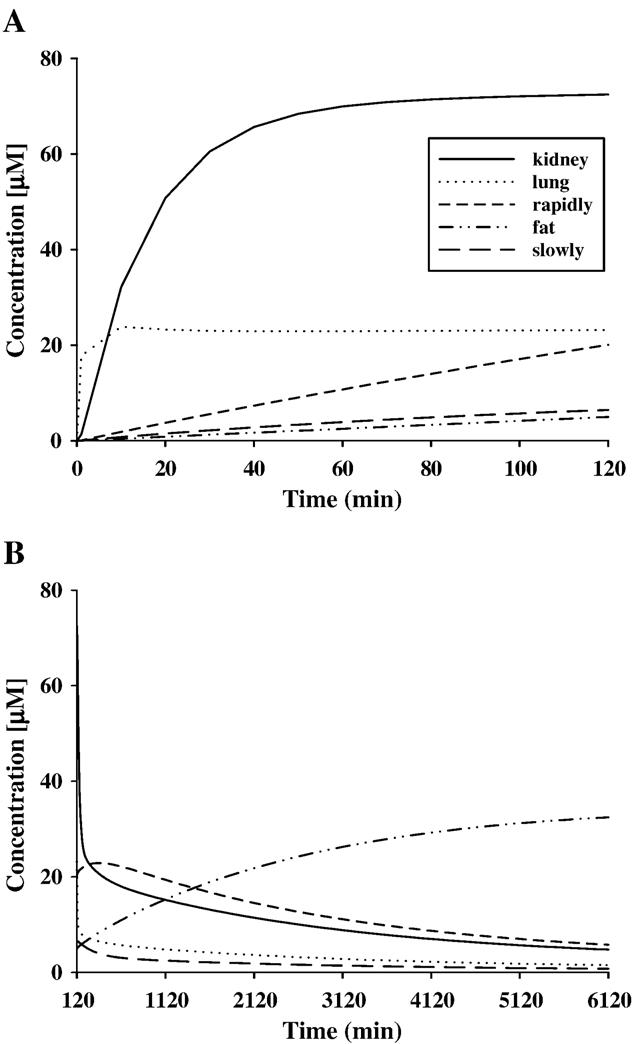
Predicted tissue concentrations of R-ket and S-ket for the pony whose plasma data are given in Fig. 4 during TCI (A) and after TCI (B). Equal values for tissue concentration of R-ket and S-ket are predicted for all time points.
Biotransformation
The liver has been reported to be the main organ of biotransformation for ketamine (White et al., 1982). In order to improve the fit of the model to the data, metabolism in the lung was included in the model. This resulted in a significant improvement to the fit of the data (p<0.001). The data for one pony are shown in Fig. 4A. Because of the initial passage of ketamine from the venous compartment through the lung before entering other parts of the body, there was a marked first-pass metabolic effect to reduce the levels of ketamine in plasma.
Two hypothetical metabolic schemes were compared using the PBPk model to explain the difference of about 50% between the concentrations of R- and S-nor as illustrated in Fig. 4A. The first hypothesis allows different biotransformation rates from R- and S-ket to R- and S-nor but no differences concerning biotransformation of norketamine enantiomers to further metabolites. In mathematical terms, this would assume equal Hill kinetics for R- and S-nor (VxRnt=VxSnt, kmRnt=kmSnt, and nRnt=nSnt). The second hypothesis assumes equal rates of biotransformation for ketamine to norketamine followed by further transformation of norketamine to other metabolites that could differ between R- and S-nor. In mathematical terms, this would assume equal Hill kinetics for R- and S-ket (VxRkt=VxSkt, kmRkt=kmSkt, and nRkt=nSkt) into R- and S-nor. Comparing likelihood values of these two different simulations with the likelihood value of an overall and unrestricted model using all six ponies simultaneously, the first hypothesis could be rejected due to a statistically significant difference (p<0.01), but not the second hypothesis (p>0.05).
Figs. 5 and 6 show the final model predictions for distribution and metabolism of ketamine and norketamine enantiomers, respectively, during and after TCI for a typical pony. Predicted tissue concentrations of ketamine and norketamine enantiomers in slowly and rapidly perfused tissue, fat, kidney, liver and lung are presented.
Fig. 6.

Predicted tissue concentrations (same pony as for Fig. 5) of S-nor during TCI (A) and after TCI (B); and of R-nor during TCI (C) and after TCI (D).
Similar to the measured concentrations in plasma, R- and S-ket show equal tissue levels according to model prediction at all time points and in all tissues. Ketamine distribution in kidney tissue is characterized by an initial rise during the first third of TCI. A plasma concentration of 72.5 μM is predicted for the end of TCI (120 min, Fig. 5A). Thereafter, an exponential decline is observed with the tissue concentration being 4.8 μM at 4.25 days after starting TCI (Fig. 5B). The highest tissue concentrations of ketamine enantiomers are predicted to be in the kidneys. Following TCI, ketamine enantiomers are predicted to accumulate slightly in rapidly perfused tissue and strongly in fat, due to redistribution from other tissues. The highest tissue concentrations in rapidly perfused tissue are predicted to be reached around 10 h after initiation of TCI followed by a slow reduction. Levels of ketamine enantiomers in fat still continue to increase 4 days after starting TCI according to the model, showing concentrations of 32.4 μM at this time point (Fig. 5B). Peak concentrations of R- and S-ket in fat are reached around 7 days after TCI followed by a slow decrease in levels of ketamine enantiomers. The model predicts concentrations of about 20 μM for R- and S-ket in fat 42 days after the start of TCI. Ketamine levels in slowly perfused tissue and lung show a rapid decline immediately after TCI with slowly perfused tissue showing the most gradual reduction (Fig. 5B). Predicted values in blood match those that have been determined in plasma using capillary electrophoresis (prediction for blood not shown).
In lung, the time course of R- and S-ketamine is predicted to be similar to R- and S-ketamine in plasma (Fig. 4A), whereas the concentration of ketamine enantiomers in the lung is predicted to be about 5 times greater than the plasma levels during and after TCI. The liver (data not shown) is predicted to contain the lowest concentrations (consistently below 0.02 μM) of ketamine enantiomers at virtually all times. In all tissues, concentrations of the metabolites are predicted to remain at much lower levels than those of the parent compounds.
Similar to their time course in plasma, norketamine enantiomers are characterized by an initial rise at the beginning of TCI and a rapid decline after TCI in all tissues (Fig. 6).
Norketamine enantiomers are much more hydrophilic than their lipophilic parent compounds. Therefore, they are predicted to be rapidly eliminated from fat in contrast to R- and S-ket. In general, norketamine enantiomers are eliminated rapidly from all tissues in comparison to S- and R-ket.
Similar to the determined plasma levels, the model consistently predicts higher amounts for S-nor than for R-nor in all tissues and at all time points and the ratio between S- and R-nor concentrations differs between tissues. In liver, this difference is most prominent. It reflects the different biotrans-formation rates for S- and R-nor to further metabolites. The model predicts the rate of biotransformation to downstream metabolites of R-nor in the liver to be 8 times higher than the biotransformation rate for S-nor. Therefore, in liver tissue, the concentration for S-nor rises (Fig. 6A) during TCI, whereas R-nor is rapidly metabolized and does not accumulate (levels of about 0.2 μM only, Fig. 6). This predicted difference in metabolism of R- and S-nor in the liver may explain the difference between R- and S-nor concentrations in plasma and other tissues.
Nociceptive withdrawal reflex (NWR)
A statistically significant difference in peak-to-peak amplitude of the NWR was found between pre-ketamine exposure (TP 1) and 25 min after starting ketamine TCI (TP 2) (p=0.001) and 105 min after starting the ketamine TCI (TP 3) (p=0.001). Reflex duration was significantly decreased 105 min after the beginning of ketamine TCI (TP 3) (p=0.014) in comparison to pre-ketamine exposure (TP 1). Statistically significant differences in the relative amplitude of the reflex in the epoch of 20 to 70 ms after stimulation were detected between pre-drug exposure (TP 1) and ketamine exposure (TP 3) (p=0.004) and between post-ketamine exposure (TP 5) and ketamine exposure (TP 3) (p=0.004). The averaged NWR slowly returned toward baseline values after the end of TCI as illustrated in Fig. 7 although it remained altered at 65 min post TCI (TP 5).
Fig. 7.
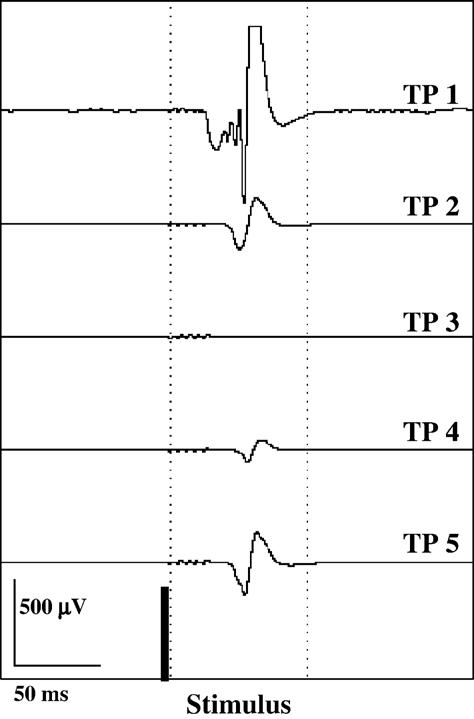
Electromyographic recording depicted for one animal. The averaged response of the deltoid muscle to electrical stimulation (60 consecutive stimuli, 44 mA, 1 Hz) of the palmar lateral digital nerve is presented. The time points (TP) indicate predrug (without ketamine) under isoflurane anesthesia (TP 1), 25 min (TP 2) and 105 min (TP 3) after the start of ketamine TCI, 5 min (TP 4) and 65 min after the end of ketamine TCI (TP 5) under isoflurane anesthesia.
Discussion
Pharmacokinetics
In the current study, a PBPk model for ketamine was built from plasma concentrations obtained in ponies after continuous infusion or bolus administration. The model considers a first-pass metabolism in lung to provide a precise prediction of the rapid rise and decline of the curve of norketamine enantiomers. Metabolism of ketamine in lung does occur as reported for in vitro ketamine biotransformation in microsomes isolated from lung tissue of rabbits (Pedraz et al., 1986).
An interesting finding was the continuously obtained higher concentrations of S-nor compared to R-nor in all plasma samples after equal amounts of ketamine enantiomers were administered to the ponies. This is in agreement with results obtained in an earlier study (Delatour et al., 1991). After iv bolus administration of 6 mg/kg of racemic ketamine, proportions of S- and R-nor of about 3:1 after 5 min and of about 9:1 after 40 min were reported, whereas no difference in plasma concentrations of S- and R-ket was obtained at all time points. The authors hypothesized a substrate enantioselectivity of the cytochrome-P450-dependent N-demethylation of keta-mine (Delatour et al., 1991). This is contrary to our hypothesis that there are identical rates of biotransformation to norketamine enantiomers but differences in downstream metabolism to further hydroxylated and glucuronidated compounds.
Ketamine is metabolized extensively by the hepatic cytochrome P450 system to norketamine, an active metabolite with a potency one-third to one-fifth when compared to the parent compound (Kohrs and Durieux, 1998). Norketamine is hydroxylated to form hydroxy–norketamine compounds that can be conjugated to more water-soluble glucuronide derivatives (White et al., 1982) and further metabolized to dehydronorketamine which appears to be the most abundant ketamine metabolite other than norketamine (Williams and Wainer, 2002). Contrary ring hydroxylation of ketamine without prior N-demethylation occurs, but this pathway appears to be quantitatively of minor importance (White et al., 1982). In humans, CYP3A4, CYP2B6 and CYP2C9 have been reported to be involved in ketamine biotransformation (Hijazi and Boulieu, 2002; Yanagihara et al., 2001).
In vivo studies in humans have shown higher values for the clearance of S-ket than for R-ket either after administration of the individual enantiomers (Persson et al., 2002; White et al., 1985) or after administration of the racemic mixture (Henthorn et al., 1999; Geisslinger et al., 1993; Ihmsen et al., 2001). Our results also clearly show differences in biotransformation of ketamine and/or norketamine enantiomers resulting in consistently higher plasma concentrations of S-nor than of R-nor. Ihmsen et al. (2001) reported that the clearance of S-ket, when administered as pure enantiomer, was significantly larger than the clearance of S-ket when administered in the racemate. They suggested an inhibition of the metabolism of S-ket by R-ket referring to an in vitro study of Kharasch and Labroo (1992). Using human liver microsomes, the rate of N-demethylation of the racemate was found to be significantly smaller than the sum of the rates of the individual enantiomers. Therefore, a metabolic enantiomeric interaction was suggested by Kharasch and Labroo (1992), whereby S-ket inhibits the metabolism of R-ket and R-ket inhibits the metabolism of S-ket termed as relative enantiomeric selectivity.
In the current study, two hypotheses were tested to explain the consistently higher concentrations of S-nor in comparison to R-nor detected in plasma. The first hypothesis assumed different biotransformation rates from ketamine enantiomers to R- and S-nor referring to Delatour et al. (1991) followed by identical rates of biotransformation for norketamine enantiomers to further metabolites. The second hypothesis included different rates of biotransformation for R- and S-nor to further metabolites, taking a study of Trevor et al. (1983) in account. They found human liver microsomes to exhibit selectivity with respect to the formation of hydroxylated norketamine metabolites, with R-and S-nor undergoing preferential hydroxylation at different positions at the cyclohexanone ring, termed product selectivity. However, identical biotransformation rates for R- and S-ket are assumed in the second hypothesis. Therefore, it did not consider differences in enzymatic reactions for R-and S-ket to norketamine enantiomers, termed substrate selectivity. Kharasch and Labroo (1992) concluded that human ketamine metabolism exhibits moderate degrees of both substrate and product stereoselectivity. After simulation of both hypotheses using the PBPk model, we could reject the first hypothesis due to a statistically significant difference (p<0.01) compared to the likelihood value of an overall and unrestricted model, but not the second hypothesis (p>0.05). Further investigations in vitro using equine microsomes are required and are already under way.
Edwards and Mather (2001) investigated the effect of two different infusion regimes of racemic ketamine in rats by performing either a ‘washin infusion’ of 6 mg/kg until lethality or a ‘washout infusion‘ of 20 mg/kg over 5 min. Plasma and tissue concentrations of ketamine and norketamine were determined enantioselectively. During ‘washin infusion’, the authors reported consistently higher plasma levels of R- than S-nor. During ‘washout infusion’, a period with higher concentrations of R- than S-nor was followed by a phase during which the S-nor levels significantly exceed those of R-nor. The authors proposed two possible reasons: concentration-dependent N-demethylation and concentration-independent metabolic inversion from R- to S-nor or from R- to S-ket and subsequent metabolism to S-nor. We consider the second suggestion to be rather unlikely because no R-enantiomers were detected after administration of S-ket (Geisslinger et al., 1993; Ihmsen et al., 2001).
Tissue distribution of ketamine and norketamine enantiomers
The PBPk model predicts identical tissue concentration curves in all compartments for S- and R-ket. However, consistently higher concentrations for S- than for R-nor in all tissues are predicted due to differences in metabolism leading to differences in plasma.
Our prediction for tissue distribution of ketamine is in agreement with those of Henthorn et al. (1999). They used a recirculatory pharmacokinetic model to analyze arterial blood concentrations that they obtained after administration of racemic ketamine intravenously in dogs. Because of the lack of stereoisomeric effects for ketamine distribution in pulmonary tissue, identical distribution of S- and R-ket in other tissues was suggested. This is contrary to Edwards and Mather (2001), who detected significant differences between concentrations of S-and R-ket and S- and R-nor in different tissues after either ‘washin’ or ‘washout’ infusion in rats. The predictions of our PBPk model analysis do not confirm these results. Due to identical partition coefficients for optical isomers, our model does not predict differences in tissue uptake.
In the present study, kidneys were estimated to provide highest tissue levels of ketamine enantiomers, which is in agreement with results from studies in rats (White et al., 1976; Edwards and Mather, 2001).
The PBPk model predicted the biotransformation rate for the formation of norketamine enantiomers to be 2.8 times higher in the liver compared to the lung during steady state. This assumption is supported by results from a study in horses (Larsson et al., 2003). The authors report that the capacity of the lung to activate aflatoxin B1 (AFB1) by cytochrome P450 enzymes to the reactive intermediate AFB1-8,9-epoxide was clearly shown to be lower than those of the liver using microsomal preparations from 5 different horses.
Due to the high lipid solubility of ketamine that is reported to be 5 to 10 times higher than thiopental (Cohen and Trevor, 1974), our PBPk model predicted accumulation of ketamine in fat. Especially in horses, adverse effects of ketamine like excitement, delirium and severe muscle rigidity complicate recovery phase and should be prevented by reducing ketamine administration early enough before recovery. The PBPk model considers accumulation of ketamine in fat and other tissues and is, therefore, an important tool to create dosing regimes for ponies as well as other equines or different animals. Extrapolation to other species can be performed by changing the physiological parameters in the model if tremendous differences in biotransformation can be precluded. The PBPk model allows dose estimation schedules for ketamine administration at even lower dosages than those used in this study. Lower dosage provides administration to the standing non-anesthetized animal. Especially for this application, the therapeutic window is very narrow. Exact prediction of plasma and tissue levels can be estimated using a PBPk model to achieve therapeutic effects without adverse effects.
Pharmacodynamics
In the chosen route of administration, ketamine resulted in a decreased peak-to-peak amplitude and a shorter duration of the NWR. The NWR is a polysynaptic, spinal reflex that is responsible for the escape reaction from a damaging stimulus to protect the integrity of the body (nocifensive reaction). Due to advantages like non-invasiveness, relative reproducibility and a good correlation between muscle response and subjective pain intensity in humans, the quantitative assessment of the NWR has become an important tool in pain research (Arendt-Nielsen and Petersen-Felix, 1995). Our results are consistent with studies in rats and cats that clearly have shown that ketamine selectively reduces spinal reflexes to noxious stimuli (Hartell and Headley, 1990; Headley et al., 1987). They report the inhibition of spinal responses to be dose-dependent. Depression of spinal reflexes consistently was found to correlate with the degree of nociception caused by stimulus intensity and amount of tissue damage.
In a previous study, an inhibition of the NWR already was confirmed in ponies under isoflurane anesthesia (Spadavecchia et al., 2005). In comparison to these results, our results showed a more pronounced inhibition of the NWR under ketamine infusion during isoflurane anesthesia. Therefore, isoflurane might have contributed to the observed inhibition of the NWR.
There is also evidence from human studies showing that ketamine provokes a depression of the NWR evoked by mechanical or strong electrical stimuli (Arendt-Nielsen et al., 1995). Moreover, temporal summation threshold was significantly increased when repeated electrical stimuli (five pulses at 2 Hz) were applied during administration of racemic or S-ket (Arendt-Nielsen et al., 1996). Guirimand et al. (2000) observed this phenomenon when repeated stimuli were applied at the frequency of 1 Hz in humans. The same stimulation frequency was used in the current study. While averaging the responses to 60 stimuli, temporal summation effects contribute to the amplitude of the recorded NWR. The reduction of the peak-to-peak and the duration observed during ketamine TCI possibly indicates inhibition of the single nociceptive reflex, of temporal summation or both. Further investigation will be required to more specifically discriminate the mechanisms of action in similar experimental settings.
Our results show that continuous iv administration of racemic ketamine over 120 min with S-ketamine plasma level of around 7 μM is well-tolerated and resulted in no adverse effects in ponies. The developed PBPk model allows estimation of levels of ketamine and norketamine enantiomers in plasma and other tissues using different administration schedules. The model confirmed the main properties of ketamine: initial rapid distribution followed by accumulation in fat. Furthermore, it estimated different levels of R- and S-nor resulting from different metabolism to further metabolites.
Using physiological parameters for horses or other species, the model can be used to predict dosing regimes for iv long-term ketamine administration. The depression of the NWR during ketamine infusion demonstrates the depressive spinal effect of this NMDA antagonist. However, more data are needed to confirm the preliminary evidence we obtained in our study on a possible antinociceptive effect of ketamine at low doses.
Acknowledgments
The authors gratefully acknowledge the support provided by Prof. U. Schatzmann, Prof. M.F. Landoni and Dr. M.P. Larenza. Racemic ketamine and S-ketamine for iv administration was kindly supplied by Dr. E. Gräub AG (Bern, Switzerland). This study was funded by Vetsuisse, Switzerland and by the Swiss National Science Foundation (analytical part). This research was supported [in part] by the Intramural Research Program of the NIH and NIEHS.
Appendix A
From the arterial blood, R-ket, S-ket, R-nor and S-nor equilibrate with tissue via tissue partition coefficients. For four tissues, kidney (t=K), fat (t=F), rapidly perfused tissues (t=R) and slowly perfused tissues (t=S), the rate of transfer in and out of the tissue is modeled using flow-limited kinetics leading to the equations:
| (A1) |
where Act(t) is the amount (μmol) of compound (c) in tissue (t) space at time t, Qt is the rate (l/min) at which blood enters the tissue t, AcA is the amount of compound in arterial blood (μmol), VA is the volume of the arterial blood (l), Act(t) is the amount (μmol) of compound in tissue t, Vt is the volume (l) of tissue t and Pt is the partition coefficient (unitless) for compound between blood and tissue for tissue t.
The movement of compound in and out of the liver (t=L) and lung (t=P) tissue is modeled by the equation:
| (A2) |
where Vxct is the maximal rate of reaction (Vmax) for metabolism, kmct is the concentration yielding half of the maximal rate, nct is the Hill coefficient governing the shape of the reaction as C increases, and kect is the first order rate of elimination for all other metabolites of compound (μmol metabolites/μmol c/min). For lung, the rate of blood flow into the tissue is the entire cardiac output (QP=QV=QA). For R-nor and S-nor, no first order rate is assumed so keRnL=keSnL=keRnP=keSnP=0.
The equation describing the change in the amount of R-nor and S-nor in kidney capillary space is identical to Eq. (A2) with the exception that they are assumed to be eliminated by first-order kinetics from kidney tissue (see Fig. 1) so the equation governing kidney tissue concentration is given by:
| (A3) |
where kecK is the first-order rate of elimination of compound from the kidney (μmol/min) and keRkK=keSkK=0.
Finally, to maintain mass balance, the amount of R-ket, S-ket, R-nor, and S-nor entering and leaving the venous blood must balance with the amount entering and leaving the combined tissues (excluding lung). Hence, the equations describing the kinetics of compound in the venous blood are given by:
| (A4) |
and for arterial blood is given by:
| (A5) |
Table A1.
Physiological parameters used in the PBPk model for R-ket, S-ket, R-nor and S-nor in ponies
| Parameter name | Value | Description | Reference |
|---|---|---|---|
| co | 5% of bw | Cardiac output rate (l/min) at which blood flows through the heart | (Manohar et al., 1987) |
| bw | Individual animal | Body weight in kg | |
| vF | 18% | % of body mass that is fat (unitless but results in a volume in liters when multiplied by body weight) | (Deavers et al., 1973) |
| vS | 100%— sum (all others) | % of body mass that is slowly perfused tissue (unitless but results in a volume in liters when multiplied by body weight) | (Baggot, 1977, Barone 1984a,b, 1989; Berg, 1995) |
| vR | 28% | % of body mass that is rapidly perfused tissue (unitless but results in a volume in liters when multiplied by body weight) | (Barone, 1996; Berg, 1995) |
| vk | 0.35% | % of body mass that is kidney (unitless but results in a volume in liters when multiplied by body weight) | (Barone, 1990; Berg, 1995) |
| vL | 2% | % of body mass that is liver (unitless but results in a volume in liters when multiplied by body weight) | (Barone, 1984a) |
| vX | 1% | % of body mass that is lung (unitless but results in a volume in liters when multiplied by body weight) | (Nickel et al., 1995) |
| vA | 5.4% | % of body mass that is arterial blood (unitless but results in a volume in liters when multiplied by body weight) | (Engelhardt, 2000) |
| qF | 6.50% | % (unitless) of cardiac output (co) which, when multiplied by co yields rate (l/min) at which blood flows through the fat | (McConaghy et al., 1996) |
| qS | 31.50% | % (unitless) of co which, when multiplied by co yields rate (l/min) at which blood flows through the slowly perfused tissue | (McConaghy et al., 1996) |
| qR | 100%-sum (rest) | % (unitless) of co which, when multiplied by co yields rate (l/min) at which blood flows through the rapidly perfused tissue | (McConaghy et al., 1996) |
| qK | 13.10% | % (unitless) of co which, when multiplied by co yields rate (l/min) at which blood flows through the kidney | (Parks and Manohar, 1983) |
| qL | 2.10% | % (unitless) of co which, when multiplied by co yields rate (l/min) at which blood flows through the liver | (McConaghy et al., 1996) |
| qX | 100% | % (unitless) of co which, when multiplied by co yields rate (l/min) at which blood flows through the lung |
Table A2.
Partition coefficients for R- and S-ket and R- and S-nor
| Parameter name | Value | Partition coefficient (unitless) |
|---|---|---|
| ppF | 332 | For ketamine (R or S) between blood and fat |
| ppS | 4.83 | For ketamine (R or S) between blood and slowly perfused tissue |
| ppR | 35.3 | For ketamine (R or S) between blood and rapidly perfused tissue |
| ppK | 31.4 | For ketamine (R or S) between blood and kidney |
| ppL | 16.7 | For ketamine (R or S) between blood and liver |
| ppX | 10 | For ketamine (R or S) between blood and lung |
| pmF | 1 | For norketamine (R or S) between blood and fat |
| pmS | 1 | For norketamine (R or S) between blood and slowly perfused tissue |
| pmR | 1 | For norketamine (R or S) between blood and rapidly perfused tissue |
| pmK | 1 | For norketamine (R or S) between blood and kidney |
| pmL | 1 | For norketamine (R or S) between blood and liver |
| pmX | 1 | For norketamine (R or S) between blood and lung |
Footnotes
Publisher's Disclaimer: This article was originally published in a journal published by Elsevier, and the attached copy is provided by Elsevier for the author's benefit and for the benefit of the author's institution, for non-commercial research and educational use including without limitation use in instruction at your institution, sending it to specific colleagues that you know, and providing a copy to your institution's administrator.
Isoflo® Abbott AG, Baar, Switzerland.
Electronic respirator 3100, F. Hoffmann-La Roche, Basel, Switzerland.
Ketasol 100©, Dr. E. Gräub, Bern, Switzerland.
S/5 compac Datex-Ohmeda, Helsinki, Finland.
Sulfated-β-cyclodextrin, Sigma Aldrich Chemie, Schnelldorf, Germany.
Racemic norketamine hydrochloride, Cerilliant, Round Rock, USA.
Lamotrigine, The Wellcome Foundation, London, UK.
ProteomeLab™ PA 800 CE system, Beckman Coulter, Fullerton, CA, USA.
Fused-silica capillary, Polymicro Technologies, Phoenix, AZ, USA.
S-ketamine, not commercially available in Switzerland, Dr. E. Gräub AG, Bern, Switzerland.
Neuroline 7 00 02-J, Medicotest, Olstykke, Denmark.
Synapse, Ambu A/S, Ballerup, Denmark.
Conflict of Interest Statement: the authors have no conflict of interest of any kind related to the work presented in this publication.
References
- Arendt-Nielsen L, Petersen-Felix S. Wind-up and neuroplasticity: is there a correlation to clinical pain? Eur. J. Anaesthesiol. Suppl. 1995a;10:1–7. [PubMed] [Google Scholar]
- Arendt-Nielsen L, Petersen-Felix S, Fischer M, Bak P, Bjerring P, Zbinden AM. The effect of N-methyl-d-aspartate antagonist (ketamine) on single and repeated nociceptive stimuli: a placebo-controlled experimental human study. Anesth. Analg. 1995b;81:63–68. doi: 10.1097/00000539-199507000-00013. [DOI] [PubMed] [Google Scholar]
- Arendt-Nielsen L, Nielsen J, Petersen-Felix S, Schnider TW, Zbinden AM. Effect of racemic mixture and the (S+)-isomer of ketamine on temporal and spatial summation of pain. Br. J. Anaesth. 1996;77:625–631. doi: 10.1093/bja/77.5.625. [DOI] [PubMed] [Google Scholar]
- Baggot JD. Drug distribution. In: Baggot JD, editor. Principles of Drug Disposition in Domestic Animals: The Basis of Veterinary Clinical Pharmacology. W.B. Saunders; Philadelphia: 1977. pp. 48–72. [Google Scholar]
- Barone R. Appareil digestif, glandes annexes de l'intestin, foie. In: Barone R, editor. Anatomie comparée des mammifères domestiques; tome 3: Splanchnologie I. Editions Vigot; Paris: 1984a. pp. 507–561. [Google Scholar]
- Barone R. Appareil respiratoire, poumons. In: Barone R, editor. Anatomie comparée des mammifères domestiques; tome 3: Splanchnologie I. Editions Vigot; Paris: 1984b. pp. 756–800. [Google Scholar]
- Barone R. Myologie, caractères généraux des muscles. In: Barone R, editor. Anatomie comparée des mammifères domestiques; tome 2: Arthrologie et Myologie. Editions Vigot; Paris: 1989. pp. 357–375. [Google Scholar]
- Barone R. Apparail uro-génital, reins. In: Barone R, editor. Anatomie comparée des mammifères domestique; tome 4: Splanchnologie II. Editions Vigot; Paris: 1990. pp. 19–45. [Google Scholar]
- Barone R. Cœur, caractères généraux et conformation extérieure. In: Barone R, editor. Anatomie comparée des mammifères domestique: tome 5: Angiologie. Editions Vigot; Paris: 1996. pp. 14–25. [Google Scholar]
- Berg R. Angewandte Anatomie der Schlachttierkörper. In: Berger R, editor. Angewandte und topographische Anatomie der Haustiere. G. Fischer Verlag; Stuttgart: 1995. pp. 475–495. [Google Scholar]
- Chang ML, Yang J, Kem S, Klaidman L, Sugawara T, Chan PH, Adams JD., Jr. Nicotinamide and ketamine reduce infarct volume and DNA fragmentation in rats after brain ischemia and reperfusion. Neurosci. Lett. 2002;322:137–140. doi: 10.1016/s0304-3940(01)02520-4. [DOI] [PubMed] [Google Scholar]
- Cohen ML, Trevor AJ. On the cerebral accumulation of ketamine and the relationship between metabolism of the drug and its pharmacological effects. J. Pharmacol. Exp. Ther. 1974;189:351–358. [PubMed] [Google Scholar]
- Deavers S, Rosborough JP, Garner HE, Huggins RA, Amend JF. Blood volumes and total body water in the domestic pony. J. Appl. Physiol. 1973;34:341–343. doi: 10.1152/jappl.1973.34.3.341. [DOI] [PubMed] [Google Scholar]
- Delatour P, Jaussaud P, Courtot D, Fau D. Enantioselective N-demethylation of ketamine in the horse. J. Vet. Pharmacol. Ther. 1991;14:209–212. doi: 10.1111/j.1365-2885.1991.tb00825.x. [DOI] [PubMed] [Google Scholar]
- Edwards SR, Mather LE. Tissue uptake of ketamine and norketamine enantiomers in the rat: indirect evidence for extrahepatic metabolic inversion. Life Sci. 2001;69:2051–2066. doi: 10.1016/s0024-3205(01)01287-5. [DOI] [PubMed] [Google Scholar]
- Engelhardt W. Kreislauf. In: Engelhardt W, Breves G, editors. Physiologie der Haustiere. Enke Verlag; Stuttgart: 2000. pp. 171–189. [Google Scholar]
- Geisslinger G, Hering W, Thomann P, Knoll R, Kamp HD, Brune K. Pharmacokinetics and pharmacodynamics of ketamine enantiomers in surgical patients using a stereoselective analytical method. Br. J. Anaesth. 1993;70:666–671. doi: 10.1093/bja/70.6.666. [DOI] [PubMed] [Google Scholar]
- Guirimand F, Dupont X, Brasseur L, Chauvin M, Bouhassira D. The effects of ketamine on the temporal summation (wind-up) of the R(III) nociceptive flexion reflex and pain in humans. Anesth. Analg. 2000;90:408–414. doi: 10.1097/00000539-200002000-00031. [DOI] [PubMed] [Google Scholar]
- Haddad S, Poulin P, Krishnan K. Relative lipid content as the sole mechanistic determinant of the adipose tissue:blood partition coefficients of highly lipophilic organic chemicals. Chemosphere. 2000;40:839–843. doi: 10.1016/s0045-6535(99)00279-9. [DOI] [PubMed] [Google Scholar]
- Hartell NA, Headley PM. Spinal effects of four injectable anaesthetics on nociceptive reflexes in rats: a comparison of electrophysiological and behavioural measurements. Br. J. Pharmacol. 1990;101:563–568. doi: 10.1111/j.1476-5381.1990.tb14121.x. [DOI] [PMC free article] [PubMed] [Google Scholar]
- Headley PM, Parsons CG, West DC. The role of N-methylaspartate receptors in mediating responses of rat and cat spinal neurones to defined sensory stimuli. J. Physiol. 1987;385:169–188. doi: 10.1113/jphysiol.1987.sp016490. [DOI] [PMC free article] [PubMed] [Google Scholar]
- Henthorn TK, Krejcie TC, Niemann CU, Enders-Klein C, Shanks CA, Avram MJ. Ketamine distribution described by a recirculatory pharmacokinetic model is not stereoselective. Anesthesiology. 1999;91:1733–1743. doi: 10.1097/00000542-199912000-00027. [DOI] [PubMed] [Google Scholar]
- Hijazi Y, Boulieu R. Contribution of CYP3A4, CYP2B6, and CYP2C9 isoforms to N-demethylation of ketamine in human liver microsomes. Drug Metab. Dispos. 2002;30:853–858. doi: 10.1124/dmd.30.7.853. [DOI] [PubMed] [Google Scholar]
- Hijazi Y, Bodonian C, Bolon M, Salord F, Boulieu R. Pharmacokinetics and haemodynamics of ketamine in intensive care patients with brain or spinal cord injury. Br. J. Anaesth. 2003;90:155–160. doi: 10.1093/bja/aeg028. [DOI] [PubMed] [Google Scholar]
- Ihmsen H, Geisslinger G, Schuttler J. Stereoselective pharmacokinetics of ketamine: R(−)-ketamine inhibits the elimination of S(+)-ketamine. Clin. Pharmacol. Ther. 2001;70:431–438. doi: 10.1067/mcp.2001.119722. [DOI] [PubMed] [Google Scholar]
- Jansen KL. A review of the nonmedical use of ketamine: use, users and consequences. J. Psychoactive Drugs. 2000;32:419–433. doi: 10.1080/02791072.2000.10400244. [DOI] [PubMed] [Google Scholar]
- Joubert K. Ketamine hydrochloride—An adjunct for analgesia in dogs with burn wounds. J. S. Afr. Vet. Assoc. 1998;69:95–97. doi: 10.4102/jsava.v69i3.825. [DOI] [PubMed] [Google Scholar]
- Kharasch ED, Labroo R. Metabolism of ketamine stereoisomers by human liver microsomes. Anesthesiology. 1992;77:1201–1207. doi: 10.1097/00000542-199212000-00022. [DOI] [PubMed] [Google Scholar]
- Klepstad P, Maurset A, Moberg ER, Oye I. Evidence of a role for NMDA receptors in pain perception. Eur. J. Pharmacol. 1990;187:513–518. doi: 10.1016/0014-2999(90)90379-k. [DOI] [PubMed] [Google Scholar]
- Kohn MC, Melnick RL. Effects of the structure of a toxicokinetic model of butadiene inhalation exposure on computed production of carcinogenic intermediates. Toxicology. 1996;113:31–39. doi: 10.1016/0300-483x(96)03424-5. [DOI] [PubMed] [Google Scholar]
- Kohrs R, Durieux ME. Ketamine: teaching an old drug new tricks. Anesth. Analg. 1998;87:1186–1193. doi: 10.1097/00000539-199811000-00039. [DOI] [PubMed] [Google Scholar]
- Koo JW, Parham F, Kohn MC, Masten SA, Brock JW, Needham LL, Portier CJ. The association between biomarker-based exposure estimates for phthalates and demographic factors in a human reference population. Environ. Health Perspect. 2002;110:405–410. doi: 10.1289/ehp.02110405. [DOI] [PMC free article] [PubMed] [Google Scholar]
- Larsson P, Persson E, Tyden E, Tjalve H. Cell-specific activation of aflatoxin B1 correlates with presence of some cytochrome P450 enzymes in olfactory and respiratory tissues in horse. Res. Vet. Sci. 2003;74:227–233. doi: 10.1016/s0034-5288(02)00191-1. [DOI] [PubMed] [Google Scholar]
- Laulin JP, Maurette P, Corcuff JB, Rivat C, Chauvin M, Simonnet G. The role of ketamine in preventing fentanyl-induced hyperalgesia and subsequent acute morphine tolerance. Anesth. Analg. 2002;94:1263–1269. doi: 10.1097/00000539-200205000-00040. (table) [DOI] [PubMed] [Google Scholar]
- Loscher W, Ganter M, Fassbender CP. Correlation between drug and metabolite concentrations in plasma and anesthetic action of ketamine in swine. Am. J. Vet. Res. 1990;51:391–398. [PubMed] [Google Scholar]
- Lutz RJ, Dedrick RL, Zaharko DS. Physiological pharmacokinetics: an in vivo approach to membrane transport. Pharmacol. Ther. 1980;11:559–592. doi: 10.1016/0163-7258(80)90042-x. [DOI] [PubMed] [Google Scholar]
- Maitre PO, Shafer SL. A simple pocket calculator approach to predict anesthetic drug concentrations from pharmacokinetic data. Anesthesiology. 1990;73:332–336. doi: 10.1097/00000542-199008000-00022. [DOI] [PubMed] [Google Scholar]
- Manohar M, Gustafson R, Goetz TE, Nganwa D. Systemic distribution of blood flow in ponies during 1.45%, 1.96%, and 2.39% end-tidal isoflurane–O2 anesthesia. Am. J. Vet. Res. 1987;48:1504–1510. [PubMed] [Google Scholar]
- McConaghy FF, Hodgson DR, Rose RJ, Hales JR. Redistribution of cardiac output in response to heat exposure in the pony. Equine Vet. J. Suppl. 1996:42–46. doi: 10.1111/j.2042-3306.1996.tb05030.x. [DOI] [PubMed] [Google Scholar]
- Mendell LM, Wall PD. Responses of single dorsal cord cells to peripheral cutaneous unmyelinated fibres. Nature. 1965;206:97–99. doi: 10.1038/206097a0. [DOI] [PubMed] [Google Scholar]
- Menigaux C, Guignard B, Fletcher D, Sessler DI, Dupont X, Chauvin M. Intraoperative small-dose ketamine enhances analgesia after outpatient knee arthroscopy. Anesth. Analg. 2001;93:606–612. doi: 10.1097/00000539-200109000-00016. [DOI] [PubMed] [Google Scholar]
- Muir WW3, Sams R. Effects of ketamine infusion on halothane minimal alveolar concentration in horses. Am. J. Vet. Res. 1992;53:1802–1806. [PubMed] [Google Scholar]
- Nickel R, Schummer A, Seiferle E. Lunge. In: Habermehl KH, Vollmerhaus B, Wilkens H, editors. Lehrbuch der Anatomie der Haustiere; Band II: Eingeweide. Blackwell Wissenschafts-Verlag; Berlin-Wien: 1995. pp. 255–265. [Google Scholar]
- Oye I, Paulsen O, Maurset A. Effects of ketamine on sensory perception: evidence for a role of N-methyl-d-aspartate receptors. J. Pharmacol. Exp. Ther. 1992;260:1209–1213. [PubMed] [Google Scholar]
- Parks CM, Manohar M. Distribution of blood flow during moderate and strenuous exercise in ponies (Equus caballus) Am. J. Vet. Res. 1983;44:1861–1866. [PubMed] [Google Scholar]
- Pedraz JL, Lanao JM, Hernandez JM, Dominguez-Gil A. The biotransformation kinetics of ketamine “in vitro” in rabbit liver and lung microsome fractions. Eur. J. Drug Metab. Pharmacokinet. 1986;11:9–16. doi: 10.1007/BF03189769. [DOI] [PubMed] [Google Scholar]
- Persson J, Hasselstrom J, Maurset A, Oye I, Svensson JO, Almqvist O, Scheinin H, Gustafsson LL. Pharmacokinetics and non-analgesic effects of S- and R-ketamines in healthy volunteers with normal and reduced metabolic capacity. Eur. J. Clin. Pharmacol. 2002;57:869–875. doi: 10.1007/s002280100353. [DOI] [PubMed] [Google Scholar]
- Poulin P, Krishnan K. A tissue composition-based algorithm for predicting tissue: air partition coefficients of organic chemicals. Toxicol. Appl. Pharmacol. 1996;136:126–130. doi: 10.1006/taap.1996.0015. [DOI] [PubMed] [Google Scholar]
- Price DD, Mao J, Frenk H, Mayer DJ. The N-methyl-d-aspartate receptor antagonist dextromethorphan selectively reduces temporal summation of second pain in man. Pain. 1994;59:165–174. doi: 10.1016/0304-3959(94)90069-8. [DOI] [PubMed] [Google Scholar]
- Reddy MB, Andersen ME, Morrow PE, Dobrev ID, Varaprath S, Plotzke KP, Utell MJ. Physiological modeling of inhalation kinetics of octamethylcyclotetrasiloxane in humans during rest and exercise. Toxicol. Sci. 2003;72:3–18. doi: 10.1093/toxsci/kfg001. [DOI] [PubMed] [Google Scholar]
- Scallet AC, Schmued LC, Slikker W, Jr., Grunberg N, Faustino PJ, Davis H, Lester D, Pine PS, Sistare F, Hanig JP. Developmental neurotoxicity of ketamine: morphometric confirmation, exposure parameters, and multiple fluorescent labeling of apoptotic neurons. Toxicol. Sci. 2004;81:364–370. doi: 10.1093/toxsci/kfh224. [DOI] [PubMed] [Google Scholar]
- Schwieger IM, Szlam F, Hug CC., Jr. The pharmacokinetics and pharmacodynamics of ketamine in dogs anesthetized with enflurane. J. Pharmacokinet. Biopharm. 1991;19:145–156. doi: 10.1007/BF01073866. [DOI] [PubMed] [Google Scholar]
- Spadavecchia C, Spadavecchia L, Andersen OK, Arendt-Nielsen L, Leandri M, Schatzmann U. Quantitative assessment of nociception in horses by use of the nociceptive withdrawal reflex evoked by transcutaneous electrical stimulation. Am. J. Vet. Res. 2002;63:1551–1556. doi: 10.2460/ajvr.2002.63.1551. [DOI] [PubMed] [Google Scholar]
- Spadavecchia C, Andersen OK, Arendt-Nielsen L, Spadavecchia L, Doherr M, Schatzmann U. Investigation of the facilitation of the nociceptive withdrawal reflex evoked by repeated transcutaneous electrical stimulations as a measure of temporal summation in conscious horses. Am. J. Vet. Res. 2004;65:901–908. doi: 10.2460/ajvr.2004.65.901. [DOI] [PubMed] [Google Scholar]
- Spadavecchia C, Levionnois O, Kronen PW, Leandri M, Spadavecchia L, Schatzmann U. Peri-MAC isoflurane depression of a nociceptive withdrawal reflex evoked by transcutaneous electrical stimulation in ponies. Am. J. Vet. Res. 2005;66:1992–1998. [Google Scholar]
- Theurillat R, Knobloch M, Levionnois O, Larenza P, Mevissen M, Thormann W. Characterization of the stereoselective biotransformation of ketamine to norketamine via determination of their enantiomers in equine plasma by capillary electrophoresis. Electrophoresis. 2005;26:3942–3951. doi: 10.1002/elps.200500059. [DOI] [PubMed] [Google Scholar]
- Trevor AJ, Woolf TF, Baillie TA, Adams JD, Castagnoli N. Stereoselective metabolism of ketamine enantiomers, phencyclidine and related arylcyclohexamines: present and future applications. In: Kamenka JM, Domino EF, Geneste P, editors. NPP Books. Ann Arbor: 1983. pp. 279–289. [Google Scholar]
- Wagner AE, Walton JA, Hellyer PW, Gaynor JS, Mama KR. Use of low doses of ketamine administered by constant rate infusion as an adjunct for postoperative analgesia in dogs. J. Am. Vet. Med. Assoc. 2002;221:72–75. doi: 10.2460/javma.2002.221.72. [DOI] [PubMed] [Google Scholar]
- Waterman AE. Influence of premedication with xylazine on the distribution and metabolism of intramuscularly administered ketamine in cats. Res. Vet. Sci. 1983;35:285–290. [PubMed] [Google Scholar]
- Waterman AE, Robertson SA, Lane JG. Pharmacokinetics of intravenously administered ketamine in the horse. Res. Vet. Sci. 1987;42:162–166. [PubMed] [Google Scholar]
- Werner C, Reeker W, Engelhard K, Lu H, Kochs E. Ketamine racemate and S-(+)-ketamine. Cerebrovascular effects and neuroprotection following focal ischemia. Anaesthesist. 1997;46(Suppl 1):55–60. doi: 10.1007/pl00002466. [DOI] [PubMed] [Google Scholar]
- White PF, Pudwill CR, Johnston RR, Way WL, Trevor AJ, Marietta MP. Effects of halothane anesthesia on ketamine biotransformation. Proc. West. Pharmacol. Soc. 1976;19:227–231. [PubMed] [Google Scholar]
- White PF, Way WL, Trevor AJ. Ketamine–its pharmacology and therapeutic uses. Anesthesiology. 1982;56:119–136. doi: 10.1097/00000542-198202000-00007. [DOI] [PubMed] [Google Scholar]
- White PF, Schuttler J, Shafer A, Stanski DR, Horai Y, Trevor AJ. Comparative pharmacology of the ketamine isomers. Studies in volunteers. Br. J. Anaesth. 1985;57:197–203. doi: 10.1093/bja/57.2.197. [DOI] [PubMed] [Google Scholar]
- Williams ML, Wainer IW. Role of chiral chromatography in therapeutic drug monitoring and in clinical and forensic toxicology. Ther. Drug Monit. 2002;24:290–296. doi: 10.1097/00007691-200204000-00010. [DOI] [PubMed] [Google Scholar]
- Woolf CJ, Thompson SW. The induction and maintenance of central sensitization is dependent on N-methyl-d-aspartic acid receptor activation; implications for the treatment of post-injury pain hypersensitivity states. Pain. 1991;44:293–299. doi: 10.1016/0304-3959(91)90100-C. [DOI] [PubMed] [Google Scholar]
- Wright M. Pharmacologic effects of ketamine and its use in veterinary medicine. J. Am. Vet. Med. Assoc. 1982;180:1462–1471. [PubMed] [Google Scholar]
- Yanagihara Y, Kariya S, Ohtani M, Uchino K, Aoyama T, Yamamura Y, Iga T. Involvement of CYP2B6 in n-demethylation of keta-mine in human liver microsomes. Drug Metab. Dispos. 2001;29:887–890. [PubMed] [Google Scholar]
- Zielmann S, Kazmaier S, Schnull S, Weyland A. S-(+)-ketamine and circulation. Anaesthesist. 1997;46(Suppl 1):43–46. doi: 10.1007/pl00002464. [DOI] [PubMed] [Google Scholar]