Abstract
8-anilino-1-naphthalenesulfonic acid (ANS) is believed to strongly bind cationic groups of proteins and polyamino acids through ion pair formation. A paucity of data exists on the fluorescent properties of ANS in these interactions. ANS binding to arginine and lysine derivatives was studied by fluorescence and circular dichroism spectroscopies to augment published information attained by isothermal titration calorimetry (ITC).
Fluorescence enhancement with a hypsochromic shift results from the interaction of the charged group of lysine and arginine with the sulfonate group of ANS. Ion pairing between Arg (or Lys) and the sulfonate group of ANS reduce the intermolecular charge transfer (CT) rate constant that leads to enhancement of fluorescence. A positive charge near the -NH group of ANS changes the intramolecular CT process producing a blue shift of fluorescence. The Arg side chain compared to that of Lys more effectively interacts with both the -NH and sulfonate groups of ANS. ANS binding also induces a random coil-alpha helix transition in poly-Arg.
Our data, in contrast to ITC results, indicate that electrostatic interactions between ANS derivatives and positively charged side chains do not account for binding affinity in the micromolar range. In addition to ion pairing complementary interactions, such as van der Waals, should be considered for high affinity (Kd < 1mM) external binding sites of proteins.
1. Introduction
8-anilino-1-naphthalenesulfonic acid (ANS) is an extensively utilized fluorescent probe for the characterization of protein binding sites. The literature is replete with data regarding ANS binding to buried hydrophobic sites of proteins. The observed features of ANS, a blue shift of fluorescence emission maxima and the increase of fluorescence intensity and lifetime, are generally attributed to the hydrophobicity of a binding site and the restricted mobility of ANS. However, much less attention has been paid to ANS binding to external sites of proteins, which are exposed to the aqueous phase. ANS is often considered a non-fluorescence probe when bound to the exposed binding sites of proteins. This notion is justifiable because in the measurements of steady-state fluorescence, the contribution of ANS fluorescence from the external binding sites is much less compared to that from buried sites. However, the ANS binding at external sites is easily detectable using fluorescent lifetimes despite the low steady-state fluorescence intensity. The ability to detect and characterize numerous binding sites (internal and external) for ANS provides a valuable tool for the analysis of a variety of ligands including drug molecules. For beta-lactoglobulin, the external and internal binding sites for ANS have been distinguished [1–3]. Studies of the binding energetics and crystal structure of ANS-protein complexes show that for some proteins, ANS binding depends primarily on ion pairing with positively charged side chains [4–7]. Such an electrostatic mechanism for ANS-protein binding has been demonstrated for the buried as well as external sites [2, 4–7].
The photophysical properties of ANS are complex. The quantum yield and emission energy are affected by solvent polarity and viscosity. A plot of emission energy versus solvent polarity suggests that the emission of ANS arises from two different excited states [8, 9]. Upon excitation, the molecule first reaches an excited state localized on the naphthalene ring, which has been called the nonpolar (NP) state. The emission from this state occurs in nonpolar solvents and its maximum varies modestly with polarity. In more polar solvents, the initially excited NP state undergoes an intramolecular electron-transfer reaction to form the charge-transfer state (CT) that becomes the low-energy state and emits at longer wavelengths. In aqueous solution another intermolecular electron transfer (ET) occurs that involves ionization and subsequent electron solvation. This ET process serves as an efficient mechanism for radiationless decay from the CT state, which explains the low fluorescence quantum yield of ANS [8, 9]. However, in nonaqueous polar solvents (methanol, ethanol, etc) the deactivation process through the electron transfer to solvent does not occur; the result is increased fluorescence quantum yield and lifetime [10, 11]. The lack of the intermolecular electron transfer in nonaqueous polar solvents has been attributed to the slowness of the required solvent reorientations for larger polar molecules compared to that of water molecules [11, 12].
It is well documented that a charge sign and position adjacent to the fluorescent probe may influence the intramolecular as well as the intermolecular electron transfer processes. For example, in a plot of the emission energies of TNS (2-(p-toluidinyl)naphthalene-6-sulfonic acid) versus the solvent polarity in dioxane-water mixtures, the curve is shifted entirely to higher energies compared to that of TNSMDA (6-N-4-methylphenylamino-2-naphthalenesulfonic acid N,N-dimethylamide) [13, 14]. The shift implies that an interaction of the positively charged side chains of Arg and Lys with the negatively charged sulfonate group of ANS may alter intra- and intermolecular charge transfer processes that define the fluorescence emission maximum and lifetime of the fluorescence probe.
Data from isothermal titration calorimetry (ITC) binding studies suggest that the sulfonate group in ANS interacts with the positively charged amino acids, their derivatives and polyamino acids [4]. However, there is a lack of information regarding fluorescence properties of ANS in such interactions. Here we applied the steady-state and time-resolved fluorescence to ANS binding to the positively charged amino acids, their derivatives and polyamino acids to fill this gap. The application of ANS and its “noncharge” analog, N-phenyl-1-naphthylamine (1NPN), in binding studies shed light on the contribution of sulfonate group. This system serves as a paradigm for the characterization of the external ANS binding sites of proteins.
2. Materials and methods
ANS (8-anilino-1-naphthalenesulfonic acid), derivatized amino acids (Nα-acetyl-L-arginine, Nα- acetyl-L-lysine, Nα-acetyl-L-glutamic acid, Nα-p-tosyl-L-arginine methyl ester hydrochloride and Nα-p-tosyl-L-lysine methyl ester hydrochloride), polylysine and polyarginine were purchased from Sigma. N-phenyl-1-naphthylamine (1NPN) was purchased from Invitrogen.
2.1. Steady-state fluorescence
Steady-state fluorescence measurements were made on a Jobin Yvon-SPEX (Edison, NJ) Fluorolog tau-3 spectrofluorometer, bandwidth for excitation and emission monochromators were 4 nm. The excitation λ of 350 nm was used for ANS and 1NPN fluorescence. For experiments with 1NPN, bandwidth for excitation and emission monochromators were 3 nm. 10 mM sodium phosphate, 30 mM sodium citrate and 30 mM Gly-HCl buffers were used for pH 7.3, pH 3.0, pH < 3, respectively. All measurements were conducted at room temperature. The fluorescence spectra were corrected for light scattering from buffer. For a quantum yield calculation, the fluorescence spectra were additionally corrected for the wavelength-dependent efficiency of the emission detection system. ANS fluorescence in buffer was used to estimate the fluorescence quantum yield of 1NPN. The fluorescence quantum yield of ANS was taken as 0.0032. [10, 15] To account for the cooperativity in the pH transition seen in ANS steady-state fluorescence, the data were fit to the Hill equation: where y= fluorescence intensity or λcg, x= 10−pH= [H+], K= dissociation constant, and n is the degree of cooperativity.
Fluorescence center of gravity was calculated according to:
The spectral ranges of λcg calculation for ANS and 1NPN fluorescence were 450–580 nm and 400–530 nm, respectively.
2.2. Fluorescence lifetime measurements
The fluorescence decays of ANS and 1NPN were measured using a PTI Time Master fluorescence lifetime instrument, which consists of a nitrogen laser (GL-3300) linked to a dye laser (GL 302), a frequency doubler (GL 303) and a stroboscopic detector. PBD (Exciton, Inc, Dayton, Ohio, USA) dye solution was used to obtain a wavelength of 366 nm. The 366 nm pulses (fwhm ~ 1.5 ns) were used for the excitation of the ANS and 1NPN. The decay curves were analyzed at wavelength of emission maxima. The emission monochromator slit was 3 nm. All measurements were conducted at room temperature. The instrument response function (IRF) was determined by measuring scattered light from a solution of glycogen. A DPU-15 optical depolarizer (Optics for Research, Caldwell, NJ) was placed before the emission monochromator to eliminate polarization dependence of the detection train. Each data point on a lifetime decay curve represents the average of nine laser flashes, and each decay represents 200 of these data points evenly spaced out over the collection time interval.
The intensity decay data were analyzed using the software supplied with the PTI instrument. Both a multiexponential decay law and a model free maximum entropy method (MEM) were used in the analysis. For a multiexponential decay law:
where I is fluorescence intensity, αi and τi are the normalized preexponential factors, and decay time, respectively. The fractional fluorescence intensity of each component is defined as fi = αiτiΣαiτj.
In MEM, a series of 150 exponentials, logarithmically-spaced lifetimes and variable pre-exponentials terms, were used. The criteria of the fitting procedure were the minimized chi-square function and maximized Shannon-Jaynes entropy function [16, 17].
All dissociation constants were obtained by fitting the experimental data to one binding site model with OriginLab software.
2.3. Circular dichroism
Far-UV spectra were recorded (Jasco 810 spectropolarimeter, 0.2 mm path length) using poly-Arg (0.63 mg/ml that is 4 mM in monomer equivalent) with varying concentration of ANS in 30 mM sodium citrate at pH 3.0. Eight scans from 190–260 nm were averaged.
3. Results and discussion
The negatively charged sulfonate group plays a major role in determining the fluorescence parameters of ANS. In buffer, the fluorescence lifetime and quantum yield of 1NPN, the analog of ANS that lacks sulfonate group, show significant increase compared to that of ANS (Fig. 1, Table 1). The radiative rate constant for 1NPN is of similar magnitude to that of ANS. However, the nonradiative (intermolecular CT) rate constant is smaller by a factor of ~10. The intermolecular CT is attributed to the ionization of the naphthalene group of ANS and subsequent solvation of ejected electrons. A (H2O)4±1 cluster, rather than a single molecule of water, was found to be the effective charge acceptor [10, 11]. The maximum emission wavelength of 1NPN is significantly hypsochromic compared to that of ANS. The similar results have been found for 2-AN [10]. The significance of the sulfonate group in determining the fluorescence parameter was recognized by comparison of ANS fluorescence to that of 2-AN [10]. However, the precursor 1NPN is more appropriate for comparison with ANS. These results qualitatively concur with the findings of others [10].
Figure 1.
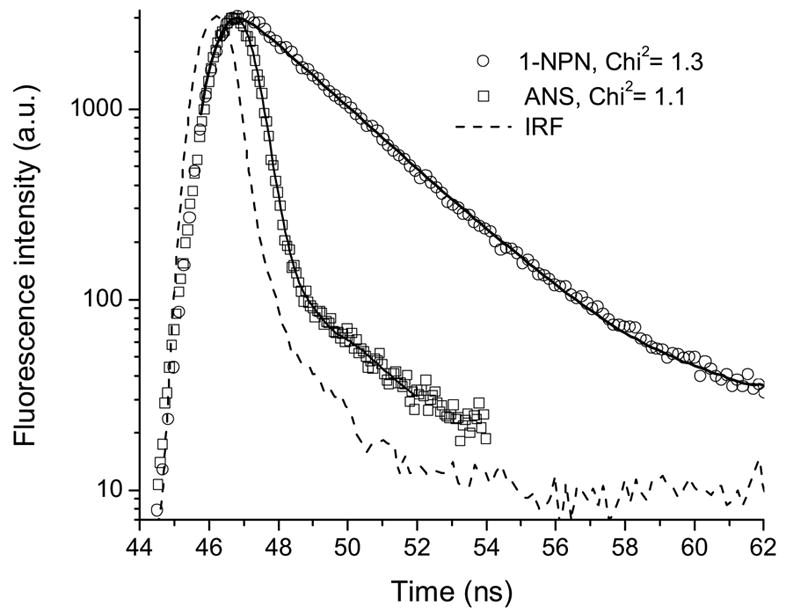
Fluorescence intensity decays of ANS and 1NPN in buffer at pH 7.3. Solid curves are the best fit for a single exponential decay.
Table 1.
Fluorescence parameter for ANS and 1NPN in buffer at pH 7.3
To test the effect of the negative charge of the sulfonate group on the fluorescence intensity and λmax, ANS fluorescence was measured at different pH values. An increase in the fluorescence intensity and a blue shift of the emission maxima at pH values lower than 2 are observed (Fig. 2). The difference spectrum (between pH 1.2 and pH 3.0) shows a fluorescence maximum at about ~458 nm (data not shown). The protonation of the sulfonate group significantly changes fluorescence properties of ANS. This point of view is consistent with the pKa value of the sulfonate group that is less than 2. Figure 2B shows cooperativity in the pH transition that can occur for many reasons including changes in water cluster formation.
Figure 2.
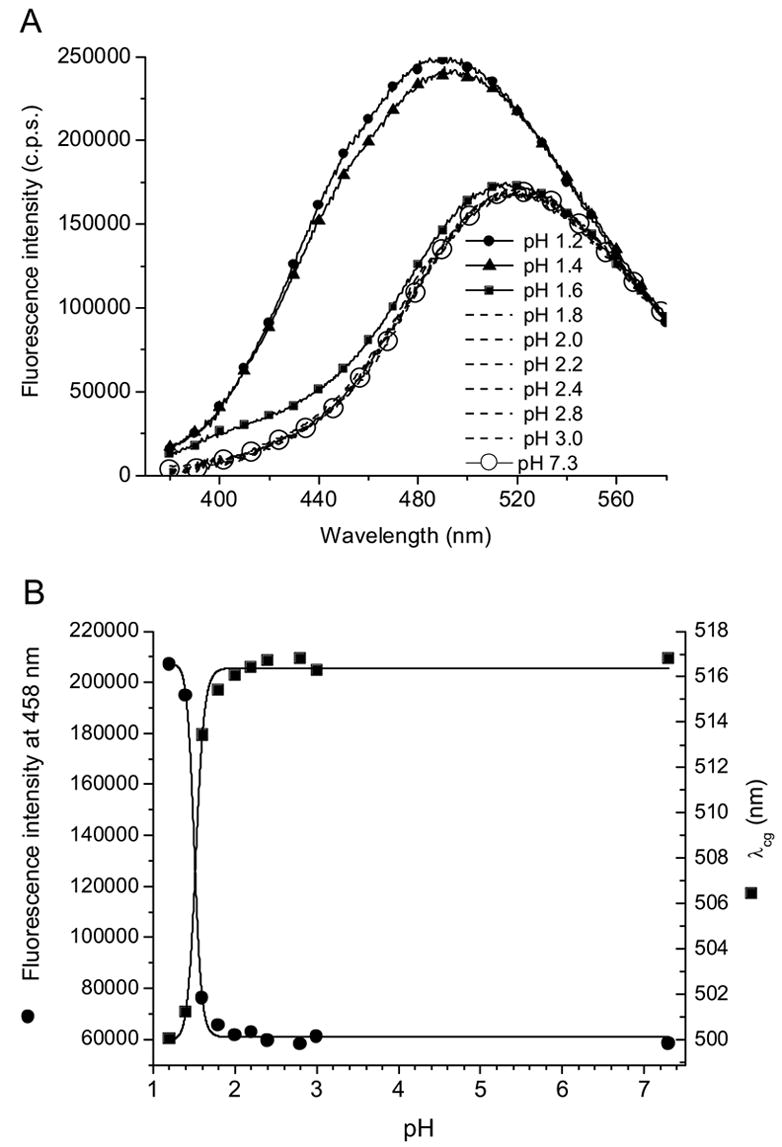
(A) ANS fluorescence spectra, (B) fluorescence center of gravity and intensity at different pH values.
Since the negatively charged sulfonate group significantly changes the fluorescence properties, we explored binding characteristics of ANS with positively charged amino acid derivatives and polyamino acids by means of fluorescence spectroscopy. The ITC study on the binding of ANS to amino acid derivatives and polyaminoacids demonstrates that the formation of a binding complex occurs through ion pair formation [4]. Therefore, an increased fluorescence intensity and blue shift of fluorescence maxima are expected in ANS binding experiments even though ANS is fully exposed to buffer.
The fluorescence spectra of ANS and 1NPN titrated with Nα -acetyl-L-arginine (Nα-Ac-Arg) and Nα -acetyl-L-glutamic acid (Nα-Ac-Glu) are shown in Fig. 3. The increase in concentration of Nα-Ac-Arg produces a commensurate increase in the fluorescence intensity of ANS. A high concentration is necessary for fluorescence spectral changes because of the very low affinity of ANS binding that is in line with previous studies [4]. The roughly estimated Kd is about 600 mM for this binding. Much less effect is observed with Nα-Ac-Glu (Fig. 3B) that carries the negatively charged side chain. The ANS fluorescence decay with a different concentration of Nα-Ac-Arg shows an additional 0.54 ns component. The increase of the fractional intensity of this component correlates with the concentration of Nα-Ac-Arg (Figure 4, Table 2). Unexpectedly, similar results were obtained for the 1NPN fluorescence probe that lacks the negatively charged sulfonate group. Therefore, the association with 1NPN, albeit weak, has to be through a mechanism other than ion pair formation. The most likely explanation for an increase of the fluorescence intensity and a blue shift of the emission maximum is the interaction of –NH group of 1NPN and –C(NH2)2+ of Arg. The increase in fluorescence intensity of ANS combined with Nα-Ac-Arg is greater than that observed with 1NPN and Nα-Ac-Arg. However, the converse is observed for hypsochromic shifts of λcg. In the presence of 520 mM Nα-Ac-Arg, the blue shifts of the fluorescence λcg for ANS and 1NPN are 3.4 nm and 7.8 nm, respectively. An increase of the ANS fluorescence is also found for ANS with Nα-Ac-Lys but the effect is smaller compared to that of Nα-Ac-Arg.
Figure 3.
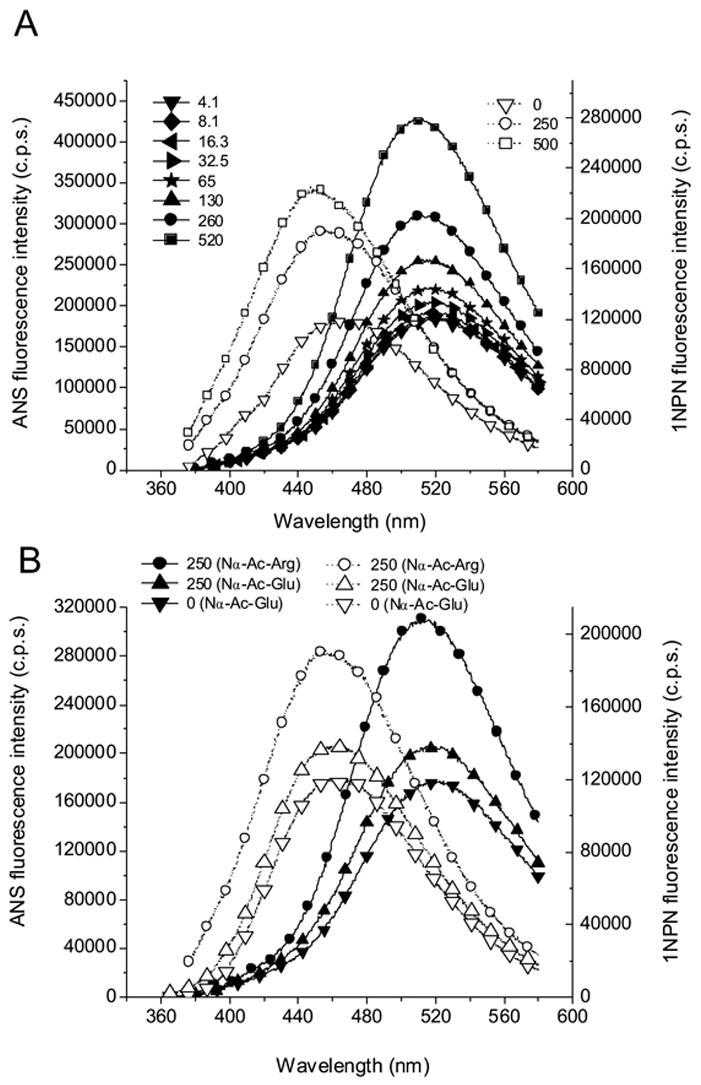
The fluorescence spectra of ANS and 1NPN titrated with Nα-Ac-Arg and Nα-Ac-Glu at pH 7.3. The numbers following the solid and open symbols represent concentration (in mM) for Nα-Ac-Arg in (A) and for the amino acid derivative as indicated in (B). The fluorescence spectra of ANS and 1NPN for Nα-Ac-Arg are shown with Nα-Ac-Glu for comparison in (B). The solid lines and symbols denote 10 μM ANS and the dashed lines and open symbols denote 5 μM 1NPN.
Figure 4.
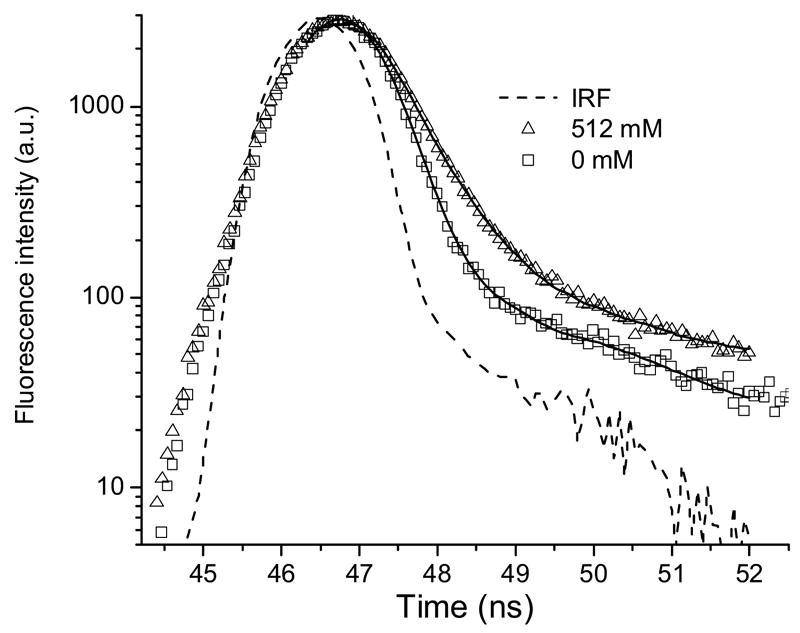
The fluorescence intensity decay of ANS (10 μM) with and without Nα-Ac-Arg at pH 7.3. Solid curves are the best fit for a double exponential decay from global analysis.
Table 2.
Fluorescence lifetime parameters of ANS- Nα-Acetyl-Arg complex from global analysis.
τ1= 0.248 ns*; τ2= 0.54 ns
| Nα-Ac-Arg (mM) | α1 | α2 | f1 | f2 | Chi2 |
|---|---|---|---|---|---|
| 0 | 1 | 0 | 1 | 0 | 1.2 |
| 64 | 0.90 | 0.10 | 0.81 | 0.19 | 1.0 |
| 128 | 0.87 | 0.13 | 0.74 | 0.25 | 1.2 |
| 256 | 0.76 | 0.24 | 0.58 | 0.41 | 1.2 |
| 512 | 0.49 | 0.51 | 0.30 | 0.70 | 1.2 |
- fixed in analysis
An ITC study showed that the presence of a tosyl group on Arg and Lys increase the respective association constants of ANS binding [4]. The fluorescence spectra of ANS titrated with Nα-p-tosyl-L-arginine methyl ester (Nα-Tos-Arg) show significant enhancement compared to the experiment with Nα-Ac-Arg (Fig. 3, 5A and 6). Similar fluorescence enhancement of ANS is observed with Nα-Tos-Lys (Fig. 6). These results are in accord with prior findings [4]. Interestingly, while the fluorescence intensity of 1NPN increased minimally, the fluorescence λcg shifts significantly in the presence of Nα-Tos-Arg compared to that of ANS (Fig. 7). Similar results were obtained with Nα-Ac-Arg. Evidently, the enhancement of fluorescence intensity and blue shift of emission maxima are governed by different photophysical processes that include the –NH and –SO3− groups of ANS, respectively. As mentioned above, the excited states of ANS and 1NPN have CT character, the electron moves from nitrogen to the naphthalene ring site. This implies that the positively charged –NH3+ (or –C(NH2)2+) positioned near –NH group of 1NPN or ANS will produce a blue shift of λcg. The mechanism of the λcg shift induced by charged amino acid residues near the NH group was described for Trp in proteins using both crystal structures and a hybrid quantum mechanical-classical molecular dynamics method [18]. In the case of ANS Arg (or Lys) interaction, an ion pairing will occur with the sulfonate group that will reduce the intermolecular CT rate constant leading to enhancement of fluorescence. One can expect that influence of –C(NH2)2+ group of Arg on a –NH group of ANS will be less that that of 1NPN. Therefore, the magnitude of a blue shift of the ANS fluorescence will be decreased.
Figure 5.
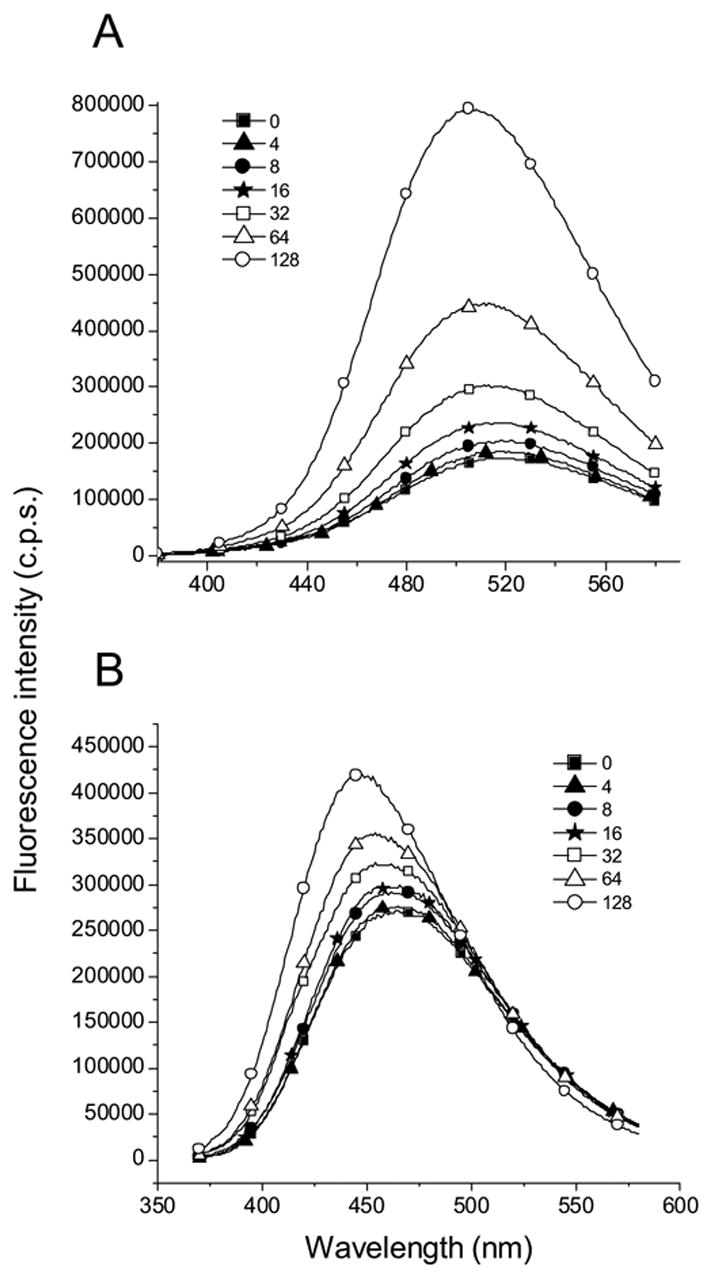
The fluorescence spectra of ANS (A) and 1NPN (B) titrated with Nα-Tos-Arg at pH 7.3. The numbers following the symbols represent concentration (in mM) of Nα-Tos-Arg. The concentration of ANS and 1NPN in this experiment is 10 μM and 5 μM, respectively.
Figure 6.
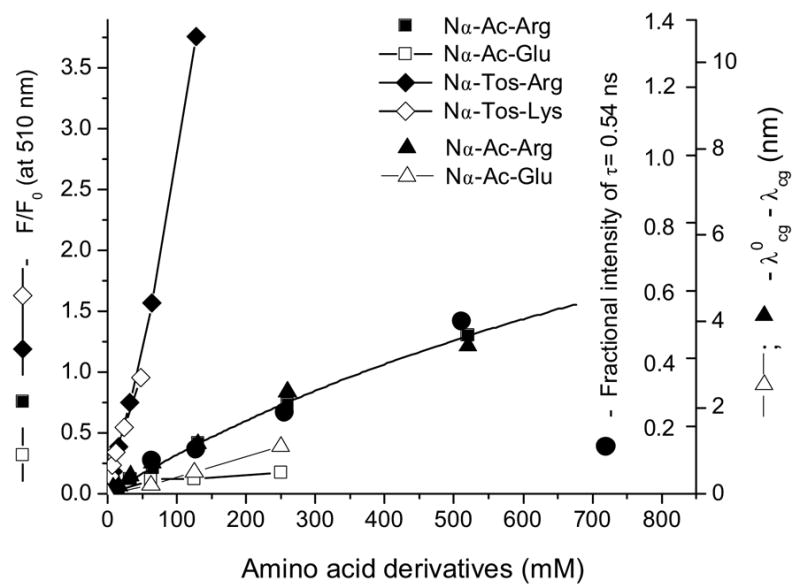
The fluorescence parameters of ANS titrated with different amino acid derivatives at pH 7.3.
Figure 7.
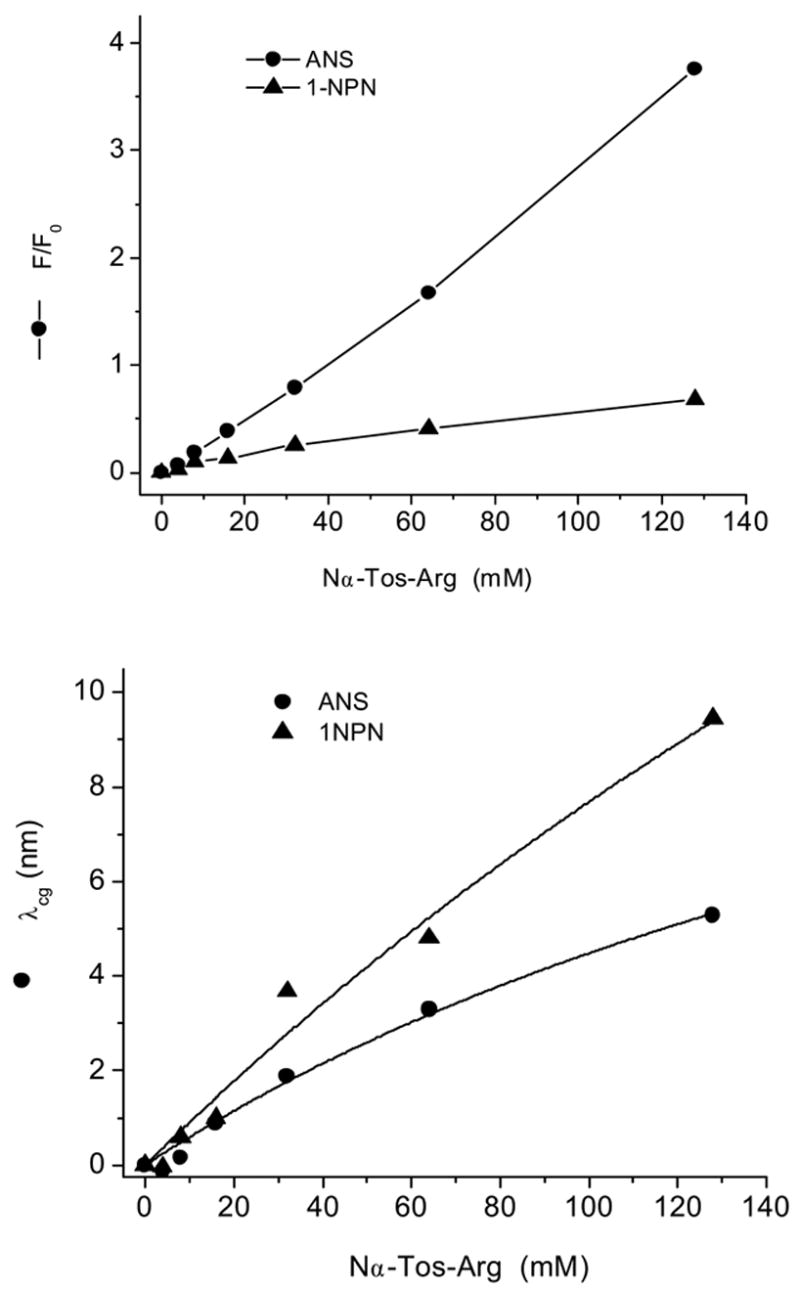
The fluorescence parameters of ANS and 1NPN titrated with Nα-Tos-Arg at pH 7.3.
The ANS interaction with poly-Arg generates the greatest changes in the fluorescence parameters. However, 1NPN fluorescence in the presence of poly-Arg exhibits subtle changes (Fig. 8). The dissociation constants for ANS binding to poly-Arg and poly-Lys are about 2.9 mM and 2.6 mM, respectively.
Figure 8.
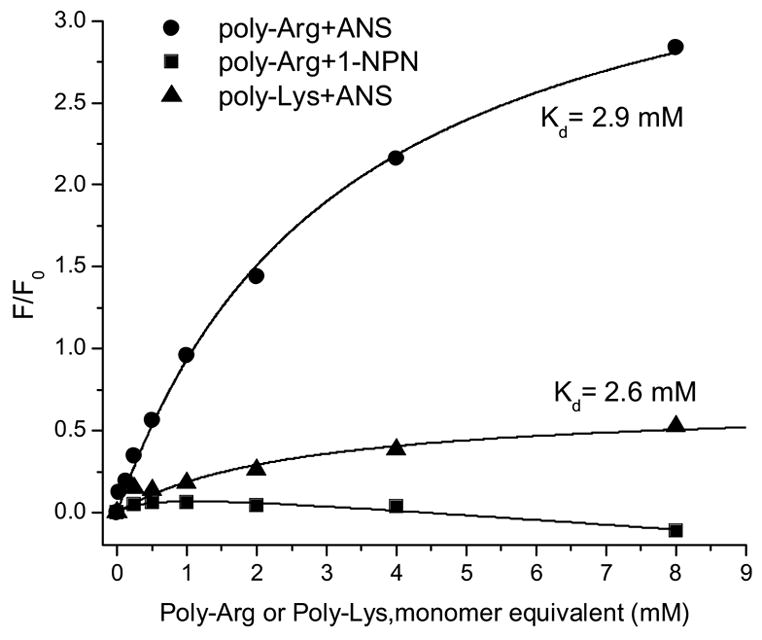
The changes in fluorescence intensity of ANS and 1NPN titrated with poly-Arg or poly-Lys at pH 3.0.
ANS binding to poly-Arg and poly-Lys shows substantial changes in the fluorescence λcg compared to the results obtained with amino acid derivatives (Fig. 9). The dissociation constant estimated for the ANS-poly-Lys interaction from changes of λcg is identical to that calculated from fluorescence intensity. However, Kd values for poly-Arg are different, but have same order of magnitude. The ANS-poly-Arg interaction was also studied by time-resolved fluorescence since this interaction gave the greatest effect on the fluorescence. The increased concentration of poly-Arg causes a commensurate rise of the ANS fluorescence lifetime (Fig. 10 and 11). The fluorescence decay curves could not be fit satisfactorily by global analysis with two lifetimes. Figure 11 illustrates the fluorescence lifetime parameters obtained from a two exponential decay analysis. It is evident that both lifetimes of ANS fluorescence increase at higher concentration of poly-Arg covering ranges 0.25–0.65 ns and 1.83–2.44 ns. The Kd of 1.5 mM is estimated from preexponential factors of the fluorescence lifetimes. This value remains within the range obtained by other two binding parameters mentioned above. The average Kd estimated by all three methods is 1.7± 0.6 mM. The reliability of the two exponential model for the fluorescence lifetime analysis was tested by model free MEM analysis. The results of MEM are similar to that of the two exponential model (Fig. 12). The species with the short lifetime component, 0.25–0.65 ns, is designated as free or weakly bound ANS.
Figure 9.
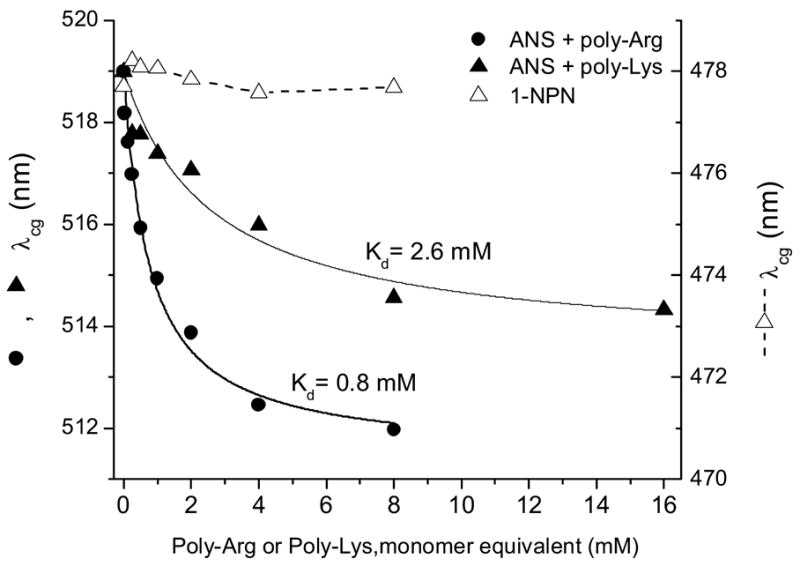
The changes in fluorescence λcg of ANS and 1NPN titrated with poly-Arg or poly-Lys at pH 3.0.
Figure 10.
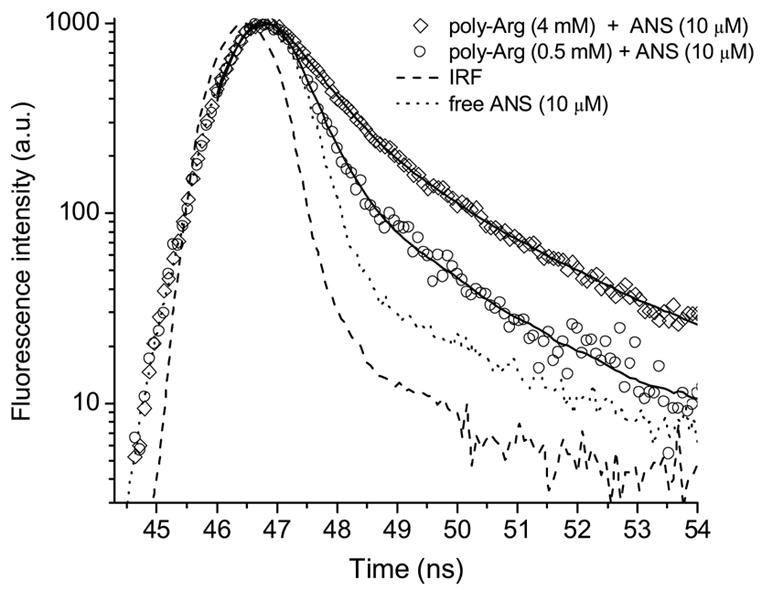
The fluorescence intensity decay of ANS titrated with poly-Arg at pH 3.0. Solid curves are the best fit for a double exponential decay.
Figure 11.
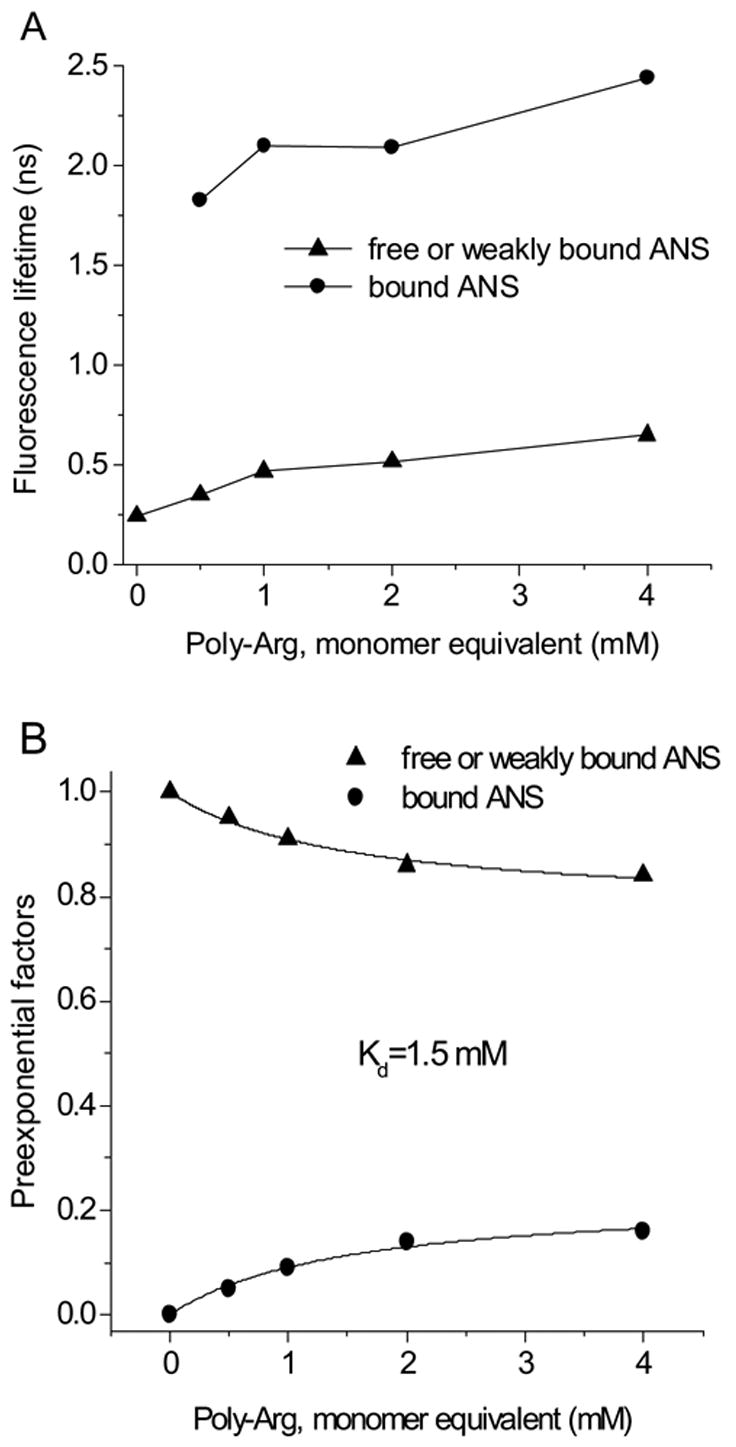
The fluorescence lifetime (A) and preexponential factors (B) of ANS titrated with poly-Arg at pH 3.0 derived from a double exponential decay time fit.
Figure 12.
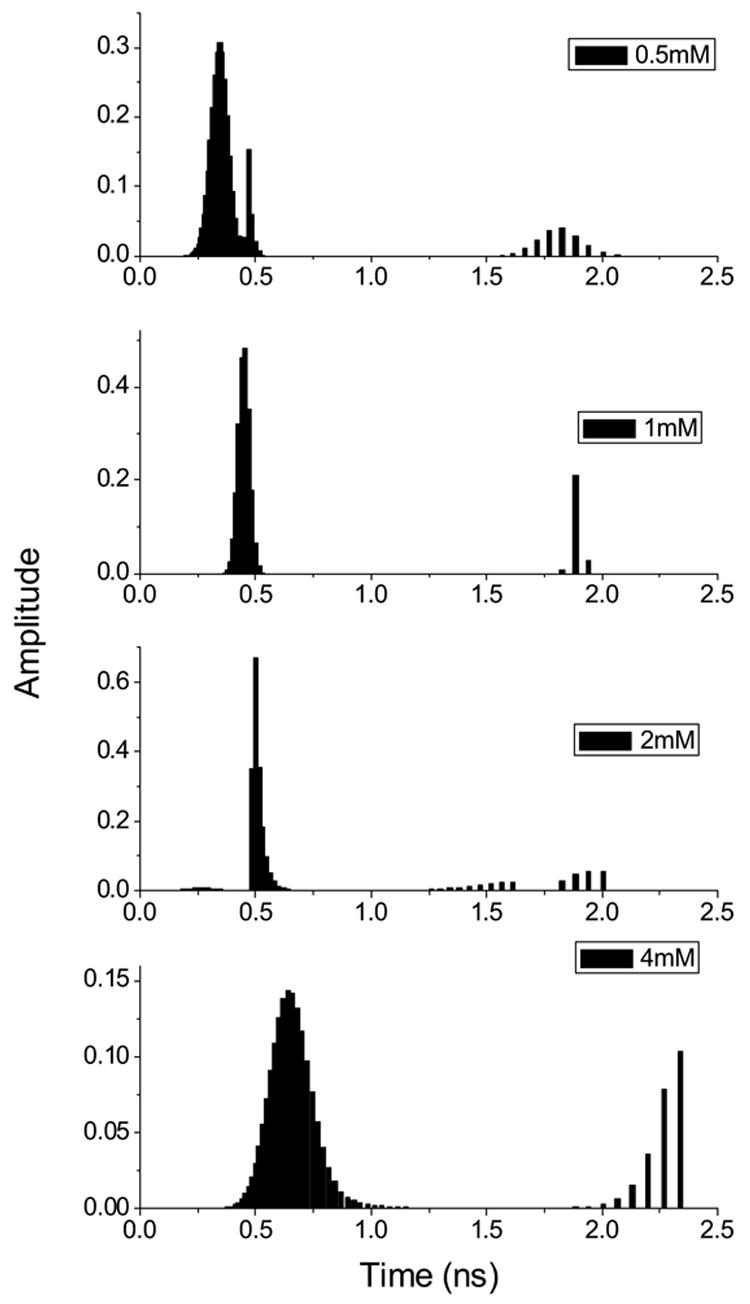
The fluorescence lifetime distribution for ANS (10 μM) with varying concentration of poly-Arg at pH 3.0 by MEM decay analysis. The numbers on the figure represent concentration of poly-Arg in monomeric equivalent. Chi2 values in the fitting procedure were within the range of 1.0–1.2.
It is well documented that poly-Lys, which is similar to poly-Arg, forms a random coil conformation when the side chains are charged (pH 5.7). At pH 11, poly-Lys in an uncharged form undergoes a random coil-alpha helix transition [19]. ANS interacts with poly-Arg via ion pair formation, which will reduce electrostatic repulsion of the Arg side chains. Therefore, ANS binding may induce alpha helix formation by a similar mechanism observed in a high pH transition. Indeed, addition of ANS to poly-Arg solution induces alpha helix in a dose dependent manner (Fig. 13). A CD spectrum of poly-Arg represents the characteristic random coil conformation with strong negative band about 197.4 nm. The weak positive band at 217 nm is also evident from Fig. 13. The difference CD spectra of poly-Arg induced by ANS binding have the characteristic features of an alpha helix conformation (Fig. 13, inset). Two minima at 207 nm and 223 nm (derived from second derivative of CD spectrum) are well known features of polypeptide chains with alpha helical conformation. The molar ellipticities of alpha helix at 222 nm and that of random coil at 197 nm are almost identical [19]. The difference CD spectra induced by ANS are minimally distorted at 223 nm since the contribution of random coil CD at this wavelength is about one order magnitude lower than that at 197 nm. Therefore, we used ellipticity values at 223 nm (difference CD) and 197 nm to calculated alpha helical content of poly-Arg-ANS complex. The addition of 0.8 mM ANS to 4mM poly-Arg induces about 0.384 mM (monomer equivalent) alpha helix. Assuming that the Kd of this binding is 1.7 mM one can find that 0.55 mM ANS out of 0.8 mM will be in the bound form, resulting in [ANS bound]/[alpha helix] = 1.4. Even though this value is an approximation, the stoichiometry is consistent with every Arg side chain of the alpha helix complexed to ANS.
Figure 13.
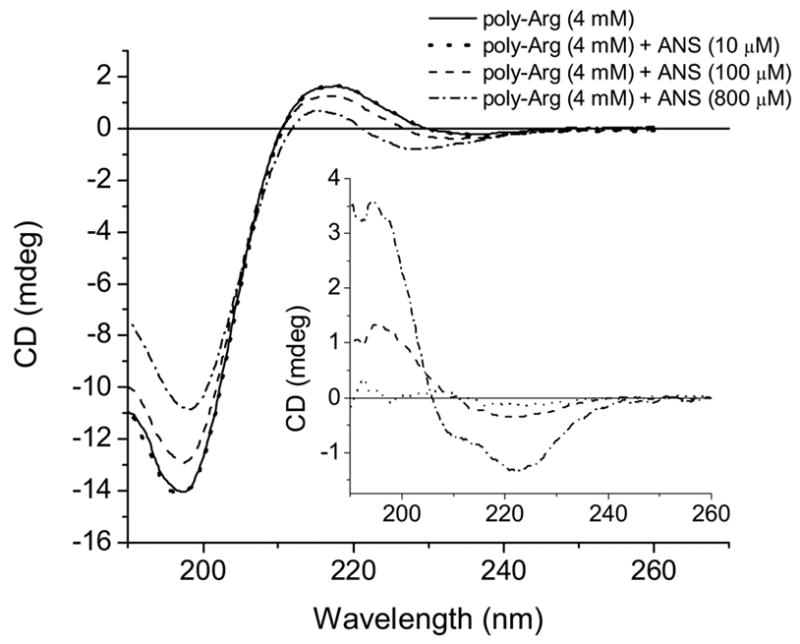
CD spectra of poly-Arg titrated with ANS at pH 3.0. Inset- difference CD spectra induced by 10 μM (dotted line), 100 μM (dashed line) and 800 μM (dash-dotted line) ANS at pH 3.0.
The estimated Kd values for poly-Arg and poly-Lys are about ~760 and 50 fold higher than that observed by Matulis and Lovrien [4]. However, there are important differences in the experimental conditions used. In the ITC experiments, heat generation did not fully develop until ANS was added in an amount ν ≥ 0.3 where ν = molar ratio ANS/Lys or Arg side chains [4]. Our titration experiments were conducted under conditions where 0.001<ν <0.3. Another difference is that precipitation of ANS polyamino acid complexes occurred in the ITC experiment for the data range of 0.5<ν <2 that was used for calculation of Kd. In the CD experiment [ANS]/[poly-Arg] value does not exceed 0.2; precipitation does not occur at the chosen experimental conditions. Therefore, in the ITC experiments [4], the thermodynamic parameters (therefore the Kd) for ANS and poly-Arg interaction were affected by a random coil-alpha helix transition as well as the association of poly-Arg-ANS complexes.
An ion pair formation has been shown to occur in most cases of ANS protein interaction, especially for external binding sites [4–7]. However, the ion pair formation that includes Arg or Lys residues are insufficient to account for a Kd of less 600 mM. An additional group is needed to stabilize the ion pair that includes ANS and a positively charged side chain of proteins. The tosyl group enhances the binding of ANS to Arg, it is not due to the sulfonate group because a blue shifted emission is also observed for 1NPN and the tosyl derivative of Arg. Only poly-Arg and poly-Lys show sulfonate driven binding to ANS that result in an increased fluorescence intensity, lifetime and blue shift of λcg.
It is interesting to note that both an enhancement of the fluorescence intensity and blue shift of λcg are higher in magnitude for the Arg-ANS complex compared to that of Lys-ANS. This finding implies that –NH and –SO3− groups of ANS are more affected by the complex formation with Arg than with Lys. Indeed, as an example, analysis of the crystal structures of ANS-protein complexes (Fig. 14) reveal that the Arg side chain is positioned to more effectively interact with both –NH and –SO3− groups of ANS [7]. The Lys-ANS complex is stabilized with van der Waals interaction between carbohydrate groups of the naphthalene ring and the side chain of Lys in addition to the contribution from ion pairing (Fig. 14). It is evident that –NH3+ group of Lys is positioned away from –NH of ANS and will have less impact on intramolecular CT.
Figure 14.
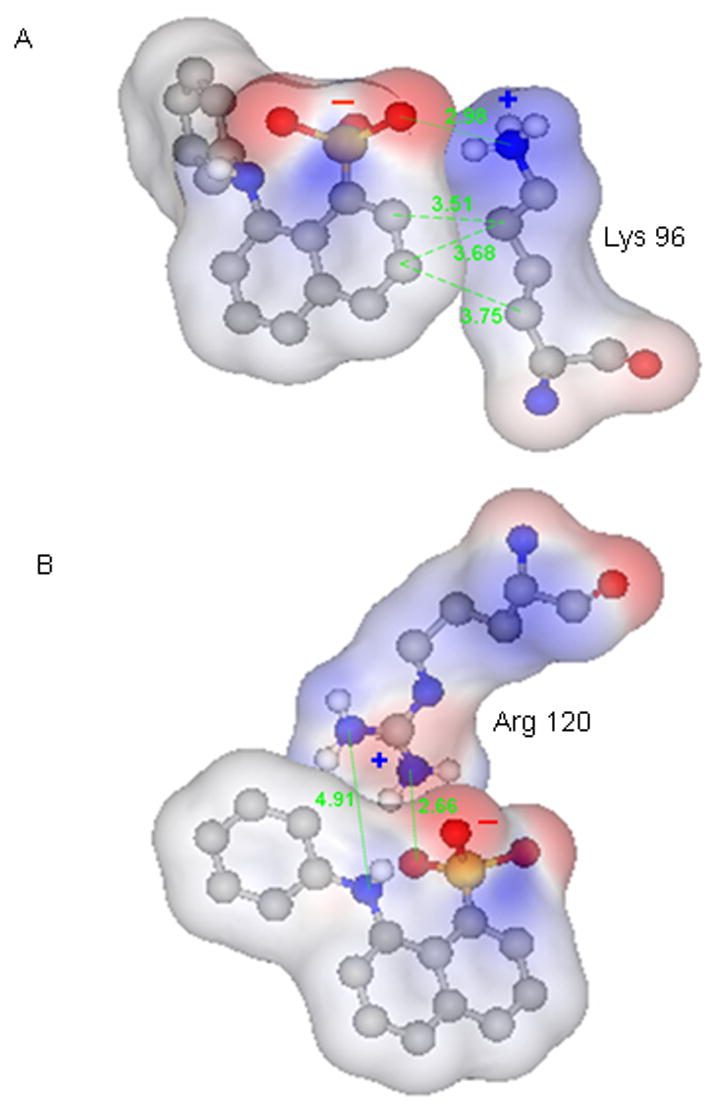
ANS-Lys (A) and ANS-Arg (B) complexes from crystal structures of SPE 16 (PDB: 1TXC, to be published) and antibiotic target MurA (PDB: 1EYN, [7]), respectively. Gray, blue, red, yellow and white balls represent carbon, nitrogen, oxygen, sulfur and hydrogen atoms, respectively. The numbers represent distances between the atoms in Å.
The effectiveness of the intermolecular CT in aqueous solution is attributed to fast reorientation rate of water molecules in the vicinity of ANS [10]. The movement and reorientation of water molecules near the protein surface are decreased compared to that in the bulk. Therefore, water reorientation dynamics (equivalent to cluster formation dynamics) around ANS molecules bound to the protein surface will be slower even at a fully exposed site. Decreased reorientation dynamics will decrease the intermolecular CT rate and result in increased fluorescence. This is an additional mechanism for the fluorescence enhancement of ANS bound to the protein surface.
Our data indicate that electrostatic interactions between ANS derivatives and positively charged side chains do not account for binding affinity in the micromolar range. In addition to ion pairing, complementary interactions such as van der Waals should be considered for high affinity (Kd < 1mM) external binding sites of proteins.
The binding constants of ligand-protein complexes are often estimated by the diminution of fluorescence upon displacement of bound ANS from a presumed hydrophobic site. External binding of ANS in certain circumstances generates low steady-state fluorescence and therefore may be overlooked. Likewise, the ligand may displace ANS from the external binding site and may be undetected. The implications from the data here are that careful assessment of fluorescent lifetimes parameters may reveal significant external binding to proteins that otherwise would be undetected.
The utilization of ANS to identify a molten globule state of a particular protein should be performed with the understanding of the mechanisms that influence non-radiative decay and structural changes that can be induced by ANS. Amino acids, such as lysine and arginine when sequentially positioned in the protein may interact with ANS and induce the secondary structure formation. The result may be the establishment of side chain interactions and induction of oligomers, which could dramatically influence fluorescence parameters.
Acknowledgments
Supported by U.S. Public Health Service Grants NIH EY-11224 and EY00331 as well as the Edith and Lew Wasserman Endowed Professorship in Ophthalmology.
Footnotes
Publisher's Disclaimer: This is a PDF file of an unedited manuscript that has been accepted for publication. As a service to our customers we are providing this early version of the manuscript. The manuscript will undergo copyediting, typesetting, and review of the resulting proof before it is published in its final citable form. Please note that during the production process errors may be discovered which could affect the content, and all legal disclaimers that apply to the journal pertain.
References
- 1.Collini M, D’Alfonso L, Baldini G. New insight on beta-lactoglobulin binding sites by 1-anilinonaphthalene-8-sulfonate fluorescence decay. Protein Sci. 2000;9:1968–1974. doi: 10.1110/ps.9.10.1968. [DOI] [PMC free article] [PubMed] [Google Scholar]
- 2.Collini M, D’Alfonso L, Molinari H, Ragona L, Catalano M, Baldini G. Competitive binding of fatty acids and the fluorescent probe 1-8-anilinonaphthalene sulfonate to bovine beta-lactoglobulin. Protein Sci. 2003;12:1596–1603. doi: 10.1110/ps.0304403. [DOI] [PMC free article] [PubMed] [Google Scholar]
- 3.D’Alfonso L, Collini M, Baldini G. Evidence of heterogeneous 1-anilinonaphthalene-8-sulfonate binding to beta-lactoglobulin from fluorescence spectroscopy. Biochim Biophys Acta. 1999;1432:194–202. doi: 10.1016/s0167-4838(99)00105-3. [DOI] [PubMed] [Google Scholar]
- 4.Matulis D, Lovrien R. 1-Anilino-8-naphthalene sulfonate anion-protein binding depends primarily on ion pair formation. Biophys J. 1998;74:422–429. doi: 10.1016/S0006-3495(98)77799-9. [DOI] [PMC free article] [PubMed] [Google Scholar]
- 5.Ory JJ, Banaszak LJ. Studies of the ligand binding reaction of adipocyte lipid binding protein using the fluorescent probe 1, 8-anilinonaphthalene-8-sulfonate. Biophys J. 1999;77:1107–1116. doi: 10.1016/S0006-3495(99)76961-4. [DOI] [PMC free article] [PubMed] [Google Scholar]
- 6.Lartigue A, Gruez A, Spinelli S, Riviere S, Brossut R, Tegoni M, Cambillau C. The crystal structure of a cockroach pheromone-binding protein suggests a new ligand binding and release mechanism. J Biol Chem. 2003;278:30213–30218. doi: 10.1074/jbc.M304688200. [DOI] [PubMed] [Google Scholar]
- 7.Schonbrunn E, Eschenburg S, Luger K, Kabsch W, Amrhein N. Structural basis for the interaction of the fluorescence probe 8-anilino-1-naphthalene sulfonate (ANS) with the antibiotic target MurA. Proc Natl Acad Sci U S A. 2000;97:6345–6349. doi: 10.1073/pnas.120120397. [DOI] [PMC free article] [PubMed] [Google Scholar]
- 8.Kosower EM, Kanety H. Intramolecular donor-acceptor systems. 10. Multiple fluorescence from 8-(phenylamino)-1-naphthalenesulfonates. J Am Chem Soc. 1983;105:6236–6243. [Google Scholar]
- 9.Kosower EM. Excited state electron and proton transfers. Ann Rev Phys Chem. 1986;37:127–156. [Google Scholar]
- 10.Lee J, Robinson GW. Electron hydration dynamics using the 2-anilinonaphthalene precursor. J Am Chem Soc. 1985;107:6153–6156. [Google Scholar]
- 11.Moore RA, Lee J, Robinson GW. Hydration dynamics of electrons from a fluorescent probe molecule. J Phys Chem. 1985;89:3648–3654. [Google Scholar]
- 12.Kenney-Wallace GA, Jonah CD. Picosecond molecular relaxations during electron solvation in liquid alcohol and alcohol-alkane solutions. Chem Phys Lett. 1976;39:596–600. [Google Scholar]
- 13.Kosower EM, Dodiuk H, Tanizawa K, Ottolenghi M, Orbach N. Intramolecular donor-acceptor systems. Radiative and nonradiative processes for the excited states of 2-n-arylamino-6-naphthalenesulfonates. J Am Chem Soc. 1975;97:2167–2178. [Google Scholar]
- 14.Huppert D, Kanety H, Kosower EM. Kinetic studies on intramolecular electron transfer in solution. Chem Phys Lett. 1981;84:48–53. [Google Scholar]
- 15.Turner DC, Brand L. Quantitative estimation of protein binding site polarity. Fluorescence of N-arylaminonaphthalenesulfonates. Biochemistry. 1968;7:3381–3390. doi: 10.1021/bi00850a011. [DOI] [PubMed] [Google Scholar]
- 16.Skilling J, Bryan RK. Maximum entropy image reconstruction: general algorithm. Mon Not R Astron Soc. 1984;211:111–124. [Google Scholar]
- 17.Livesey AK, Brochon JC. Analyzing the distribution of decay constants in pulse-fluorimetry using the maximum entropy method. Biophys J. 1987;52:693–706. doi: 10.1016/S0006-3495(87)83264-2. [DOI] [PMC free article] [PubMed] [Google Scholar]
- 18.Vivian JT, Callis PR. Mechanisms of tryptophan fluorescence shifts in proteins. Biophys J. 2001;80:2093–2109. doi: 10.1016/S0006-3495(01)76183-8. [DOI] [PMC free article] [PubMed] [Google Scholar]
- 19.Fasman GD, editor. Circular dichroism and the conformational analysis of biomolecules. Plenum Press; New York: 1996. [Google Scholar]


