

Summary
Progenitors within the ventral telencephalon can generate GABAergic neurons and oligodendrocytes, but regulation of the neuron-glial switch is poorly understood. We investigated the combinatorial expression and function of Dlx1&2, Olig2, and Mash1 transcription factors in the ventral telencephalon. We show that Dlx homeobox transcription factors, required for GABAergic interneuron production, repress oligodendrocyte precursor cell (OPC) formation by acting on a common progenitor to determine neuronal versus oligodendroglial cell fate acquisition. We demonstrate that Dlx1&2 negatively regulate Olig2-dependant OPC formation and Mash1 promotes OPC formation by restricting the number of Dlx+ progenitors. Progenitors transplanted from Dlx1&2 mutant ventral telencephalon into newborn wild-type mice do not produce neurons but differentiate into myelinating oligodendrocytes that survive into adulthood. Our results identify a new role for Dlx genes as modulators of neuron versus oligodendrocyte development in the ventral embryonic forebrain.
Introduction
Neural development requires mechanisms for segregation of appropriately sized progenitor pools for specialized neuronal and glial subtypes. For example, ventral telencephalic progenitor cells that reside in spatially restricted germinal zones within the lateral ganglionic eminence (LGE), medial ganglionic eminence (MGE), and anterior entopeduncular area (AEP) give rise to GABAergic and cholinergic neurons and oligodendrocytes (Le Bras et al., 2005; Miller, 2002; Wonders and Anderson, 2006). Thus, the ventral telencephalon provides a suitable model system to address whether a common progenitor gives rise to neurons and glia, and what factors might regulate neuron-glial fate decisions.
The majority of telencephalic GABAergic interneurons arise from the ganglionic eminences and AEP, and migrate as post-mitotic cells to the basal ganglia and cortex (for review, see Marin et al., 2000; Wonders and Anderson, 2006). Transcription factors Nkx2.1 and Gsh2, as well the signaling molecules Sonic hedgehog (Shh) and fibroblast growth factors (FGFs), establish the regional identity of the ganglionic eminences and AEP (Wonders and Anderson, 2006). The Dlx family of homeobox transcription factors (Dlx1, Dlx2, Dlx5, and Dlx6), are necessary for progenitors within these regions to differentiate into GABAergic neurons (Panganiban and Rubenstein, 2002). Dlx1 and Dlx2 are functionally redundant, since Dlx1−/− and Dlx2−/− mice show only minor deficiencies in GABAergic neuron formation (Anderson et al., 1997b; Cobos et al., 2005), whereas Dlx1&2 double mutants have pervasive defects in the development of these neurons (Anderson et al., 1997b).
Oligodendrogenesis within the mouse telencephalon commences in the MGE and AEP around embryonic day (E)11.5 when multipotent progenitors give rise to precursors that are restricted to the oligodendroglial lineage: oligodendrocyte precursor cells (OPCs) (Kessaris et al., 2006; Nery et al., 2001; Parras et al., 2007; Rowitch, 2004; Tekki-Kessaris et al., 2001). OPCs are mitotically active cells that have migrated out of the VZ and are characterized by a combination of Sox10 and Pdgfra expression. OPCs migrate into the cerebral cortex around E15, and differentiate into myelinating oligodendrocytes postnatally (Kessaris et al., 2006). A secondary wave of OPC formation occurs in the LGE around E16, and after birth cortical progenitors contribute OPCs for ongoing turnover and repair (Kessaris et al., 2006; Menn et al., 2006). Whereas Pdgfra and Sox10 expression in the embryonic forebrain are specific to the oligodendrocyte lineage, Olig1 and Olig2 are also expressed in multipotent progenitors (Rowitch, 2004). As oligodendrocytes continue to differentiate, they express NKX2.2, O4, O1, CNPase, and eventually mature oligodendrocytes produce proteolipid protein (PLP) and myelin basic protein (MBP) (Rowitch, 2004; Woodruff et al., 2001).
Early OPC development requires Shh signaling (Alberta et al., 2001; Nery et al., 2001; Sussman et al., 2002; Tekki-Kessaris et al., 2001), whereas later stages are likely Shh-independent (Cai et al., 2005; Vallstedt et al., 2005). Molecular targets of early Shh signaling include the bHLH proteins Olig1 and Olig2 (Lu et al., 2000) that together are required for OPC specification and maturation throughout the central nervous system (Lu et al., 2002; Zhou and Anderson, 2002). Identification of Olig molecular interactions and gene targets are active areas of study (Lee et al., 2005; Samanta and Kessler, 2004; Sun et al., 2003).
In the embryonic ventral spinal cord, motor neurons and oligodendrocytes derive from a common progenitor pool, suggesting that these lineages share intrinsic and extrinsic regulatory mechanisms (Lu et al., 2002; Rowitch et al., 2002; Takebayashi et al., 2002; Zhou and Anderson, 2002). Similarly, in the dorsal spinal cord, Mash1+ progenitors become dorsal horn neurons and late-born oligodendrocytes (Battiste et al., 2007). Control of the neuron-glial switch in the ventral spinal cord involves down-regulation of the proneural protein NGN2 (Zhou et al., 2001) and Notch signaling (Park and Appel, 2003) as well as the pro-glial activity of Sox9 (Stolt et al., 2003) and others (Deneen et al., 2006); for review see Rowitch, 2004).
Regulation of the neuron-glial switch in the forebrain is less well understood. Clonal analysis has shown that OPCs and GABAergic neurons likely derive from a common progenitor (He et al., 2001; Yung et al., 2002). Analysis of Dlx2/tauLacZ mice suggests that some OPCs derive from Dlx2-positive precursors (Marshall and Goldman, 2002); however, the role of Dlx genes in oligodendrocyte development is unknown. Mash1 has been implicated in regulating neurogenesis and oligodendrogenesis in the telencephalon (Parras et al., 2007), and function of this gene is necessary for development of neurons and perinatal oligodendrocytes in the olfactory bulb (Casarosa et al., 1999; Horton et al., 1999; Parras et al., 2004). There is evidence for cross-regulation between Mash1 and the Dlx genes: Mash1 binds to regulatory DNA elements in the intergenic region of Dlx1 and Dlx2 (Parras et al., 2007), Dlx1 and Dlx2 expression is expanded in the ventricular zone (VZ) and subventricular zone (SVZ) in Mash1 mutants (Casarosa et al., 1999; Horton et al., 1999; Poitras et al., 2007; Yun et al., 2002), and Mash1 expression is increased in the VZ and SVZ in Dlx1&2 mutants (Yun et al., 2002).
In this study, we describe the combinatorial expression and function of Dlx1&2, Olig2, and Mash1 in the germinal zones of the MGE and AEP. We show that Dlx1&2 repress OPC formation in the ventral forebrain by negatively regulating Olig2 expression. Furthermore, we show that Mash1 promotes OPC formation by restricting the number of Dlx+ progenitors. We establish that Dlx1&2 can act cell-autonomously to repress OLIG2 expression. Lastly, we show using cell-transplantation experiments that progenitors from Dlx1&2 mutants do not produce neurons, but generate OPCs that are able to migrate and differentiate into myelinating oligodendrocytes that persist in the adult. Thus, our data establish a role for Dlx genes in a hierarchy of transcription factors regulating the balance between neurogenesis and oligodendrogenesis in the forebrain.
Results
OLIG2 and DLX2 are co-expressed in restricted populations of telencephalic progenitors
To determine if neuron versus oligodendrocyte cell fate decisions were being made in identical or non-overlapping progenitors of the developing telencephalon, we investigated expression of DLX2 and OLIG2 proteins by double immunofluorescence analysis and confocal microscopy. DLX1 and DLX2 are largely co-expressed in the subpallial VZ/SVZ (Eisenstat et al., 1999). Within the LGE and MGE at E12.5, DLX2 is expressed in scattered cells within the VZ, the primary progenitor zone, and in most cells within the SVZ, the secondary progenitor zone, suggesting DLX proteins segregate to differentiating cells (Figure 1A) (Eisenstat et al., 1999; Yun et al., 2002). The SVZ can be subdivided into SVZ1 and SVZ2 based on the density of proliferating cells: the SVZ1 has a higher density of mitotic cells while the SVZ2 contains relatively more differentiated cells (Figure S1). In contrast to DLX2, OLIG2 expression is higher in the MGE than the LGE. In the MGE, the greatest number of OLIG2+ cells is found in the VZ, where they comprise more than 90% of cells. The proportion of OLIG2+ cells declines to ~50% in SVZ1 and ~20% in SVZ2 (Figure 1A′ and 1C).
Figure 1. Molecular characterization of medial ganglionic eminence progenitors.

(A–B) E12.5 coronal section through mouse forebrain showing DLX2 (red), OLIG2 (green) and MASH1 (blue) as visualized by indirect immunofluorescence at the level of the MGE and LGE. (A′–B′) Higher magnification view of the ventromedial MGE, boxed region in (A–B), with the VZ, SVZ1 and SVZ2 labeled. (C) Graphical illustration of the percent contribution of DLX2, OLIG2, and MASH1 expressing cells in the VZ, SVZ1 and SVZ2 determined from (A′) and (B′). Four main colors in the graph represent population of cells that express either OLIG2 (green), DLX2 (red), OLIG2 and DLX2 (yellow) and MASH1 (blue). Shaded portion of the colored bars represent subpopulations within the groups that co-express MASH1.
(A′, C) OLIG2 expression is high in the MGE, where nearly all VZ cells are OLIG2+, and lower in the LGE. DLX2 expression is high in both the LGE and MGE. DLX2 is expressed in ~50% of cells in VZ of the MGE, where it is largely co-expressed with OLIG2. DLX2 expression increases to ~90% of cells in the SVZ, while OLIG2 expression progressively decreases to ~50% in SVZ1 and ~20% in SVZ2. OLIG2+/DLX2+ population declines to less than 10% of cells in the SVZ2. Thus, there is a reciprocal relationship between OLIG2 and DLX2 expression as cells migrate from the VZ to SVZ2, and begin to differentiate. (B′–C) Most MASH1+ cells express DLX2 in the VZ and SVZ of the ventromedial MGE. Note the two main populations of cells in the VZ: OLIG2+/DLX2+/MASH1+ and OLIG2-only. These populations combined decrease to less than 20% of cells in the SVZ2, as the proportion of DLX2+ cells increases. Also, proportion of DLX2+ cells expressing MASH1 declines to ~60% in the SVZ1 and ~35% in the SVZ2.
Nearly all cells in the MGE VZ express OLIG2 as early as E10.5, while DLX2 expression is initiated in a few VZ cells at this time-point (Figure S2). By E12.5, DLX2 is expressed in ~50% of OLIG2+ VZ cells (Figure 1A′ and 1C and Figure S3). In the SVZ, as the number of OLIG2+ cells decreases, an increasing number of cells express DLX2, such that DLX2+/OLIG2− cells makeup more than 80% of cells in SVZ2 (Figure 1A′ and 1C). Concurrently, the population of OLIG2+/DLX2+ cells declines to less than 10% in the SVZ2. In the mantle, only rare cells co-express DLX2 and OLIG2, while the vast majority express either DLX2 or OLIG2. Thus, there is a reciprocal relationship between OLIG2 and DLX2 expression as cells born in the MGE migrate through the progenitor zones and begin to differentiate. The distribution of MASH1 expression within MGE progenitor zones will be described later in this study.
At later embryonic ages (E15.5 and E18.5), the pattern of OLIG2 and DLX2 expression between the VZ, SVZ and mantle of the MGE is qualitatively similar to E12.5 (Figure 2A–2C). However, Dlx2 transcript and protein expression in the VZ/SVZ is reduced at E18.5 compared to E12.5 particularly within the MGE/AEP (Figure S4 and Figure 2C′). VZ cells are mostly OLIG2+/DLX2− in even greater proportions than at earlier embryonic stages, while the SVZ consists of a heterogeneous population comprised of transitional DLX2+/OLIG2+ as well as OLIG2+ and DLX2+ cells. Co-expression of OLIG2 and DLX2 is also evident in other germinal zones, including AEP, LGE, CGE, and septum (Figure 2). Outside of the germinal zones in the E15.5 and E18.5 telencephalon, DLX2 and OLIG2 are expressed in the striatum and cortex, as well as in axon tracts, such as the anterior commissure, corpus callosum, and stria terminalis. However, in these regions, DLX2 and OLIG2 are not co-expressed (Figure 2B–2C).
Figure 2. DLX2 and OLIG2 are co-expressed in VZ/SVZ cells but not in cells within the cortex or fiber tracts.

(A–C) DLX2 (red) and OLIG2 (green) expressing cells visualized in coronal sections through mouse forebrain at E15.5 (A) and E18.5 (B–C) using indirect immunofluorescence. DAPI (blue) labels cell nuclei. Boxed areas in (A–C) are shown at higher magnification in (A′, B′–B‴, C′). DLX2 and OLIG2 are co-expressed in progenitors within the VZ/SVZ (A′, B′, C′), but not in more mature cells within the cortex (Ctx) (B″), corpus callosum (cc) (B‴) or anterior commissure (ac) (C′).
(D–E) OPCs within the anterior commissure (ac) at E15.5 visualized by indirect immunofluorescence for PDGFRα (green). All PDGFRα+ cells co-express OLIG2 (D, red), but not DLX2 (E, red). (D′–E′) are higher magnification views of (D–E). Closed arrows point to examples of PDGFRα +/OLIG2+ cells, and open arrows point to examples of PDGFRα cells that do not co-localize with DLX2. Str, striatum; Spt, septum; MGE/LGE, medial/lateral ganglionic eminence.
Scale bars A–C = 200μm
Scale bar A′–B′, D–E = 50μm
Scale bar B″–B‴, C′–E′, D′–E′ = 30μm
Segregation of DLX2 and OLIG2 to different cells in the mantle suggested distinct identity of these cells. Indeed, we find that OLIG2+ cells in the telencephalon co-express PDGFRα, while DLX2+ cells do not (Figure 2D–2E). This is consistent with previous studies showing that OLIG2+ cells in the mantle are OPCs and DLX+ cells are GABAergic neurons (Anderson et al., 1999; Anderson et al., 1997b; Ivanova et al., 2003; Stuhmer et al., 2002b).
Together, these findings indicate that DLX2 and OLIG2 are transiently co-expressed in a subset of cells within subpallial progenitor domains. DLX2 and OLIG2 expression become mutually exclusive as cells mature and migrate into the mantle zones and axon tracts.
Olig2 prenatal expression is increased in Dlx1&2 mutants
The finding of transient DLX2/OLIG2 co-expression raises the possibility of regulatory interactions within common progenitors. DLX1 and DLX2 are functionally redundant in regulating interneuron development (Anderson et al., 1997). Therefore, to determine whether DLX1 and/or DLX2 could play a functional role in regulating Olig2 in the ventral telencephalon, we studied Olig2 expression in Dlx1&2 double mutants. We first examined Olig2 mRNA expression in coronal sections of Dlx1&2 mutants at E12.5, E15.5, and E18.5. At E12.5 and E15.5, there is ~7-fold increase in Olig2+ cells in the SVZ of the AEP and MGE (Figure 3A–3D). The AEP region is where the anterior commissure will cross the midline and it is a prominent source of telencephalic embryonic OPCs. We also detected a significant increase in the number of Olig2+ cells in the neocortex and the caudal ganglionic eminence (CGE) of the Dlx1&2 mutant as compared to wildtype (Figure S5 and S6). At E18.5, increased numbers of Olig2+ cells are present in the Dlx1&2 mutant around the anterior commissure and in the striatum (Figure 3E–3F).
Figure 3. Olig2 expression is increased in Dlx1&2 mutants.
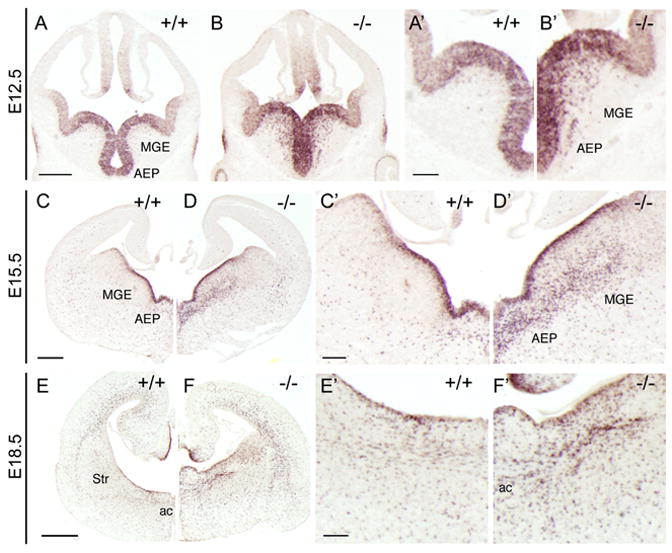
(A–F) In situ hybridization for Olig2 on coronal sections of E12.5 (A–B), E15.5 (C–D), and (E–F) E18.5 wildtype (+/+) and Dlx1&2 mutant (−/−). A′–F′ are higher magnification views of A–F. Olig2 expression is expanded within the MGE and AEP of Dlx1&2 mutants at E12.5 and E15.5, and in the ventral telencephalon at the level of the anterior commissure (ac) at E18.5.
AEP, anterior entopeduncular region; MGE, medial ganglionic eminence; Str, striatum.
Scale bar A–D = 250μm
Scale bar E–F = 500μm
Scale bar A′–F′ = 100μm
To determine if Olig2 represses Dlx2 expression, we compared Dlx2 expression in Olig2−/− and wildtype E15.5 telencephalic sections. There was no detectable change in Dlx2 expression at this age (Figure S7), which suggests that while Dlx1&2 potently repress Olig2 expression, Olig2 may not regulate Dlx2 expression.
Increased oligodendrocyte precursor production and accelerated differentiation in Dlx1&2 mutants
Because Olig2 is expressed in progenitors that can give rise to both oligodendrocytes and cortical neurons (Furusho et al., 2006; He et al., 2001; Yung et al., 2002), we proceeded to test whether the increase in Olig2 expression translates to an increase in oligodendrocyte production. Using in situ hybridization for OPC markers, we observed a ~6-fold increase in Pdgfra+ and Sox10+ cells in the MGE/AEP at E12.5 of the Dlx1&2 mutants compared to wildtype (Figure 4A–4B). At E15.5, Dlx1&2 mutants have a ~8 fold increase in Olig1+ cells, a ~5-fold increase in Pdgfra+ cells, and a ~6-fold increase in Sox10+ cells within the ventromedial MGE and AEP (Figure 4C–4E). At E18.5, Pdgfra and Sox10 expression remains substantially increased in the subcortical telencephalon at the level of the anterior commissure (Figure 4I–4J). We define the region of the ventral telencephalon where we see the increase in OPCs from E12.5 to E18.5 as the ventral telencephalic oligodendrocyte precursor (VTOP) domain (Figure 4). This domain is the site of earliest OPC formation in the ventral telencephalon, and its potential for oligodendrogenesis is unmasked in Dlx1&2 mutants.
Figure 4. The number of OPCs is increased in Dlx1&2 mutants.
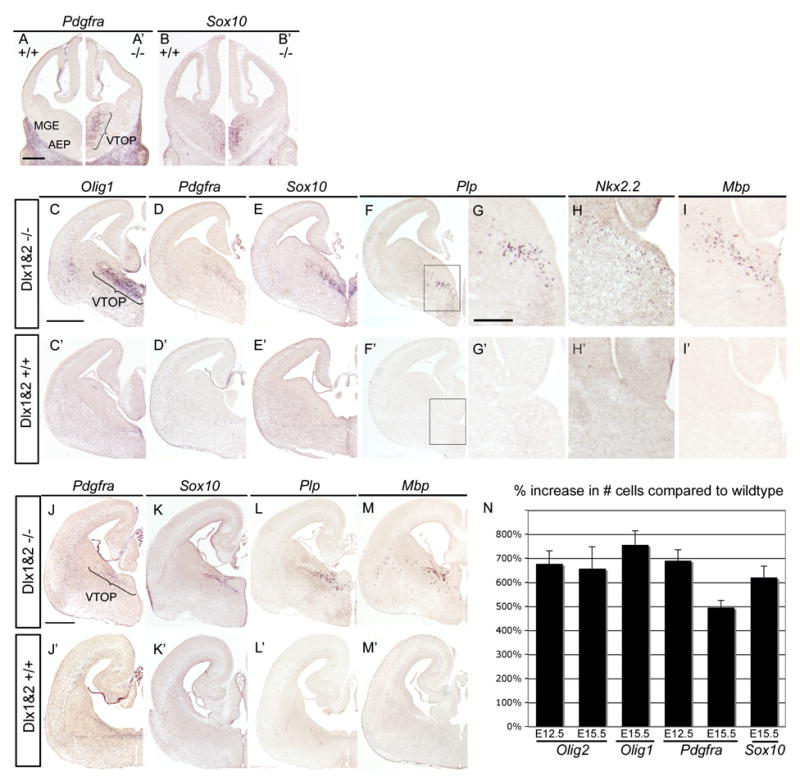
Coronal sections of E12.5 (A–B, A–B′), E15.5 (C–I, C′–I′), and E18.5 (J–M, J′–M′) Dlx1&2 mutant (−/−) and wildtype (+/+) labeled by in situ hybridization for OPC markers. The number of cells expressing Pdgfra and Sox10 is increased in the medial-ventral MGE and AEP of Dlx1&2 mutants as compared to wildtype at all ages. This region is defined as the ventral telencephalic precursor (VTOP) domain. At E15.5, the number of cells expressing Olig1 (C–C′), Plp (F–F′), Nkx2.2 (H, H′), and Mbp (I, I′) is also increased in Dlx1&2 mutants compared to wildtype. The boxed region in (F–F′) is shown at higher magnification in (G–G′). The increase in OPC markers persists at E18.5 (J–M, J′–M′).
(N) Quantification of OPC marker increase in the VTOP region at E12.5 and E15.5. 20μm sections that contained the VTOP region were analyzed from wildtype and Dlx1&2 mutant pairs (n=3). The graph depicts the average percentage increase (+ SEM) in the number of cells labeled with the corresponding OPC marker in the Dlx1&2 mutant compared to wildtype. Plp, Nkx2.2, and Mbp are increased in Dlx1&2 mutants, but are not included in this graph because few or no labeled cells were detected in wildtype animals. AEP, anterior entopeduncular area; MGE, medial ganglionic eminence.
Scale bar A–B, A′–B′ = 250μm
Scale bar C–F, C′–F′ = 500μm
Scale bar G–I, G′–I′ = 200μm
Scale bar J–M, J′–M′ = 500μm
In addition to the increase in OPC markers, we examined expression of genes characteristic of differentiating oligodendrocytes: Nkx2.2, Plp, and Mbp (Figure 4F–4I). In E15.5 wildtype mice, only rare cells express Nkx2.2, in contrast to numerous Nkx2.2+ cells in the Dlx1&2−/− VTOP. Remarkably, while Plp and Mbp expression are not yet detectable in the E15.5 wildtype telencephalon, numerous Plp and Mbp expressing cells are present in the VTOP domain of the Dlx1&2−/− embryos (Figure 4F–4I). At E18.5, there is further increase in Mbp and Plp-expressing cells in the Dlx1&2 mutant telencephalon (Figure 4L and 4M), whereas Mbp is still undetectable and Plp is just beginning to be expressed in the wildtype (Figure 4L′ and 4M′). Premature expression of markers of maturing oligodendrocytes indicates that differentiation is accelerated in the absence of Dlx function. In the neocortex of E15.5 Dlx1&2 mutants, there are ~60% more Olig2+ cells and ~40% more Pdgfra+ cells than in the wildtype (Figure S6). Since at this age all OPCs in the cortex arise from a ventral origin (Kessaris et al., 2006), our data suggest that OPCs generated in Dlx1&2 mutants retain their ability to migrate from the VTOP, and populate the cortex in increased numbers compared to wildtype at this age. Although Olig2 expression is increased in the CGE of Dlx1&2 mutants, expression of Pdgfra and Sox10 is unchanged in this region (Figure S5 and data not shown). In summary, Dlx1&2 mutants show a striking increase in expression of Olig2 and markers of OPCs, suggesting that Dlx1&2 repress OPC formation.
Proliferation in the MGE/AEP of Dlx1&2 mutants is not increased
Unlike neurons, OPCs retain proliferative capacity after specification. Thus it is possible that the increased number of OPCs in Dlx1&2 mutants represents a dysregulation of OPC proliferation rather than a change in cell fate specification per se. To determine if proliferation of OPCs is increased in Dlx1&2 mutants, we compared markers of proliferation [phosphohistone 3 (PH3) and Ki67] in wildtype and Dlx1&2−/− telencephalon at E12.5 and E15.5 (Figure 5A–5H). We counted the number of M-phase (indicated by expression of PH3) cells in both the VZ and SVZ of the MGE/AEP in wildtype and Dlx1&2−/− embryos (Figure 5C and 5F). As shown in Figure 5, there is no difference in the number of PH3+ cells in the VZ at E12.5 and E15.5. In the SVZ of the Dlx1&2 mutants, there is a small decrease in the number of PH3+ cells at E12.5 (p <0.03) and E15.5, but the latter does not reach statistical significance. Furthermore, there is no difference in the number of PH3+/OLIG2+ cells in the VZ and SVZ of the MGE/AEP at E12.5 and E15.5, suggesting that mitotic activity within the OLIG2+ cell population in this region remains unchanged (Figure 5C and 5F). This provides evidence that the increase in Olig2+ OPCs in the Dlx1&2 mutants is not due to an increase in proliferation.
Figure 5. Precursor proliferation within the MGE/AEP is not increased in Dlx1&2 mutants; DLX1&2 regulate OLIG2 expression.

(A–F) Proliferation is not increased in the MGE/AEP of Dlx1&2 mutants. Coronal sections showing the MGE/AEP area from E12.5 (A–B) and E15.5 (D–E) wildtype (+/+) and Dlx1&2 mutant (−/−) mice were double-labeled for PH3 (red) and OLIG2 (green). VZ, the primary proliferative zone; SVZ, secondary proliferative zone.
(C, F) The number of proliferating cell in M-phase (PH3+) co-expressing OLIG2+ was unchanged in both the VZ and SVZ of the MGE/AEP in Dlx1&2 mutants compared to wildtype mice. The graph depicts the average number (±SEM) of PH3+ (red) or PH3+/OLIG2+ (yellow) cells in the VZ and SVZ of the MGE/AEP at E12.5 (n=3) and E15.5 (n=3) calculated from Dlx1&2 mutant (shaded color) and comparable wildtype sections.
(G–H) Coronal sections from E12.5 wildtype (G–G″) or Dlx1&2 mutants (H–H″) were double-labeled for Ki67 (green) and PDGFRα (red). The boxed region in (G′–H′) is shown at higher magnification in (G″–H″). The number of PDGFRα cells is increased in the medioventral MGE (the VTOP domain), whereas the number of proliferating Ki67+ cells is decreased in this region. Of note, there is an increase in PDGFRα+ cells in the VZ of the Dlx1&2 mutants, with no appreciable change in Ki67 expression, suggesting precocious formation of OPCs. Over-expression of DLX1&2 in telencephalic cells reduces OLIG2 expression (I–J) E13.5 Dlx1&2 mutant brain slice electroporated with expression constructs for GFP alone (I–I′) or GFP+DLX1+DLX2 (J–J′) were cultured for 60 hours, resectioned, and doubled-labeled for GFP (green) and OLIG2 (red) and visualized by confocal microscopy. A low magnification brightfield image of the cultured slice overlaid with a false-colored (purple) representation of the GFP autofluorescence is shown as an inset in I and J. There is minimal co-expression of GFP and OLIG2 in slices electroporated with GFP+DLX1+DLX2 (J–J′) compared to the extent of co-expression of GFP and OLIG2 in slices electroporated with GFP (I–I′). Boxed region in (I, J) is shown at higher magnification in (I′, J′). In (I′,J′) z-stack of the x-axis corresponding to the horizontal line is shown above the image, and a z-stack of the y-axis corresponding to the vertical line is shown to the right of the image. Arrows point to cells that co-express GFP and OLIG2. Arrowhead points to a GFP+ cell that lies on top of a OLIG2+ cell.
Scale bars A–B, D–E, G′–H′ = 50μm
Scale bars G–J = 100μm
Scale bars G″–H″ = 25μm
Scale bar I′–J′ = 20μm
We next compared the expression of Ki67, which labels cells at all stages of proliferation, in the MGE/AEP of wildtype and Dlx1&2−/− mice at E12.5 and E15.5 (Figure 5G–5H and data not shown). In accordance with the PH3 analysis, we found a reduction in Ki67 expression in the Dlx1&2 mutant SVZ at E12.5 and E15.5 (Figure 5G–5H and data not shown). These findings are also consistent with prior evidence of fewer proliferating cells in the SVZ of the MGE and AEP in Dlx1&2 mutants (Anderson et al., 1997b). The number of PDGFRα-expressing cells is greatly increased in the VTOP domain of Dlx1&2 mutants at E12.5 and E15.5, comparable with Pdgfra mRNA expression. Interestingly, in the VZ of the E12.5 Dlx1&2 mutants, we observe more numerous PDGFRα+ cells, but no appreciable difference in the number of Ki67+ cells, suggesting precocious formation of OPCs in Dlx1&2 mutants (Figure 5G″–5H″).
Since Shh signaling can induce Olig2 expression and OPC formation in the ventral telencephalon (Agius et al., 2004; Oh et al., 2005; Tekki-Kessaris et al., 2001), we addressed whether Shh expression is increased in Dlx1&2 mutants. As shown in Figure S8, no difference in Shh expression is detected in Dlx1&2−/− ventral telencephalon compared to wildtype. We observed an increase in Patched1 similar to other OPC markers, suggesting OPCs in the VTOP of Dlx1&2 mutants respond to Shh signaling.
In summary, our data demonstrate that the increase in OPCs in Dlx1&2 mutants is not due to an increase in proliferation or Shh expression, strongly supporting a function of DLX to repress OPC cell fate within telencephalic progenitors.
DLX1&2 can repress OLIG2 expression
Because of the dramatic impact of Dlx loss of function on oligodendrocyte lineage development, we sought to investigate the mechanism underlying DLX1&2 activity. A possibility suggested by the studies above was that DLX1&2 regulate OPC formation cell-autonomously by repressing Olig2 expression. To further test this, we used a slice-electroporation assay to over-express DLX1&2 in cells that express Olig2 (Figure 5I–5J). Slice cultures from E13.5 Dlx1&2 mutants were transfected with DLX1, DLX2, and GFP expression vectors. Since greater than 95% of electroporated cells will co-express all expression constructs (Stuhmer et al., 2002a), most GFP+ cells will express DLX1 and DLX2. The slices were cultured for 60 hours, fixed, and processed for GFP and OLIG2 double-immunofluorescence. In slices that were transfected with GFP alone, numerous GFP+ cells co-expressed OLIG2 (Figure 5I). However, when cells were co-transfected with DLX1 and DLX2 expression vectors, the expression of OLIG2 was reduced as demonstrated by the relative lack of GFP+/OLIG2+ cells in these slices (Figure 5J). This indicates that DLX1&2 can repress OLIG2 expression cell-autonomously. Since DLX1&2 have redundant functions, it is probable that DLX1 or DLX2 alone may be sufficient to repress OLIG2 expression and this will be investigated in future studies.
Neuron formation is reduced in Dlx1&2 mutants
Since Dlx1&2 appear to act cell-autonomously to repress Olig2 expression and OPC formation, it follows that the Dlx genes may be regulating a neuron/glial fate decision within a common progenitor. Therefore, increased OPC formation in the Dlx1&2 mutants should be accompanied by decreased neuron production. OPC markers were first detected at E11 in both wildtype and mutants, indicating that the onset of OPC formation was normal in Dlx1&2 mutants (data not shown). Increased OPC formation in the MGE/AEP of Dlx1&2 mutants was apparent by E11.5 (Figure 6A–6C). Analysis of neurogenesis between E11.5 and E12.5 using pan-neuronal markers Tubb3 (tubulin, beta 3 subunit) and Stmn2 (SCG10) showed decreased expression of these markers within the MGE/AEP of Dlx1&2 mutants compared to wild type (Figure 6). In addition, expression of GABAergic neuronal markers Gad67 and Lhx6 was reduced in Dlx1&2 mutants, suggesting that GABAergic neuron formation was impaired (Figure 6F–6G, 6J–6K). Thus, increased OPC production in Dlx1&2 mutants is coupled with decreased GABAergic neuron production.
Figure 6. Increased OPC formation is commensurate with decreased neuron formation in Dlx1&2 mutants.

(A–C, A′–C′) OPC formation is increased at E11.5 in the MGE of Dlx1&2 mutants (−/−, A′–C′) compared to wildtype (+/+, A–C). In situ hybridization for Olig2 (A–A′), Pdgfra (B–B′), and Sox10 (C–C′) shows increased expression within the MGE (brackets), which is shown at higher magnification in the lower panels.
(D–K,D′–K′) Neuron formation is decreased in the MGE of Dlx1&2 mutants. The expression of pan-neuronal genes (Tubb3/Tuj1 and Stmn2/SCG10) and GABAergic neuron markers (Gad67 and Lhx6) was analyzed by in situ hybridization on coronal sections from wildtype (+/+) and Dlx1&2 mutants (−/−) at E11.5 (D–G, D′–G′) and E12.5 (H–K, H′–K′).
(D–G, D′–G′) At E11.5, Tubb3, Stmn2, and GAD67 expression is decreased in the MGE of Dlx1&2 mutants (brackets). The MGE is shown at higher magnification in the bottom panels. There are fewer Lhx6+ cells (arrowheads) in the SVZ of the MGE in Dlx1&2 mutants compared to wildtype (G–G′).
(H–K, H′–K′) At E12.5, expression of Tubb3, Stmn2, Gad67, and Lhx6 is diminished in the MGE of Dlx1&2 mutants. Note that the greatest decrease occurs in the ventral MGE (brackets) where OPC production is increased in Dlx1&2 mutants (see Figure 3 and 4).
Scale bars: A, D, H = 200μm.
Olig2 is a genetic target of Dlx1&2 in regulating cell fate specification
Our analysis of Dlx1&2 mutants shows that these transcription factors repress the production of OPCs, and our electroporation experiment shows that DLX1&2 are sufficient to repress OLIG2 expression. Olig2 is known to be an essential regulator of OPC development (Lu et al., 2002; Novitch et al., 2001; Takebayashi et al., 2002; Zhou et al., 2001). To test whether Olig2 function is necessary for increased OPC formation in Dlx1&2 mutants, we analyzed E15.5 Dlx1&2;Olig2 triple mutants (Figure 7A and 7C–6D). Based on Pdgfra and Sox10 expression, we first confirmed that telencephalic OPCs are largely absent from Olig2 mutants at E15.5 (Figure 7C–7D), as previously reported (Novitch et al., 2001; Takebayashi et al., 2002; Zhou et al., 2001). Likewise, we found that Dlx1&2;Olig2 triple mutants lack expression of Pdgfra and Sox10, indicating that Olig2 function is necessary for OPC formation in Dlx1&2 mutants (Figure 7C–D).
Figure 7. Olig2 is necessary for OPC formation in Dlx1&2 mutants, and Mash1 modulates OPC generation via Dlx1&2.

In situ hybridization on E15.5 coronal forebrain sections. The genotype of the section is labeled to the left of the rows and above the columns: All top rows, wildtype for Dlx1&2. All bottom rows, homozygous mutant for Dlx1&2. (A) Left column, wildtype for Olig2; right column, homozygous mutant for Olig2. In Olig2 mutants, Olig1 expression in the VZ of the MGE/AEP was increased, while the number of Olig1+ cells in the SVZ and mantle was reduced (solid arrowhead), but not eliminated. Similarly, in Dlx1&2;Olig2 mutants, Olig1 expression was increased in the VZ and reduced in the SVZ and mantle of the VTOP domain (solid arrowhead). In comparison with Olig2 mutants, Dlx1&2;Olig2 mutants showed a much greater accumulation of Olig1+ cells in the dorsal LGE (open arrowhead).
(B) Left column: wildtype for Mash1; right column: homozygous mutant for Mash1. Compared to wildtype, Olig2 expression is decreased in Mash1 mutants, particularly in the VZ of the MGE and SVZ of the AEP (solid arrowheads). Expression of Olig2 is restored and augmented in the MGE/AEP of Dlx1&2;Mash1 triple mutants, where it resembles Olig2 expression in Dlx1/2 mutants.
(C–D) Left column: wildtype; middle column: homozygous mutant for Olig2; right column: homozygous mutant for Mash1. Pdgfra (C) and Sox10 (D) expression are undetectable in Olig2 mutants and Olig2;Dlx1&2 triple mutants. In Mash1 mutants, Pdgfra and Sox10 expression are reduced, particularly in the AEP (solid arrowhead) compared to wildtype, but are increased in Dlx1&2;Mash1 triple mutants even more broadly than in Dlx1&2 mutants.
(E) Model of neurogenesis and oligodendrogenesis in the ventral telencephalon. A subpopulation of Olig2+ cells express Dlx1&2/±Mash1 in the VZ and SVZ1. We propose that Dlx1&2 down-regulates Olig2 in these cells to generate neuroblasts that differentiate into GABAergic neurons. Mash1 modulates oligodendrogenesis by inhibiting Dlx expression through Notch-mediated lateral inhibition in the VZ and possibly SVZ1 (blunted arrows connecting cells). In Mash1 mutants, increased expression of Dlx1&2 leads to repression of both Olig2 and OPC formation (B–D). Removal of Dlx1&2 function in Mash1;Dlx1&2 triple mutants relieves repression of OLIG2 and restores OPC production (C–D). A mechanism whereby OLIG2+/DLX2+ progenitors down-regulate Dlx-expression to produce oligodendrocytes (gray dashed arrows) is suggested by Dlx2-lineage analysis (see text).
In both the Olig2 mutants and Dlx1&2;Olig2 mutants we observed an increase in Olig1 expression along the VZ of the VTOP domain, while the number of Olig1-expresing cells in the SVZ and mantle was severely reduced, but not eliminated (Figure 7A). Both Olig2 and Dlx1&2;Olig2 mutants had an accumulation of Olig1+ cells in the dorsal LGE, which was notably greater in the triple mutant (Figure 7A). Since the Olig1+ cells in the Olig2 and Olig2;Dlx1&2 triple mutants do not express Sox10 and Pdgfra, they do not typify normal OPCs (Figure 7C–7D; (Lu et al., 2002; Zhou and Anderson, 2002). The Olig1+ cells in these mutants may represent mislocalized and abnormally differentiating oligodendrocyte precursors; nevertheless, the increase in Olig1+ cells in Dlx1&2;Olig2 mutants compared to Olig2 mutants further supports the ability of Dlx1&2 to represses normal and abnormal OPC production.
These data establish that Olig2 acts downstream of Dlx1&2 in specifying oligodendroglial cell fate. Whether the repressive transcriptional effect of DLX on the Olig2 locus is direct or indirect remains to be investigated.
Mash1 promotes OPC production by repressing Dlx expression
Mash1 is expressed in regions of the subcortical telencephalon that give rise to both oligodendrocytes and GABAergic neurons. To examine co-expression of MASH1, DLX2, and OLIG2 in these progenitor populations, we performed triple-labeling immunofluorescence in the E12.5 MGE (Figure 1B-1B′ and Figure S3). In the VZ and SVZ of the MGE, MASH1 is almost always co-expressed with DLX2 and very few cells (~1%) express MASH1 alone. In the VZ, greater than 90% of DLX2+ cells express OLIG2, and ~80% of DLX2+ cells express MASH1. Based on this expression pattern, cells in the VZ can be divided into two main populations, OLIG2+/DLX2+/MASH1+ (40%) and OLIG2-only (OLIG2+/DLX2−/MASH1−) (40%) (Figure 1B′ and 1C). In the SVZ, the number of OLIG2+/DLX2+/MASH1+ and OLIG2-only cells progressively declines, and these populations combined make up less than 20% of cells in SVZ2. While the proportion of DLX2+ cells nearly doubles in the SVZ, the percentage of DLX2+ cells expressing MASH1 decreases to ~60% in the SVZ1 and ~35% in the SVZ2. This analysis suggests that MASH1 and DLX2 are usually co-expressed in early progenitors, but MASH1 expression declines as the cells migrate through the progenitor zones and differentiate.
Expression of the OPC markers PDGFRα and OLIG2 are decreased in the MGE of Mash1 mutants (Parras et al., 2007). Mash1 mutants exhibit precocious and ectopic expression of Dlx genes in the subcortical VZ due to a decrease in Notch/Delta-mediated lateral inhibition (Casarosa et al., 1999; Horton et al., 1999; Yun et al., 2002). Given our evidence that Dlx expression represses OPC formation, we hypothesized that decreased embryonic OPC production in Mash1 mutants was due to increased Dlx1&2 expression. Indeed, in addition to confirming that Olig2 and Pdgfra expression are reduced in the ventral telencephalon of E15.5 Mash1 mutants, particularly in the AEP, we found that Sox10 expression is also decreased (Figure 7B–7D). These results are consistent with the electroporation assay in which ectopic DLX1&2 expression can suppress OLIG2.
To directly test whether reduced OPC production in Mash1 mutants is due to increased Dlx expression, we studied OPC formation in Dlx1&2;Mash1 triple mutants at E15.5 (Figure 7B–7D and Figure S9). Removal of Dlx1&2 in addition to Mash1 in the Dlx1&2;Mash1 triple mutants restores expression of Olig2, Sox10 and Pdgfra in the MGE and AEP, demonstrating that Dlx1&2 function downstream of Mash1 (Figure 7B–7D). Furthermore, these data suggest that Mash1 promotes OPC formation at least in part by repressing Dlx1&2. Interestingly, in Dlx1&2;Mash1 triple mutants we observed a robust increase in OPC markers in other areas of the telencephalon, including the CGE, LGE, and cortex (Figure S9 and data not shown). Therefore, in addition to its action via DLX1&2, MASH1 may have additional and regionally specific effects in limiting OPC production, such that loss of Mash1 in conjunction with Dlx1&2 results in profound disinhibition of oligodendrogenesis.
OPCs from Dlx1&2 mutants migrate and differentiate into myelinating oligodendrocytes
Maturation of telencephalic GABAergic neurons and OPCs is largely a postnatal process in mice (Miller, 2002; Wonders and Anderson, 2006). Because Dlx1&2 mutants die at birth, it is not feasible to analyze the postnatal fate of telencephalic progenitors in these mutants. To circumvent this limitation, we transplanted the MGE/AEP from E15.5 GFP-labeled Dlx1&2 mutants into the ventricles of postnatal day 0 (P0) wildtype mice and studied the ability of the GFP+ cells to migrate and differentiate (Figure 8 and S10). This technique allows us to examine the developmental potential of MGE/AEP progenitors as well as the capacity of OPCs from Dlx1&2 mutants to migrate, mature into myelinating oligodendrocytes, and survive.
Figure 8. OPCs transplanted from Dlx1&2 mutants migrate and differentiate into mature oligodendrocytes that are maintained in adult animals.

(A′) Schematic of transplant experiment: GFP+ MGE/AEP cells were dissected from E15.5 Dlx1&2 mutants and wildtype mice (as described in Materials and Methods), dissociated into a cell suspension, and injected into the lateral ventricles of postnatal day 0 (P0) mice. Recipient mice were sacrificed at P30 or P60, and transplanted cells were identified by immunohistochemistry for GFP (green), DAPI (blue), and glial markers (red) as shown (A–K). (A) Overview of GFP+ cells in the corpus callosum (cc) of P30 transplant recipient.
(B–E) The molecular identity of GFP+ cells in the corpus callosum was characterized by double-labeling for GFP and SOX10 (B), OLIG1 (C), MBP (D), and GFAP (E). GFP+ cells co-express proteins of maturing oligodendrocytes (arrows, SOX10, OLIG1, MBP), but not astrocytes (GFAP).
(F) Overview of GFP+ cells in the corpus callosum (cc) and septum (Spt) of P60 recipient mice.
(G–I) Double-labeling for GFP (green) and SOX10 (red) identifies transplanted cells in the oligodendrocyte lineage in the corpus callosum (G), fornix (H), and septum (I). (I′) higher magnification view of an oligodendrocyte in the septal grey matter. Arrows point to examples of double-labeled cells.
(J–K) Double-labeling for GFP (green) and MBP (red) shows that transplanted cells mature into MBP-expressing oligodendrocytes in the corpus callosum (J) and septum (K).
Scale bars: A, F = 100μm; B, E, G–I, K = 50μm; C–D, I′–J = 20μm.
Analysis of recipient brains at postnatal day 18, 30, and 60 showed that wildtype donor MGE/AEP generated GFP+ cells in the grey matter of the cerebral cortex, hippocampus, and striatum (Figure S10). These cells had the morphology of interneurons consistent with previous studies showing MGE transplants produce functional GABAergic and cholinergic interneurons (Marin et al., 2000). On the other hand, transplanted MGE/AEP cells from Dlx1&2 mutants did not generate appreciable numbers of cortical, hippocampal, or striatal neurons, consistent with evidence that neuronal migration, differentiation and survival is blocked in Dlx1&2 mutants (Figure S10) (Anderson et al., 2001; Anderson et al., 1997b). Importantly, transplants from both Dlx1&2 mutants and wildtype donors produced GFP+ cells in the cortical white matter, particularly in the fimbria, corpus callosum, and fornix, demonstrating that cells from the MGE/AEP migrate and integrate into axon tracts (Figure 8A and Figure S10 and S11). The morphology of the vast majority of these cells resembled that of myelinating oligodendrocytes (Figure 8C–8D, 8J and Figure S10E). GFP+ cells persisted in the axon tracts through P60 in recipients of both wildtype and Dlx1&2 mutants, suggesting these cells are capable of surviving through adulthood (Figure 8F and S11).
Transplanted Dlx1&2 mutant OPCs showed a temporal pattern of oligodendrocyte marker expression similar to transplanted wildtype OPCs (Figure 8). At P8 and P18, we found GFP+ cells in the corpus callosum and fimbria co-expressed PDGFRα (data not shown). By P30, GFP+ cells no longer labeled with PDGFRα, and greater than 90% of GFP+ cells in the corpus callosum expressed SOX10 (Figure 8B). Furthermore, we identified GFP+ cells in this area that co-expressed more mature markers: cytoplasmic OLIG1 and MBP (Figure 8C–8D). The GFP+ cells found in the corpus callosum did not express glial acidic fibrillary protein (GFAP) (Figure 8E); however, we did find GFAP+ cells with the morphology of fibrous and protoplasmic astrocytes in the periventricular regions, hippocampus and fimbria (Figure S10B′ and data not shown). Even greater expression of mature oligodendroglial markers in GFP+ cells was observed in P60 transplant recipients. Nearly all GFP+ cells in the corpus callosum expressed SOX10 in addition to numerous cells expressing MBP as well as GFP+ processes that co-localized with RIP, another cell-surface marker of oligodendrocytes (Figure 8G and 8J and data not shown). In summary, these experiments demonstrate that Dlx1&2 mutant MGE/AEP-derived OPCs migrate and differentiate into MBP-expressing oligodendrocytes that persist into adulthood.
Discussion
Precise regulation of progenitor pools for neurons and glia that emerge from restricted domains of the CNS is critical for normal development. Previous work has indicated the importance of general mechanisms such as proneural gene and Notch activity on neuronal versus glial specification in the forebrain, but has left open the important question of how cell-autonomous cell fate decisions are made within regionally-restricted and potentially common progenitors. Here we demonstrate a new function of DLX proteins as important regulators of cell-fate decision between GABAergic interneuron versus oligodendroglial cell production evidently from a common bi-potent progenitor in the ventral forebrain. Genetic evidence demonstrates that Dlx1&2, Olig2 and Mash1 engage in combinatorial interactions underlying this process.
Dlx1&2 function regulates GABAergic interneuron versus OPC formation
These data show that Dlx transcription factors control the switch between neurogenesis and oligodendrogenesis in a subpopulation of telencephalic progenitors. Dlx1&2 strongly repress OPC formation, as evidenced by the dramatic increase in OPCs generated in Dlx1&2 mutants in a region of the forebrain we define as the ventral telencephalic oligodendrocyte precursor (VTOP) domain. Dlx genes are necessary for GABAergic neuron differentiation and migration since Dlx1&2 mutants lack most cortical GABAergic interneurons (Anderson et al., 1997a). Here we provide additional evidence that there is also a decrease in neuron production within the MGE/AEP of Dlx1&2 mutants. Approximately 80% of GABAergic interneurons are specified between E11.5 and E16.5, whereas OPCs are largely generated after the production of neurons as Dlx expression declines (Figure S4) (Anderson et al., 2002; Rowitch, 2004). Thus, Dlx1&2 play a dual role in regulating the cell-fate of telencephalic progenitors by inducing GABAergic interneuron differentiation and inhibiting the extent of oligodendrogenesis through Olig2-repression. This suggests that proper development of the embryonic forebrain evolved to utilize Dlx genes to promote neurogenesis while concurrently restricting the number of early-born oligodendrocytes.
Dlx1&2-mediated repression of Olig2 and oligodendrogenesis is likely cell-autonomous based on several lines of evidence. First, Olig2 expression and OPC formation are greatly diminished in Mash1 mutants which over-express Dlx1 and Dlx2 (Figure 7B). Second, over-expression of DLX1&2 in telencephalic progenitors reduces OLIG2 expression (Figure 5J). There is no increase in OLIG2+ progenitor proliferation (Figure 5A–5F), and Shh expression is unchanged in Dlx1&2 mutants (Figure S8A and S8B). Finally, the robustness of OPC production and the decrease in neuron formation in Dlx1&2 mutants suggests that most progenitors that normally would have co-expressed OLIG2 and DLX2 (~50% in the MGE VZ and SVZ1 at E12.5) become oligodendrocytes in the absence of active Dlx1&2 repression. OLIG2, which regulates the expression of downstream effectors of oligodendrogenesis, such as Sox10 and Nkx2.2, is necessary for the increase in OPC production in Dlx1&2 mutants since OPCs are undetectable in Dlx1&2;Olig2 mutants (Gokhan et al., 2005; Liu et al., 2006).
OPCs in the VTOP of Dlx1&2 mutants express Plp, Mbp, and Nkx2.2 by E15.5, at least 3 days before the appearance of these markers in wildtype mice (Figure 4), suggesting accelerated OPC maturation in Dlx1&2 mutants. One possible explanation could relate to the increase in Olig1+ expression in the Dlx1&2 mutants. Olig1 is a key modulator of oligodendrocyte maturation and regulates the transcription of myelin-specific genes such as Mbp and Plp (Xin et al., 2005).
The Dlx genes are the first homeobox transcription factors shown to coordinate OPC and neuron specification in the telencephalon. By contrast, in the spinal cord, another homeodomain transcription factor Nkx2.2 has been identified as essential for OPC maturation, but not specification (Qi et al., 2001).
Model of GABAergic neuron and oligodendrocyte specification
Our analysis suggests a genetic model of GABAergic neuron versus oligodendrocyte specification in the ventral telencephalon (Figure 7E). From as early as E10.5, OLIG2 is expressed in nearly all VZ progenitors in ventral telencephalon (Figure S2) (Nery et al., 2001). By E12.5, two distinct populations of cells are observed in the VZ: OLIG2+/DLX2+/MASH1+ and OLIG2-only. The number of MASH1+/DLX2+ cells in the VZ is thought to be regulated non cell-autonomously via Notch/Delta-mediated lateral inhibition (Casarosa et al., 1999; Horton et al., 1999; Yun et al., 2002). Thus, the increase in DLX2 expression from the VZ to SVZ1 is consistent with decreased Notch activity and progressive proneural functions of Mash1. Indeed, the proneural function of MASH1 might cell-autonomously and positively regulate Dlx expression as cells differentiate into GABAergic neurons (Poitras et al., 2007). Reduced Notch/Delta-mediated lateral inhibition in Mash1 or Delta1 mutants results in an expansion of Dlx expression in nearly all ganglionic eminence progenitors in the VZ (Casarosa et al., 1999; Horton et al., 1999; Yun et al., 2002). Based on our model, expansion of DLX expression is predicted to lead to increased repression of OLIG2, and thereby to decreased OPC formation seen in the Mash1 mutants. We show that removal of Dlx1&2 function in the Mash1;Dlx1&2 triple mutants restores OLIG2 expression and OPC production (Figure 7B–7D). These findings suggest that MASH1 promotes oligodendrogenesis by non-autonomously inhibiting Dlx1&2 and maintaining the pool of OLIG2+/DLX2− progenitors.
After DLX expression is initiated in OLIG2+ cells within the VZ, there is a temporal delay between accumulation of DLX2 protein and suppression of OLIG2 expression. Progressive reduction in OLIG2 expression as DLX2 expression increases in the SVZ is consistent with DLX2+ cells down-regulating OLIG2 via Dlx-mediated repression. In SVZ2, cells segregate into two pools expressing either DLX2 or OLIG2 that in general continue to differentiate along either the neuronal or oligodendroglial lineage, respectively (Cobos et al., 2006; Letinic et al., 2002; Stuhmer et al., 2002b; Xu et al., 2004). In our model, OPCs are primarily generated from cells that remain OLIG2+ from VZ to SVZ, whereas GABAergic neurons arise from a DLX2+/OLIG2+ cell in which OLIG2 expression is down-regulated. Consistent with this model, in-vivo lineage analysis using inducible Olig2-Cre shows that Olig2+ progenitor cells in the forebrain give rise to GABAergic neurons, followed by oligodendrocytes (Miyoshi, Butt, Takebayashi, and Fishell, Society for Neuroscience 2005 #941.6 and 2006 #317.9). While the vast majority of Dlx-expressing cells repress Olig2 to become GABAergic neurons, a pathway may also exist whereby OLIG2+/DLX2+ progenitors down-regulate Dlx-expression to produce oligodendrocytes (gray dashed arrow in Figure 7E). Consistent with this hypothesis, a small number of OPCs arise from Dlx2/tauLacZ+ cells (Marshall and Goldman, 2002) and a few PDGFRα+ cells are generated from the Dlx2-Cre lineage (GBP, MAP, Marc Ekker, and JLRR, unpublished observations). Thus, DLX2 expression does not represent an irreversible state of neuronal commitment, and in rare DLX2+/OLIG2+ cells, OLIG2 expression may predominate driving OPC development.
In conclusion, our findings show a genetic mechanism for GABAergic neuron and oligodendrocyte specification regulated by DLX2, MASH1 and OLIG2. We propose that DLX1&2 regulate a transcriptional hierarchy to control neuron versus oligodendroglial cell fate within a common bi-potent progenitor based on the following lines of evidence: 1) GABAergic neuron formation is defective, while oligodendrogenesis is substantially increased in Dlx1&2 mutants; 2) transplants of wildtype MGE/AEP progenitors generate both neurons and oligodendrocytes, whereas those from Dlx1&2 mutants produce only oligodendrocytes; 3) Loss of Dlx1&2 does not result in either increased proliferation or earlier onset of oligodendrogenesis; 4) Dlx1&2 are sufficient to autonomously repress OLIG2 expression, which is necessary for OPC production in Dlx1&2 mutants; 5) Olig2-Cre and Dlx2-cre lineages give rise to both GABAergic interneurons and oligodendrocytes. Thus, our data in conjunction with others support that the transient DLX2+/OLIG2+ cells represent a common progenitor capable of generating GABAergic neurons and oligodendrocytes.
Adult Neurogenesis and Oligodendrogenesis
The SVZ of the lateral wall of the lateral ventricles is a site of neurogenesis in the adult mammal. Neurogenic astrocytes (type B cells) give rise to transit amplifying type C cells that produce type A neuroblasts (Merkle and Alvarez-Buylla, 2006). Intriguingly, type C cells express MASH1 and DLX2, and generate type A neuroblasts that develop into GABAergic interneurons in the olfactory bulb (Aguirre et al., 2004). Recent studies have found that OLIG2 is expressed in a small, heterogeneous population of type C cells, which give rise to oligodendrocytes that populate the corpus callosum, striatum, and fimbria (Menn et al., 2006). The striking similarity in the transcription factors expressed within MGE progenitors and type C cells suggests that parallel mechanisms control GABAergic interneuron formation and oligodendrocyte production in the adult SVZ. In light of our current findings, we speculate that DLX proteins suppress OLIG2 expression in the majority of type C cells to produce DLX2+/MASH1+ type A neuroblasts. However, a minority of type C cells may down-regulate DLX expression to enable OLIG2 expression and produce OLIG2+/PDGFRα+ OPCs. It remains to be determined whether interactions between DLX, MASH1, and OLIG2 that occur in the embryonic forebrain play a similar role in regulating GABAergic neuron and oligodendrocyte production within the adult SVZ.
Long-term survival of OPCs from the ventral telencephalon
In the mouse, the first OPCs are generated in the MGE/AEP and produce oligodendrocytes that populate all regions of the forebrain by the time of birth. Lineage-mapping experiments using Nkx2.1-Cre have shown that these early-born oligodendrocytes are replaced postnatally by oligodendrocytes derived from more dorsal regions, including the LGE-CGE and cortex. Thus, Nkx2.1-lineage oligodendrocytes were not detected at P30 in the corpus callosum and cortex (Kessaris et al., 2006). Our data show that OPCs transplanted from E15.5 MGE/AEP into newborn mice can survive into adulthood (Figure 8 and Figure S10 and S11). These transplanted cells incorporate into white matter tracts, especially the corpus callosum and fimbria, and express markers of mature oligodendrocytes. These contrasting results could be explained if only a subset of OPCs from the MGE/AEP were labeled using Nkx2.1-Cre recombination or if the contribution of labeled-cells was diluted below detection by OPCs from different regions. Our transplants include the entire VZ/SVZ of the MGE/AEP and represent the potential of progenitors from the VTOP region to produce oligodendrocytes that are maintained in the adult. It is possible that a heterotopic and heterochronic transplant introduces OPCs into an environment that may enable their long-term survival. Nevertheless, our results show that embryonic OPCs are not intrinsically programmed to be eliminated during the early postnatal period, raising the possibility that embryonically-derived neural stem cells could be used as a source of oligodendrocytes in neurological disorders involving white matter loss, such as periventricular leukomalacia, a cause of cerebral palsy, and multiple sclerosis.
Experimental Procedures
In situ hybridization
Digoxigenenin(DIG)-labeled cRNA probes were generated and in situ hybridization was performed as described (Cobos et al., 2005). ISH probes used are described in Supplemental Data.
Histology
Pregnant females were anesthetized with Isofluorene. E11.5, E12.5, E15.5 or E18.5 pups were extracted from the uterus and the brains dissected and fixed with 4% paraformaldehyde (PFA) in phosphate-buffered solution (PBS 0.1 M, pH 7.4). Postnatal mice (P8, P18, P30 and P60) were deeply anesthetized with Avertin (Sigma; 0.2 ml/10 g body weight) and underwent intracardiac perfusion with 4% PFA in PBS. The brains were removed and post-fixed overnight in the same fixative. After fixing, brains were cryoprotected by immersion in 30% sucrose, frozen in OCT or on dry ice, and stored at −80°C. Embryonic brain sections were cut at a thickness of 20μm on a cryostat and mounted on Fisher Superfrost/Plus slides. For GFP immunohistochemistry, postnatal brains were cut on the cryostat at 40μm or microtome at 60μm. For double immunohistochemistry, P8 and P18 brain sections were cut at 10μm and mounted as above, and P30 and P60 brains were cut at 40μm and processed as floating sections.
Immunohistochemistry
Sections were blocked for 1 hour at room temperature with blocking solution (5% goat serum, 1% bovine serum albumin, and 0.03% Triton X-100). Primary antibodies were incubated at 4°C overnight in blocking solution and secondary antibodies for 1 hour at room temperature or overnight at 4°C in blocking solution. For fluorescent imaging, sections were counterstained with DAPI, cover-slipped using Fluoromount-G (Southern Biotech), and analyzed using the Olympus AX700 microscope. Confocal images at 25x and 63x magnification were taken using Zeiss LSM 510 confocal microscope. For non-fluorescent immunohistochemistry, ABC Kit (Vector Laboratories) was used to form avidin-biotin complexed to horseradish peroxidase and visualized using either diaminobenzidine or VIP (Vector Laboratories) color reaction. Sections were dehydrated overnight, washed in xylene, and cover-slipped using Permount (Fisher Scientific). The primary and secondary antibodies used in this study are described in Supplemental Data.
Electroporation
Electroporation of 200μm E13.5 brain slices with pCAGGS-GFP, pCAGGS-Dlx1, and pCAGGS-Dlx2 was performed as described (Stuhmer et al., 2002a) with additional detail provided in Supplemental Data. Eight Dlx1&2 mutant brains over 4 independent experiments were processed. At least 16 slices were electroporated with expression constructs for GFP, DLX1, and DLX2 and 10 slices with GFP alone. Empty vector (pCAGGS) was added with pCAGGS-GFP to equalize the amount of DNA electroporated between GFP-only and GFP+DLX1+DLX2 transfections. A representative experiment is shown in Figure 5.
Animals
All experimental procedures were approved by the Committees on Animal Health and Care at the University of California San Francisco (UCSF). Mouse colonies were maintained at UCSF in accordance with National Institutes of Health and UCSF guidelines. Mutant mice lacking Dlx1&2 were generated previously in our laboratory as described (Qiu et al., 1997). Mutant mice lacking Olig2 (Lu et al., 2002) and Mash1 (Horton et al., 1999) were generated previously. CD1 mice and transgenic mice expressing enhanced green fluorescent protein (GFP) are commercially available from Jackson Labs.
PCR genotyping is described in Supplemental Data.
Transplantation
Transplantation of cells from the MGE/AEP of Dlx1&2−/−;GFP+/and Dlx1&2+/+;GFP+/embryos into wild-type neonatal mice employed previously established protocols (Alvarez-Dolado et al., 2006; Cobos et al., 2005; Wichterle et al., 1999) with modifications described in Supplemental Data.
Statistical analysis
The number of DLX2, OLIG2, and/or MASH1 expressing cells
DLX2, OLIG2, and/or MASH1 expressing cells were visualized on two 20μm serial, coronal forebrain sections from E12.5 wildtype mice (n=2) by immunofluorescence confocal microscopy as described above. The images were imported into Photoshop 7 (Adobe Systems Incorporated), and a rectangle encompassing the VZ and SVZ domains was placed orthogonal to the ventricular surface (see Figure 1). The labeled cells in the VZ, SVZ1, and SVZ2 within each rectangle were manually counted using a cell-counter and switching between the red, green, and blue Channels in Photoshop.
Number of OPCs
20μm section from three Dlx1&2 mutant and wildtype mice at E12.5 and E15.5 were labeled by in situ hybridization for OPC markers. The images were imported into Photoshop 7 and the VTOP region (see Figure 3 or 4) was digitally extracted from each of the sections. The same size region was used between age-matched animals. In cases where the cell density was high, a new layer was created in Photoshop, and positively labeled cells were marked manually by small dots in the new layer. The number of cells (or dots) was calculated using the Analyze Particles tool of ImageJ v1.37g (National Institutes of Health). The mean number of cells per section was calculated for each brain, and the final mean number of cells and the SEM per section were calculated for each marker across mutant and wildtype brains using Excel 2004 (Microsoft Corporation).
OPC Proliferation
20μm sections from Dlx1&2 mutant and wildtype pairs at E12.5 (n=3) and E15.5 (n=3) were processed by double-labeling immunofluorescence for PH3 and OLIG2. Images were captured on an Olympus AX700 and imported into Photoshop 7.0. Quantification was performed on two serial sections spaced 100μm apart at E12.5 and 200μm apart at E15.5 for each embryo analyzed. Images were processed to contain the MGE/AEP VZ and SVZ, or just the VZ alone and exported into ImageJ v1.37g. The Analyze Particles tool was used to count the number of PH3+ nuclei per each section, which was done in a blinded fashion to the genotype. The number of PH3 positive cells was summed per brain, and the mean and SEM was calculated for all brains analyzed. To calculate the number of PH3+/OLIG2+ cells, the number of PH3+ cells that did not co-express the markers was counted using Photoshop and ImageJ. This number was subtracted from the total number of PH3+ cells to calculate the number of PH3+/OLIG2+ cells.
Supplementary Material
Acknowledgments
We would like to thank Kazuaki Yoshikawa for his gift of the DLX2 antibody, Michael Wegner for his gift of the SOX10 antibody, Charles Stiles for OLIG1 and OLIG2 antibodies, and Chris Potter for comments on the manuscript. This work was supported by research grants to JLRR from Nina Ireland, Larry L. Hillblom Foundation, NIMH RO1 MH49428-01 and K05 MH065670, to DHR from NIH R01 NS40511 and National Multiple Sclerosis Society, to MAP from NICHD HD-07162H, and to GBP through NIMH F32 MH070211 and a California Institute of Regenerative Medicine’s Postdoctoral Fellowship. The authors declare they have no financial conflicts of interest.
Footnotes
Publisher's Disclaimer: This is a PDF file of an unedited manuscript that has been accepted for publication. As a service to our customers we are providing this early version of the manuscript. The manuscript will undergo copyediting, typesetting, and review of the resulting proof before it is published in its final citable form. Please note that during the production process errors may be discovered which could affect the content, and all legal disclaimers that apply to the journal pertain.
References
- Agius E, Soukkarieh C, Danesin C, Kan P, Takebayashi H, Soula C, Cochard P. Converse control of oligodendrocyte and astrocyte lineage development by Sonic hedgehog in the chick spinal cord. Dev Biol. 2004;270:308–321. doi: 10.1016/j.ydbio.2004.02.015. [DOI] [PubMed] [Google Scholar]
- Aguirre AA, Chittajallu R, Belachew S, Gallo V. NG2-expressing cells in the subventricular zone are type C-like cells and contribute to interneuron generation in the postnatal hippocampus. J Cell Biol. 2004;165:575–589. doi: 10.1083/jcb.200311141. [DOI] [PMC free article] [PubMed] [Google Scholar]
- Alberta JA, Park SK, Mora J, Yuk D, Pawlitzky I, Iannarelli P, Vartanian T, Stiles CD, Rowitch DH. Sonic hedgehog is required during an early phase of oligodendrocyte development in mammalian brain. Mol Cell Neurosci. 2001;18:434–441. doi: 10.1006/mcne.2001.1026. [DOI] [PubMed] [Google Scholar]
- Alvarez-Dolado M, Calcagnotto ME, Karkar KM, Southwell DG, Jones-Davis DM, Estrada RC, Rubenstein JL, Alvarez-Buylla A, Baraban SC. Cortical inhibition modified by embryonic neural precursors grafted into the postnatal brain. J Neurosci. 2006;26:7380–7389. doi: 10.1523/JNEUROSCI.1540-06.2006. [DOI] [PMC free article] [PubMed] [Google Scholar]
- Anderson S, Mione M, Yun K, Rubenstein JL. Differential origins of neocortical projection and local circuit neurons: role of Dlx genes in neocortical interneuronogenesis. Cereb Cortex. 1999;9:646–654. doi: 10.1093/cercor/9.6.646. [DOI] [PubMed] [Google Scholar]
- Anderson SA, Eisenstat DD, Shi L, Rubenstein JL. Interneuron migration from basal forebrain to neocortex: dependence on Dlx genes. Science. 1997a;278:474–476. doi: 10.1126/science.278.5337.474. [DOI] [PubMed] [Google Scholar]
- Anderson SA, Kaznowski CE, Horn C, Rubenstein JL, McConnell SK. Distinct origins of neocortical projection neurons and interneurons in vivo. Cereb Cortex. 2002;12:702–709. doi: 10.1093/cercor/12.7.702. [DOI] [PubMed] [Google Scholar]
- Anderson SA, Marin O, Horn C, Jennings K, Rubenstein JL. Distinct cortical migrations from the medial and lateral ganglionic eminences. Development. 2001;128:353–363. doi: 10.1242/dev.128.3.353. [DOI] [PubMed] [Google Scholar]
- Anderson SA, Qiu M, Bulfone A, Eisenstat DD, Meneses J, Pedersen R, Rubenstein JL. Mutations of the homeobox genes Dlx-1 and Dlx-2 disrupt the striatal subventricular zone and differentiation of late born striatal neurons. Neuron. 1997b;19:27–37. doi: 10.1016/s0896-6273(00)80345-1. [DOI] [PubMed] [Google Scholar]
- Battiste J, Helms AW, Kim EJ, Savage TK, Lagace DC, Mandyam CD, Eisch AJ, Miyoshi G, Johnson JE. Ascl1 defines sequentially generated lineage-restricted neuronal and oligodendrocyte precursor cells in the spinal cord. Development. 2007;134:285–293. doi: 10.1242/dev.02727. [DOI] [PubMed] [Google Scholar]
- Cai J, Qi Y, Hu X, Tan M, Liu Z, Zhang J, Li Q, Sander M, Qiu M. Generation of oligodendrocyte precursor cells from mouse dorsal spinal cord independent of Nkx6 regulation and Shh signaling. Neuron. 2005;45:41–53. doi: 10.1016/j.neuron.2004.12.028. [DOI] [PubMed] [Google Scholar]
- Casarosa S, Fode C, Guillemot F. Mash1 regulates neurogenesis in the ventral telencephalon. Development. 1999;126:525–534. doi: 10.1242/dev.126.3.525. [DOI] [PubMed] [Google Scholar]
- Cobos I, Calcagnotto ME, Vilaythong AJ, Thwin MT, Noebels JL, Baraban SC, Rubenstein JL. Mice lacking Dlx1 show subtype-specific loss of interneurons, reduced inhibition and epilepsy. Nat Neurosci. 2005;8:1059–1068. doi: 10.1038/nn1499. [DOI] [PubMed] [Google Scholar]
- Cobos I, Long JE, Thwin MT, Rubenstein JL. Cellular patterns of transcription factor expression in developing cortical interneurons. Cereb Cortex. 2006;16(Suppl 1):i82–88. doi: 10.1093/cercor/bhk003. [DOI] [PubMed] [Google Scholar]
- Deneen B, Ho R, Lukaszewicz A, Hochstim CJ, Gronostajski RM, Anderson DJ. The Transcription Factor NFIA Controls the Onset of Gliogenesis in the Developing Spinal Cord. Neuron. 2006;52:953–968. doi: 10.1016/j.neuron.2006.11.019. [DOI] [PubMed] [Google Scholar]
- Eisenstat DD, Liu JK, Mione M, Zhong W, Yu G, Anderson SA, Ghattas I, Puelles L, Rubenstein JL. DLX-1, DLX-2, and DLX-5 expression define distinct stages of basal forebrain differentiation. J Comp Neurol. 1999;414:217–237. doi: 10.1002/(sici)1096-9861(19991115)414:2<217::aid-cne6>3.0.co;2-i. [DOI] [PubMed] [Google Scholar]
- Furusho M, Ono K, Takebayashi H, Masahira N, Kagawa T, Ikeda K, Ikenaka K. Involvement of the Olig2 transcription factor in cholinergic neuron development of the basal forebrain. Dev Biol. 2006;293:348–357. doi: 10.1016/j.ydbio.2006.01.031. [DOI] [PubMed] [Google Scholar]
- Gokhan S, Marin-Husstege M, Yung SY, Fontanez D, Casaccia-Bonnefil P, Mehler MF. Combinatorial profiles of oligodendrocyte-selective classes of transcriptional regulators differentially modulate myelin basic protein gene expression. J Neurosci. 2005;25:8311–8321. doi: 10.1523/JNEUROSCI.1850-05.2005. [DOI] [PMC free article] [PubMed] [Google Scholar]
- He W, Ingraham C, Rising L, Goderie S, Temple S. Multipotent stem cells from the mouse basal forebrain contribute GABAergic neurons and oligodendrocytes to the cerebral cortex during embryogenesis. J Neurosci. 2001;21:8854–8862. doi: 10.1523/JNEUROSCI.21-22-08854.2001. [DOI] [PMC free article] [PubMed] [Google Scholar]
- Horton S, Meredith A, Richardson JA, Johnson JE. Correct coordination of neuronal differentiation events in ventral forebrain requires the bHLH factor MASH1. Mol Cell Neurosci. 1999;14:355–369. doi: 10.1006/mcne.1999.0791. [DOI] [PubMed] [Google Scholar]
- Ivanova A, Nakahira E, Kagawa T, Oba A, Wada T, Takebayashi H, Spassky N, Levine J, Zalc B, Ikenaka K. Evidence for a second wave of oligodendrogenesis in the postnatal cerebral cortex of the mouse. J Neurosci Res. 2003;73:581–592. doi: 10.1002/jnr.10717. [DOI] [PubMed] [Google Scholar]
- Kessaris N, Fogarty M, Iannarelli P, Grist M, Wegner M, Richardson WD. Competing waves of oligodendrocytes in the forebrain and postnatal elimination of an embryonic lineage. Nat Neurosci. 2006;9:173–179. doi: 10.1038/nn1620. [DOI] [PMC free article] [PubMed] [Google Scholar]
- Le Bras B, Chatzopoulou E, Heydon K, Martinez S, Ikenaka K, Prestoz L, Spassky N, Zalc B, Thomas JL. Oligodendrocyte development in the embryonic brain: the contribution of the plp lineage. Int J Dev Biol. 2005;49:209–220. doi: 10.1387/ijdb.041963bl. [DOI] [PubMed] [Google Scholar]
- Lee SK, Lee B, Ruiz EC, Pfaff SL. Olig2 and Ngn2 function in opposition to modulate gene expression in motor neuron progenitor cells. Genes Dev. 2005;19:282–294. doi: 10.1101/gad.1257105. [DOI] [PMC free article] [PubMed] [Google Scholar]
- Letinic K, Zoncu R, Rakic P. Origin of GABAergic neurons in the human neocortex. Nature. 2002;417:645–649. doi: 10.1038/nature00779. [DOI] [PubMed] [Google Scholar]
- Liu Z, Hu X, Cai J, Liu B, Peng X, Wegner M, Qiu M. Induction of oligodendrocyte differentiation by Olig2 and Sox10: Evidence for reciprocal interactions and dosage-dependent mechanisms. Dev Biol. 2006 doi: 10.1016/j.ydbio.2006.10.007. [DOI] [PubMed] [Google Scholar]
- Lu QR, Sun T, Zhu Z, Ma N, Garcia M, Stiles CD, Rowitch DH. Common developmental requirement for Olig function indicates a motor neuron/oligodendrocyte connection. Cell. 2002;109:75–86. doi: 10.1016/s0092-8674(02)00678-5. [DOI] [PubMed] [Google Scholar]
- Lu QR, Yuk D, Alberta JA, Zhu Z, Pawlitzky I, Chan J, McMahon AP, Stiles CD, Rowitch DH. Sonic hedgehog--regulated oligodendrocyte lineage genes encoding bHLH proteins in the mammalian central nervous system. Neuron. 2000;25:317–329. doi: 10.1016/s0896-6273(00)80897-1. [DOI] [PubMed] [Google Scholar]
- Marin O, Anderson SA, Rubenstein JL. Origin and molecular specification of striatal interneurons. J Neurosci. 2000;20:6063–6076. doi: 10.1523/JNEUROSCI.20-16-06063.2000. [DOI] [PMC free article] [PubMed] [Google Scholar]
- Marshall CA, Goldman JE. Subpallial dlx2-expressing cells give rise to astrocytes and oligodendrocytes in the cerebral cortex and white matter. J Neurosci. 2002;22:9821–9830. doi: 10.1523/JNEUROSCI.22-22-09821.2002. [DOI] [PMC free article] [PubMed] [Google Scholar]
- Menn B, Garcia-Verdugo JM, Yaschine C, Gonzalez-Perez O, Rowitch D, Alvarez-Buylla A. Origin of oligodendrocytes in the subventricular zone of the adult brain. J Neurosci. 2006;26:7907–7918. doi: 10.1523/JNEUROSCI.1299-06.2006. [DOI] [PMC free article] [PubMed] [Google Scholar]
- Merkle FT, Alvarez-Buylla A. Neural stem cells in mammalian development. Curr Opin Cell Biol. 2006;18:704–709. doi: 10.1016/j.ceb.2006.09.008. [DOI] [PubMed] [Google Scholar]
- Miller RH. Regulation of oligodendrocyte development in the vertebrate CNS. Prog Neurobiol. 2002;67:451–467. doi: 10.1016/s0301-0082(02)00058-8. [DOI] [PubMed] [Google Scholar]
- Nery S, Wichterle H, Fishell G. Sonic hedgehog contributes to oligodendrocyte specification in the mammalian forebrain. Development. 2001;128:527–540. doi: 10.1242/dev.128.4.527. [DOI] [PubMed] [Google Scholar]
- Novitch BG, Chen AI, Jessell TM. Coordinate regulation of motor neuron subtype identity and pan-neuronal properties by the bHLH repressor Olig2. Neuron. 2001;31:773–789. doi: 10.1016/s0896-6273(01)00407-x. [DOI] [PubMed] [Google Scholar]
- Oh S, Huang X, Chiang C. Specific requirements of sonic hedgehog signaling during oligodendrocyte development. Dev Dyn. 2005;234:489–496. doi: 10.1002/dvdy.20422. [DOI] [PubMed] [Google Scholar]
- Panganiban G, Rubenstein JL. Developmental functions of the Distal-less/Dlx homeobox genes. Development. 2002;129:4371–4386. doi: 10.1242/dev.129.19.4371. [DOI] [PubMed] [Google Scholar]
- Park HC, Appel B. Delta-Notch signaling regulates oligodendrocyte specification. Development. 2003;130:3747–3755. doi: 10.1242/dev.00576. [DOI] [PubMed] [Google Scholar]
- Parras CM, Galli R, Britz O, Soares S, Galichet C, Battiste J, Johnson JE, Nakafuku M, Vescovi A, Guillemot F. Mash1 specifies neurons and oligodendrocytes in the postnatal brain. Embo J. 2004;23:4495–4505. doi: 10.1038/sj.emboj.7600447. [DOI] [PMC free article] [PubMed] [Google Scholar]
- Parras CM, Hunt C, Sugimori M, Nakafuku M, Rowitch D, Guillemot F. The Proneural Gene Mash1 Specifies an Early Population of Telencephalic Oligodendrocytes. J Neurosci. 2007;27:4233–4242. doi: 10.1523/JNEUROSCI.0126-07.2007. [DOI] [PMC free article] [PubMed] [Google Scholar]
- Poitras L, Ghanem N, Hatch G, Ekker M. The proneural determinant MASH1 regulates forebrain Dlx1/2 expression through the I12b intergenic enhancer. Development. 2007;134:1755–1765. doi: 10.1242/dev.02845. [DOI] [PubMed] [Google Scholar]
- Qi Y, Cai J, Wu Y, Wu R, Lee J, Fu H, Rao M, Sussel L, Rubenstein J, Qiu M. Control of oligodendrocyte differentiation by the Nkx2.2 homeodomain transcription factor. Development. 2001;128:2723–2733. doi: 10.1242/dev.128.14.2723. [DOI] [PubMed] [Google Scholar]
- Qiu M, Bulfone A, Ghattas I, Meneses JJ, Christensen L, Sharpe PT, Presley R, Pedersen RA, Rubenstein JL. Role of the Dlx homeobox genes in proximodistal patterning of the branchial arches: mutations of Dlx-1, Dlx-2, and Dlx-1 and -2 alter morphogenesis of proximal skeletal and soft tissue structures derived from the first and second arches. Dev Biol. 1997;185:165–184. doi: 10.1006/dbio.1997.8556. [DOI] [PubMed] [Google Scholar]
- Rowitch DH. Glial specification in the vertebrate neural tube. Nat Rev Neurosci. 2004;5:409–419. doi: 10.1038/nrn1389. [DOI] [PubMed] [Google Scholar]
- Rowitch DH, Lu QR, Kessaris N, Richardson WD. An ‘oligarchy’ rules neural development. Trends Neurosci. 2002;25:417–422. doi: 10.1016/s0166-2236(02)02201-4. [DOI] [PubMed] [Google Scholar]
- Samanta J, Kessler JA. Interactions between ID and OLIG proteins mediate the inhibitory effects of BMP4 on oligodendroglial differentiation. Development. 2004;131:4131–4142. doi: 10.1242/dev.01273. [DOI] [PubMed] [Google Scholar]
- Stolt CC, Lommes P, Sock E, Chaboissier MC, Schedl A, Wegner M. The Sox9 transcription factor determines glial fate choice in the developing spinal cord. Genes Dev. 2003;17:1677–1689. doi: 10.1101/gad.259003. [DOI] [PMC free article] [PubMed] [Google Scholar]
- Stuhmer T, Anderson SA, Ekker M, Rubenstein JL. Ectopic expression of the Dlx genes induces glutamic acid decarboxylase and Dlx expression. Development. 2002a;129:245–252. doi: 10.1242/dev.129.1.245. [DOI] [PubMed] [Google Scholar]
- Stuhmer T, Puelles L, Ekker M, Rubenstein JL. Expression from a Dlx gene enhancer marks adult mouse cortical GABAergic neurons. Cereb Cortex. 2002b;12:75–85. doi: 10.1093/cercor/12.1.75. [DOI] [PubMed] [Google Scholar]
- Sun T, Dong H, Wu L, Kane M, Rowitch DH, Stiles CD. Cross-repressive interaction of the Olig2 and Nkx2.2 transcription factors in developing neural tube associated with formation of a specific physical complex. J Neurosci. 2003;23:9547–9556. doi: 10.1523/JNEUROSCI.23-29-09547.2003. [DOI] [PMC free article] [PubMed] [Google Scholar]
- Sussman CR, Davies JE, Miller RH. Extracellular and intracellular regulation of oligodendrocyte development: roles of Sonic hedgehog and expression of E proteins. Glia. 2002;40:55–64. doi: 10.1002/glia.10114. [DOI] [PubMed] [Google Scholar]
- Takebayashi H, Nabeshima Y, Yoshida S, Chisaka O, Ikenaka K, Nabeshima Y. The basic helix-loop-helix factor olig2 is essential for the development of motoneuron and oligodendrocyte lineages. Curr Biol. 2002;12:1157–1163. doi: 10.1016/s0960-9822(02)00926-0. [DOI] [PubMed] [Google Scholar]
- Tekki-Kessaris N, Woodruff R, Hall AC, Gaffield W, Kimura S, Stiles CD, Rowitch DH, Richardson WD. Hedgehog-dependent oligodendrocyte lineage specification in the telencephalon. Development. 2001;128:2545–2554. doi: 10.1242/dev.128.13.2545. [DOI] [PubMed] [Google Scholar]
- Vallstedt A, Klos JM, Ericson J. Multiple dorsoventral origins of oligodendrocyte generation in the spinal cord and hindbrain. Neuron. 2005;45:55–67. doi: 10.1016/j.neuron.2004.12.026. [DOI] [PubMed] [Google Scholar]
- Wichterle H, Garcia-Verdugo JM, Herrera DG, Alvarez-Buylla A. Young neurons from medial ganglionic eminence disperse in adult and embryonic brain. Nat Neurosci. 1999;2:461–466. doi: 10.1038/8131. [DOI] [PubMed] [Google Scholar]
- Wonders CP, Anderson SA. The origin and specification of cortical interneurons. Nat Rev Neurosci. 2006;7:687–696. doi: 10.1038/nrn1954. [DOI] [PubMed] [Google Scholar]
- Woodruff RH, Tekki-Kessaris N, Stiles CD, Rowitch DH, Richardson WD. Oligodendrocyte development in the spinal cord and telencephalon: common themes and new perspectives. Int J Dev Neurosci. 2001;19:379–385. doi: 10.1016/s0736-5748(00)00083-6. [DOI] [PubMed] [Google Scholar]
- Xin M, Yue T, Ma Z, Wu FF, Gow A, Lu QR. Myelinogenesis and axonal recognition by oligodendrocytes in brain are uncoupled in Olig1-null mice. J Neurosci. 2005;25:1354–1365. doi: 10.1523/JNEUROSCI.3034-04.2005. [DOI] [PMC free article] [PubMed] [Google Scholar]
- Xu Q, Cobos I, De La Cruz E, Rubenstein JL, Anderson SA. Origins of cortical interneuron subtypes. J Neurosci. 2004;24:2612–2622. doi: 10.1523/JNEUROSCI.5667-03.2004. [DOI] [PMC free article] [PubMed] [Google Scholar]
- Yun K, Fischman S, Johnson J, Hrabe de Angelis M, Weinmaster G, Rubenstein JL. Modulation of the notch signaling by Mash1 and Dlx1/2 regulates sequential specification and differentiation of progenitor cell types in the subcortical telencephalon. Development. 2002;129:5029–5040. doi: 10.1242/dev.129.21.5029. [DOI] [PubMed] [Google Scholar]
- Yung SY, Gokhan S, Jurcsak J, Molero AE, Abrajano JJ, Mehler MF. Differential modulation of BMP signaling promotes the elaboration of cerebral cortical GABAergic neurons or oligodendrocytes from a common sonic hedgehog-responsive ventral forebrain progenitor species. Proc Natl Acad Sci U S A. 2002;99:16273–16278. doi: 10.1073/pnas.232586699. [DOI] [PMC free article] [PubMed] [Google Scholar]
- Zhou Q, Anderson DJ. The bHLH transcription factors OLIG2 and OLIG1 couple neuronal and glial subtype specification. Cell. 2002;109:61–73. doi: 10.1016/s0092-8674(02)00677-3. [DOI] [PubMed] [Google Scholar]
- Zhou Q, Choi G, Anderson DJ. The bHLH transcription factor Olig2 promotes oligodendrocyte differentiation in collaboration with Nkx2.2. Neuron. 2001;31:791–807. doi: 10.1016/s0896-6273(01)00414-7. [DOI] [PubMed] [Google Scholar]
Associated Data
This section collects any data citations, data availability statements, or supplementary materials included in this article.