

Abstract
Early diagnosis of Parkinson’s disease (PD) is required to improve therapeutic responses. Indeed, a clinical diagnosis of resting tremor, rigidity, movement and postural deficiencies usually reflect >50% loss of the nigrostriatal system in disease. In a step to address this, quantitative diffusion tensor magnetic resonance imaging (DTI) was used to assess nigrostriatal degeneration in the 1-methyl-4-phenyl-1,2,3,6-tetrahydropyridine (MPTP) intoxication model of dopaminergic nigral degeneration. We now demonstrate increased average diffusion (p < 0.005) and decreased fractional anisotropy (p < 0.03) in the substantia nigra (SN) of 5- to 7-day MPTP-treated animals when compared to saline controls. Transverse diffusivity demonstrated the most significant differences (p ≤0.002) and correlated with the numbers of SN dopaminergic neurons (r = −0.75, p = 0.012). No differences were found in the striatum, corpus callosum, cerebral cortex, or ventricles. These results demonstrate that DTI may be used as a surrogate biomarker of nigral dopaminergic neuronal degeneration.
Keywords: Parkinson’s disease; Diffusion tensor imaging; 1-Methyl-4-phenyl-1,2,3,6-tetrahydropyridine; MPTP; Substantia nigra; Striatum; Dopaminergic neurons
Introduction
Parkinson’s disease (PD) is a common and debilitating neurodegenerative disorder. Symptoms of tremor, rigidity, bradykinesia, and postural instability commonly progress to significant movement and cognitive dysfunction. Pathological changes in the substantia nigra pars compacta (SNpc) and striatum consist of nigral dopaminergic neuronal loss, intraneuronal cytoplasmic inclusions or “Lewy bodies”, micro- and astro-gliosis, and striatal dopamine depletion (Fahn and Przedborski, 2000). Innate immunity involving resident microglial cells with secretion of neurotoxic cytokines and production of reactive oxygen and nitrogen species contribute, in part, to nigrostriatal dopaminergic degeneration (Gao et al., 2003). Disease is often advanced when classic clinical features manifest. Indeed, a diagnosis of PD is most commonly made in the later stages of disease when >50% of SNpc neurons and their terminals are destroyed (Bernheimer et al., 1973). If an early diagnosis could be made, it would enable interventional therapies at times when disease outcomes could yield positive results (Simpkins and Jankovic, 2003).
In this regard, imaging research activities for PD have focused on finding better means to assess nigrostriatal degeneration. Functional imaging including single photon emission computerized tomography (Benamer et al., 2000), positron emission tomography (Eidelberg et al., 1995; Morrish et al., 1996), proton magnetic resonance spectroscopic imaging (1H MRSI) (Cruz et al., 1997; Boska et al., 2005), and functional magnetic resonance imaging (Ceballos-Baumann, 2003) have all proved promising but not definitive. One promising and new approach that has gained attention for tracking age-related changes in human brain and for the diagnosis of neurodegenerative diseases is magnetic resonance diffusion tensor imaging (DTI) (McGraw et al., 2005). DTI tests have also been used in animal models of human disease such as multiple sclerosis and Alzheimer’s disease (Song et al., 2004; Song et al., 2005).
With this in mind, we developed and tested the ability of high field (7 T) mouse brain DTI to monitor dopaminergic neurodegeneration in the substantia nigra (SN) in 1-methyl-4-phenyl-1,2,3,6-tetrahydropyridine (MPTP)-intoxicated mice (Vila and Przedborski, 2003). This disease model, in part, mimics advanced PD in demonstrating diminished dopamine and dopaminergic neuronal termini loss and micro- and astro-glial inflammatory responses (Gao et al., 2003). Thus, nigral dopaminergic neuronal degeneration was assessed by DTI for its ability to serve as a non-invasive biomarker for aspects of PD-associated neurodegeneration.
Materials and methods
Animals and MPTP Intoxication
Male C57BL/6J mice were purchased from Jackson Laboratories (Bar Harbor, ME) and placed in the study at 6–10 weeks of age. Mice were administered 18 mg/kg MPTP (free base) (Sigma-Aldrich Chemical Co., St Louis, MO) in phosphate buffered saline (PBS) i.p. every 2 h for a total of 4 injections or PBS alone as vehicle controls. Additionally, mice scanned prior to intoxication served as autologous controls. All animal procedures were in accordance with National Institutes of Health guidelines and were approved by the Institutional Animal Care and Use Committee of the University of Nebraska Medical Center.
Magnetic resonance imaging (MRI) and DTI acquisition
Mice were anesthetized by inhalation of 1% isoflurane in a nitrous oxide/oxygen mixture prior to MRI data acquisition. MRI data were obtained with a Bruker Avance 7 T/21 cm small bore system operating at 300.41 MHz using actively decoupled 72 mm volume coil transmit and a laboratory built 1.25×1.5 cm receiver surface coil. Reference coronal mouse brain images were obtained using 3D FLASH with acquisition parameters of 24 ×24 ×16 mm field-of-view (FOV), a 128 × 128×32 matrix, 35° flip angle, 50 ms repetition time (TR), 3 ms echo time (TE), and two averages for a total acquisition time of 7.5 min. DTI data were acquired using a two-shot diffusion-weighted spin-echo echo-planar image (TE = 29 ms). Respiratory gating was used to prevent motion artifacts. Acquisition was repeated at TR = 10–15 s depending on respiratory rate and one shot per breath. TR = 7 s was used for phantom studies. EPI acquisition parameters included: 14 slices, 200 kHz bandwidth, 96 ×96 in-plane acquisition zero-filled to 256×256, and a 0.5-mm slice thickness. The diffusion encoding used was a balanced, rotationally invariant and alternating polarity icosahedral scheme (12 directions) (Hasan et al., 2001a,b). The encoding scheme was designed to reduce background-diffusion gradient couplings (Neeman et al., 1991). Diffusion weighting b-factor = 800 s/mm, δ=4 ms, Δ=15 ms, Gdmax = 40 G/cm, 200 μs rise time, 7 averages for b=0 acquisition, 3 averages for each b=800 encoding direction, for a total acquisition time of 20–40 min, depending on respiration rate.
Respiratory monitoring of animals, gating of the MRI system, and temperature monitoring of phantoms were done using an SA instruments model 1025 MRI compatible physiological monitoring system (Model 1025, SA Instruments, Stony Brook, NY). Animal temperature control was maintained using a circulating water bath (Gaymar Industries, Orchard Park, NY) with heat exchange coils surrounding the mouse body on custom constructed MRI compatible stereotactic mouse holder to immobilize the head.
Quality controls
Water phantom studies using identical acquisition parameters and coils as the in vivo data were acquired monthly for quality assurance of instrument stability as well as to validate the lack of direct effect of MPTP on Dav and FA. Phantoms consisted of 6-ml vials containing PBS, and two additional phantoms with MPTP at concentrations of 21.78 mg/ml MPTP–HCl (18 mg/ml free base) and 2.178 mg/ml MPTP–HCl (1.8 mg/ml free base) in PBS. These phantoms were chosen as they closely matched the coil loading of a mouse. Phantom temperature was monitored by the thermocouple of the MRI compatible monitoring system (SA Instruments). These studies show consistent temperature corrected Dav (mean±SD: 2.29±0.30×10⁻³ mm2/s at 24 °C) and low FA (0.065±0.035) with no effect of MPTP concentration which was stable over time (Mills, 1973).
Stereology
Following day 7 DTI scans, mice were sacrificed by pentobarbital overdose and perfused with PBS followed by 4% paraformaldehyde. Brains were harvested, post-fixed with 4% paraformaldehyde, cryoprotected in 30% sucrose, and processed for immunohistochemistry. Processed brains were embedded in OCT medium and 30-μm coronal sections were cut throughout the brain. Every 4th serial section maintained as free-floating tissue was stained for tyrosine hydroxylase (TH). Free-floating tissues were reacted with a 1:2000 dilution of rabbit polyclonal anti-TH (Calbiochem-Novabiochem Corp., San Diego, CA). Anti-TH immunoglobulin was detected with a 1:400 dilution of biotinylated goat anti-rabbit IgG, followed by streptavidin-conjugated horse-radish peroxidase (HRP) (Vectastain ABC kit, Vector Laboratories, Burlingame, CA). Positive immunostaining was visualized with 3,3′-diaminobenzidine (DAB, Sigma) after reaction with hydrogen peroxide (DAB kit, Vector Laboratories). Free-floating sections were then mounted onto slides and counterstained with thionin for Nissl substance. Total numbers of TH- and Nissl-stained neurons in SNpc were quantified by stereological counts using the Optical Fractionator probe of Stereo Investigator software (MicroBright-field, Williston, VT) (Liberatore et al., 1999). Laboratory personnel were blinded to the identity of the histological sections.
Image analysis
3D MRI scans were zero-filled to 256×256×64, input into Analyze (Biomedical Imaging Resource, Mayo Clinic, Rochester, MN) and the skulls were digitally removed from the brain tissue (subimaged). Subimaged mouse brains were coregistered to the mouse brain atlas (MBAT, Laboratory of Neuroimaging, UCLA) (Lee et al., 2005) for positive identification of the SN. Coregistration allowed positive identification of the appearance of the SN on the diffusion anisotropy-modulated principal eigenvector maps.
Analyses of the diffusion-weighted data were performed using custom programs written in IDL as previously described (Basser et al., 1994; Hasan et al., 2001a,b). Analyses produced maps of the tensor diffusivities (λ1, λ2, λ3), average diffusivity (Dav) where: Dav = 1/3*(λ1 + λ2 + λ3) and fractional anisotropy (FA), where:
Transverse (λ⊥ = (λ2 + λ3)/2) and longitudinal (λ|| = λ1) components of the diffusion tensor were obtained as described elsewhere (Hasan and Narayana, 2006).
Statistical analysis
Values of Dav, FA, λ⊥, and λ|| were acquired from both hemispheres of each mouse studied and the values from both regions of interest were averaged to arrive at the value of each variable as a single observation within each mouse, as paired t-test demonstrated no difference between results in the two hemispheres. Changes of FA, Dav, λ⊥, and λ|| over time were analyzed using one-way ANOVA. Comparisons between pre-injection values of FA, Dav, λ⊥, and λ|| at each time point within each group were compared using least significant difference (LSD) post hoc tests. In addition, the values of FA, Dav, λ⊥, and λ|| between control (PBS-treated) and MPTP-treated animals at each time point were compared using LSD post hoc tests. Correlations between neuronal counts and FA, Dav, λ⊥, and λ|| were tested using Pearson’s correlation. Stereology results were compared using unpaired t-tests. Differences and correlations were considered significant at p<0.05. Statistical comparisons were performed using SPSS 14 (SPSS Inc., Chicago, IL).
Results
Registration of the MRI with the Biomedical Informatics Research Network (BIRN) mouse brain atlas (MBAT)
Registration of the reference MRI (3D Flash, TR = 50 ms, TE = 3 ms, NA= 2, FOV= 24 mm × 24 mm × 16 mm, image dimensions = 128 × 128 × 32) to the BRIN mouse atlas was performed using the Automatic Image Registration (AIR) algorithm within the Analyze software package. This step was utilized for registration of DTI and FLASH MRI scans to the atlas for unambiguous identification of the region containing the SN (Fig. 1).
Fig. 1.
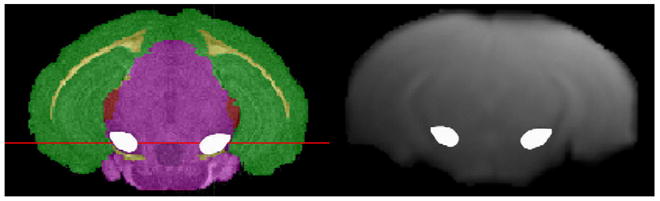
Coregistration of the Mouse Brain Atlas (left) and reference MRI (right) with the SN on both images (white outlines).
Echo-planar imaging (EPI) DTI
Diffusion anisotropy images are displayed as color encoded by the direction of the primary eigenvalue with left–right direction (X) encoded as red, anterior–posterior (or dorsal–ventral) direction (Y) encoded as green, and caudal–rostral (Z) direction encoded as blue. A representative analysis of the primary eigenvector direction result with the threshold set to a value of FA>0.15 and overlaid on the Dav image from one mouse is shown in Fig. 2. This figure identifies the regions used for analysis of FA, Dav, λ⊥, and λ||.
Fig. 2.
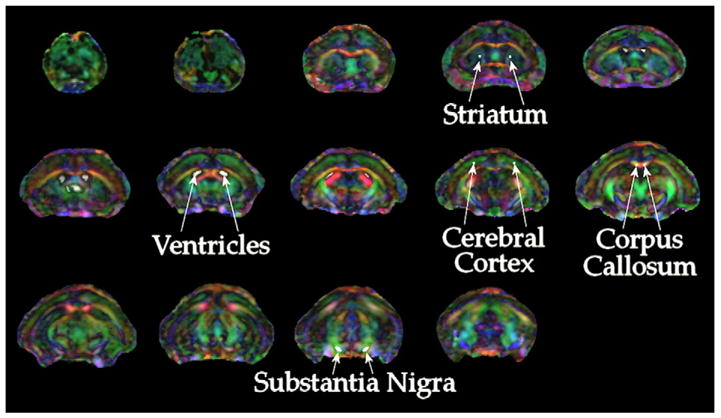
DTI of the mouse brain. Color encoding of the direction of the primary eigenvalue (λ1) of the diffusion tensor is used to identify anatomical regions for analysis. Acquisition and analysis procedures are detailed in the materials and methods.
FA, Dav, λ⊥, and λ|| and numbers of SN dopaminergic neurons
Comparison of mean FA, Dav, λ⊥, and λ|| values were performed in five bilateral areas in each of five MPTP-treated and five PBS-treated control mice as denoted in Fig. 2. Areas included the corpus callosum and cerebral cortex ROIs were obtained as representative of white matter and cortical gray matter, respectively. Ventricles were used as a high-diffusivity, low-FA control. Measures in the striatum and SN were tested for effects of dopaminergic neurodegeneration. Over time, significant increases in Dav, λ⊥, and λ|| and decreases in FA were detected within the SN (p≤0.01 for Dav, λ⊥, and FA, and p=0.038 for λ||). Comparison of MPTP-treated mice with PBS-treated controls as well as mice scanned prior to MPTP-treatment indicated these differences occurred by days 5 and 7 post-MPTP treatment (p≤0.05) (Fig. 3). The greatest changes were observed in measurements of λ⊥ by days 5 and 7 (p≤0.0002 except p=0.0065 day 5 compared to autologous control). No significant differences were detected within ventricles, striatum, cerebral cortex or corpus callosum of MPTP-treated mice compared to either PBS-treated controls or autologous pre-treated controls.
Fig. 3.
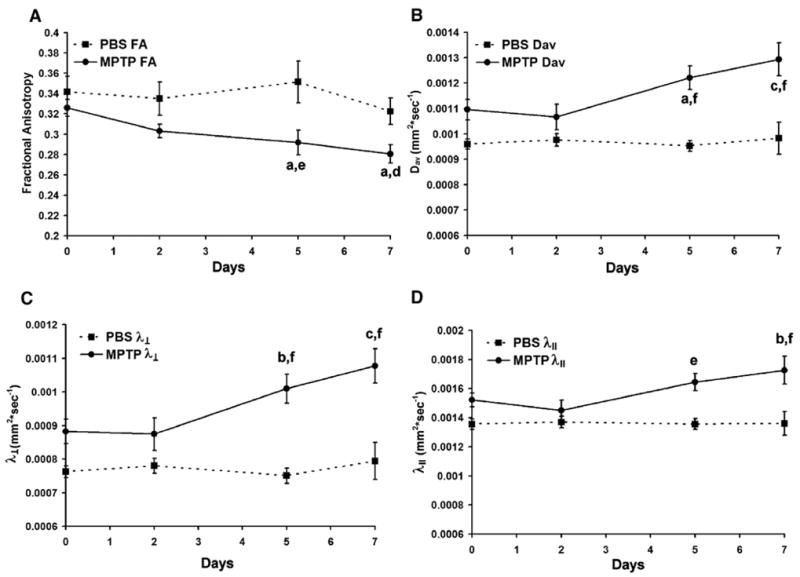
Quantitative DTI results from (A) FA, (B) Dav, (C) transverse component of Dav (λ⊥) and (D) longitudinal component of Dav (λ||) versus time in the SN. No significant differences were found in the striatum, corpus callosum cerebral cortex and ventricles. The SN demonstrated a significant increase in Dav, λ⊥, λ||, and decrease in FA at days 5 and 7. Displayed are mean±SEM of the average bilateral result from each mouse as detailed in the materials and methods. P-values of LSD post hoc comparisons of MPTP-treated animals to autologous pre-scanned controls (a–c), and time-matched PBS-treated controls (d–f) where a,dp<0.05; b,ep<0.01; c,fp<0.001.
Stereology of dopaminergic and GABAergic neurons in MPTP-intoxicated mice
Numbers of TH+ Nissl+ (dopaminergic) or TH− Nissl+ neurons from MPTP- and PBS-treated mice at day 7 post-treatment were determined by stereological analysis. MPTP treatment resulted in a significant 82.0% ± 1.4% (mean ± SEM; p = 0.00002) loss of dopaminergic neurons in the SN compared to PBS-treated controls, whereas no significant effects on TH− Nissl+ neurons were detected (data not shown). Representative examples of coronal sections through the SN of brains from PBS–MPTP-treated mice stained for TH are shown in Fig. 4.
Fig. 4.
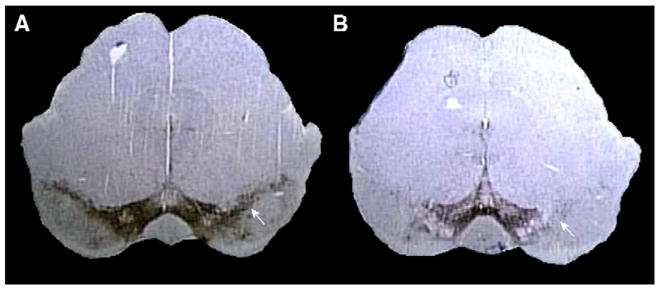
Assessments of dopaminergic neuronal loss in the SN 7 days after acute MPTP intoxication (brown). Examples of coronal histological sections from (A) PBS-treated control and (B) MPTP-treated mouse. Reduction in numbers of TH+ dopaminergic neurons is apparent within the SN (white arrow).
Correlation between FA, Dav, λ⊥, and λ|| and dopaminergic neurons
To determine whether DTI measurements correlated with dopaminergic loss, mice were sacrificed after DTI measurements on day 7 post-MPTP or -PBS treatment, and numbers of dopaminergic neurons within the SN were determined and compared with each DTI measurements at that time. Significant inverse correlations were found between numbers of surviving TH+ neurons and measurements of λ⊥ (r=−0.775, p=0.0085) (Fig. 5), Dav (r = −0.73, p=0.016), λ|| (r = −0.70, p=0.023) (data not shown). No significant correlation could be determined between FA and TH+ neurons (r=0.45, p=0.193).
Fig. 5.
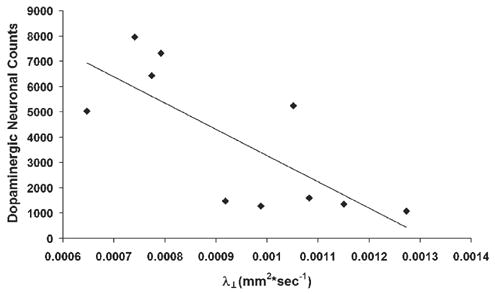
Pearson correlation between TH+ neurons assessed by stereology and the transverse component of Dav (λ⊥). Data points are shown from individual mice. A line was generated that represents a correlation between λ⊥ and TH+ neurons. λ⊥ correlates with numbers of TH+ neurons (r=−0.775, p=0.0085).
Vector representation of dopaminergic neurodegeneration
SN dopaminergic degeneration were represented visually in two-dimensional space when plotting either FA vs. Dav or λ⊥, vs. λ||. FA vs. Dav has been used as a basis for tissue segmentation in various DTI applications (Pierpaoli et al., 1996; Gupta et al., 2005; Hasan et al., 2007). We found that plots of FA vs. Dav and λ⊥, vs. λ|| demonstrate a clear centroid shift of MPTP-treated mice compared to PBS-treated controls (Fig. 6).
Fig. 6.
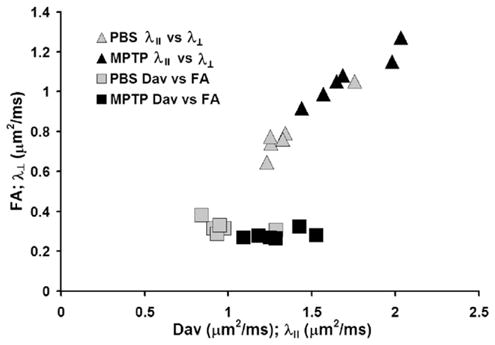
DTI vectorial representation. Plots of λ|| vs. λ⊥ (triangles) or Dav vs. FA (squares) demonstrates a shift in the cluster of the voxels. The analysis compares PBS controls (gray symbols) and MPTP intoxicated animals (black symbols).
Discussion
This report represents the first work in an animal model of PD-associated neurodegeneration using a non-invasive quantitative DTI methodology combined with histochemical analysis showing that DTI can monitor loss of dopaminergic neurons in this model. The results support its use as an important non-invasive surrogate and marker for assessing the kinetics and effects of experimental therapies in this disease model (Boska et al., 2005). Indeed, DTI tests in the early stages of PD showed decreased FA in a region projecting from the SN to the putamen/caudate complex and demonstrated a loss of nigrostriatal projections due to the disease processes (Yoshikawa et al., 2004). The average diffusion from three directional encoding (not equivalent to the rotationally invariant DTI metric Dav) in the putamen demonstrated significantly increased diffusivity in PD patients and patients with multiple systems atrophy as compared to controls (Schocke et al., 2004).
Quantifying tissue changes using DTI shows that measures of FA, Dav, λ⊥, and λ|| may be combined to develop measures of neurodegeneration through the use of segmentation and classification methods in MPTP mice. For example, FA and Dav, were previously developed as a basis for normal tissue segmentation (Pierpaoli et al., 1996). Extension of multidimensional use of both FA and Dav to classify brain abscesses and tumors (Gupta et al., 2005) and brain development (Hasan et al., 2007) showed that multidimensional approaches can be applied to tissue DTI classification. The centroid of FA vs. Dav and of λ⊥, vs. λ|| from the SN were observed to shift following MPTP intoxication. This would suggest that tissue classification may be useful as a means to distinguish affected brain subregions affected by disease using DTI.
Most DTI studies of animal models have focused on white matter tracts and found that demyelination produces increased λ⊥ while axonal damage caused increases in both λ⊥, and λ|| (Song et al., 2002; Song et al., 2004; Song et al., 2005). Decreased FA reported here is consistent with one previous DTI study of PD which found decreased FA in a region adjacent to the SN (Yoshikawa et al., 2004). In that report, no Dav results were presented for the SN. While the precise meaning of decreased FA is not yet clear, studies have shown that either neuronal loss, gliosis, or demyelination of white matter tracts may be associated with this change (Kinoshita et al., 1999; Beaulieu, 2002; Le Bihan, 2003; Hasan and Narayana, 2006). Comparisons of FA of the fornix, associated with the hypothalamic neurocircuitry, in PD patients with and without excessive dynamic sleepiness and controls demonstrate fornix degeneration marked by decreased FA. Decreased FA was also found to correlate with scores on the Epworth Sleepiness Scale (ESS) (Matsui et al., 2006).
Correlation between neurodegeneration in the SN and Dav, especially the transverse component, is a new finding which may have implications for the utility of DTI in studying gray matter diseases. Combining these data with high resolution 1H MRSI in the study of gray matter damage (Boska et al., 2003) may provide improved sensitivity and specificity for monitoring neurodegeneration.
DTI tests can now be used to monitor dopaminergic neurodegeneration in a mouse model of PD. Such tests can assess disease progression and may be of use in monitoring therapeutic interventions. Our results were confirmed by histological analyses and provided substantiation of the bioimaging tests. Although use of these techniques need be applied in PD to provide a more complete determination of sensitivity and specificity responses, our works are a first step approach in providing yet another novel measure for dopaminergic neuronal injury for a disease process where precise diagnostic measures are essential for therapies that can achieve neuronal protection or be regenerative.
Acknowledgments
This work was supported by NIH grants 2R37 NS36136, P01 NS43985, P01 MH64570, R21 NS049264, R01 NS052505 and T32 NS007488.
References
- Basser PJ, Mattiello J, LeBihan D. Estimation of the effective self-diffusion tensor from the NMR spin echo. J Magn Reson, B. 1994;103:247–254. doi: 10.1006/jmrb.1994.1037. [DOI] [PubMed] [Google Scholar]
- Beaulieu C. The basis of anisotropic water diffusion in the nervous system—A technical review. NMR Biomed. 2002;15:435–455. doi: 10.1002/nbm.782. [DOI] [PubMed] [Google Scholar]
- Benamer HT, Patterson J, Wyper DJ, Hadley DM, Macphee GJ, Grosset DG. Correlation of Parkinson’s disease severity and duration with 123I-FP-CIT SPECT striatal uptake. Mov Disord. 2000;15:692–698. doi: 10.1002/1531-8257(200007)15:4<692::aid-mds1014>3.0.co;2-v. [DOI] [PubMed] [Google Scholar]
- Bernheimer H, Birkmayer W, Hornykiewicz O, Jellinger K, Seitelberger F. Brain dopamine and the syndromes of Parkinson and Huntington. Clinical, morphological and neurochemical correlations. J Neurol Sci. 1973;20:415–455. doi: 10.1016/0022-510x(73)90175-5. [DOI] [PubMed] [Google Scholar]
- Boska MD, Nelson JA, Mosley RL, Zelivyanskaya ML, Lewis T, Mellon ML, Gendelman HE. Quantitative mouse brain 1H spectroscopic imaging of an MPTP mouse model of Parkinson’s disease using binomial excitation with volume selective refocusing (BEVR). 11th Scientific Meeting and Exhibition of the International Society for Magnetic Resonance in Medicine. ISMed. Risk Manag; Toronto, ON. 2003. p. 4. [Google Scholar]
- Boska MD, Lewis TB, Destache CJ, Benner EJ, Nelson JA, Uberti M, Mosley RL, Gendelman HE. Quantitative 1H magnetic resonance spectroscopic imaging determines therapeutic immunization efficacy in an animal model of Parkinson’s disease. J Neurosci. 2005;25:1691–1700. doi: 10.1523/JNEUROSCI.4364-04.2005. [DOI] [PMC free article] [PubMed] [Google Scholar]
- Ceballos-Baumann AO. Functional imaging in Parkinson’s disease: activation studies with PET, fMRI and SPECT. J Neurol. 2003;250(Suppl 1):I15–I23. doi: 10.1007/s00415-003-1103-1. [DOI] [PubMed] [Google Scholar]
- Cruz CJ, Aminoff MJ, Meyerhoff DJ, Graham SH, Weiner MW. Proton MR spectroscopic imaging of the striatum in Parkinson’s disease. Magn Reson Imaging. 1997;15:619–624. doi: 10.1016/s0730-725x(97)00079-9. [DOI] [PubMed] [Google Scholar]
- Eidelberg D, Moeller JR, Ishikawa T, Dhawan V, Spetsieris P, Chaly T, Belakhlef A, Mandel F, Przedborski S, Fahn S. Early differential diagnosis of Parkinson’s disease with 18F-fluorodeoxyglucose and positron emission tomography. Neurology. 1995;45:1995–2004. doi: 10.1212/wnl.45.11.1995. [DOI] [PubMed] [Google Scholar]
- Fahn S, Przedborski SP. Parkinsonism. In: Rowland LP, editor. Merritt’s Neurology. 10. Lippincott Williams and Wilkins; Philadelphia: 2000. pp. 679–693. [Google Scholar]
- Gao HM, Liu B, Zhang W, Hong JS. Novel anti-inflammatory therapy for Parkinson’s disease. Trends Pharmacol Sci. 2003;24:395–401. doi: 10.1016/S0165-6147(03)00176-7. [DOI] [PubMed] [Google Scholar]
- Gupta RK, Hasan KM, Mishra AM, Jha D, Husain M, Prasad KN, Narayana PA. High fractional anisotropy in brain abscesses versus other cystic intracranial lesions. Am J Neuroradiol. 2005;26:1107–1114. [PMC free article] [PubMed] [Google Scholar]
- Hasan KM, Narayana PA. Retrospective measurement of the diffusion tensor eigenvalues from diffusion anisotropy and mean diffusivity in DTI. Magn Reson Med. 2006;56:130–137. doi: 10.1002/mrm.20935. [DOI] [PubMed] [Google Scholar]
- Hasan KM, Basser PJ, Parker DL, Alexander AL. Analytical computation of the eigenvalues and eigenvectors in DT-MRI. J Magn Reson. 2001a;152:41–47. doi: 10.1006/jmre.2001.2400. [DOI] [PubMed] [Google Scholar]
- Hasan KM, Parker DL, Alexander AL. Comparison of gradient encoding schemes for diffusion-tensor MRI. J Magn Reson Imaging. 2001b;13:769–780. doi: 10.1002/jmri.1107. [DOI] [PubMed] [Google Scholar]
- Hasan KM, Halphen C, Sankar A, Eluvathingal TJ, Kramer L, Stuebing KK, Ewing-Cobbs L, Fletcher JM. Diffusion tensor imaging based tissue segmentation: validation and application to the developing child and adolescent brain. NeuroImage. 2007;34:1497–1505. doi: 10.1016/j.neuroimage.2006.10.029. [DOI] [PMC free article] [PubMed] [Google Scholar]
- Kinoshita Y, Ohnishi A, Kohshi K, Yokota A. Apparent diffusion coefficient on rat brain and nerves intoxicated with methylmercury. Environ Res. 1999;80:348–354. doi: 10.1006/enrs.1998.3935. [DOI] [PubMed] [Google Scholar]
- Le Bihan D. Looking into the functional architecture of the brain with diffusion MRI. Nat Rev, Neurosci. 2003;4:469–480. doi: 10.1038/nrn1119. [DOI] [PubMed] [Google Scholar]
- Lee EF, Jacobs RE, Dinov I, Leow A, Toga AW. Standard atlas space for C57BL/6J neonatal mouse brain. Anat Embryol (Berl) 2005;210:245–263. doi: 10.1007/s00429-005-0048-y. [DOI] [PubMed] [Google Scholar]
- Liberatore GT, Jackson-Lewis V, Vukosavic S, Mandir AS, Vila M, McAuliffe WG, Dawson VL, Dawson TM, Przedborski S. Inducible nitric oxide synthase stimulates dopaminergic neurodegeneration in the MPTP model of Parkinson disease. Nat Med. 1999;5:1403–1409. doi: 10.1038/70978. [DOI] [PubMed] [Google Scholar]
- Matsui H, Nishinaka K, Oda M, Niikawa H, Komatsu K, Kubori T, Udaka F. Disruptions of the fornix fiber in Parkinsonian patients with excessive daytime sleepiness. Parkinsonism Relat Disord. 2006;12:319–322. doi: 10.1016/j.parkreldis.2006.01.007. [DOI] [PubMed] [Google Scholar]
- McGraw P, Liang L, Escolar M, Mukundan S, Kurtzberg J, Provenzale JM. Krabbe disease treated with hematopoietic stem cell transplantation: serial assessment of anisotropy measurements—Initial experience. Radiology. 2005;236:221–230. doi: 10.1148/radiol.2353040716. [DOI] [PubMed] [Google Scholar]
- Mills R. Self-diffusion in normal and heavy water in the range 1–45 °C. J Phys Chem. 1973;77:685–688. [Google Scholar]
- Morrish PK, Sawle GV, Brooks DJ. An [18F]dopa-PET and clinical study of the rate of progression in Parkinson’s disease. Brain. 1996;119(Pt 2):585–591. doi: 10.1093/brain/119.2.585. [DOI] [PubMed] [Google Scholar]
- Neeman M, Freyer JP, Sillerud LO. A simple method for obtaining cross-term-free images for diffusion anisotropy studies in NMR microimaging. Magn Reson Med. 1991;21:138–143. doi: 10.1002/mrm.1910210117. [DOI] [PubMed] [Google Scholar]
- Pierpaoli C, Jezzard P, Basser PJ, Barnett A, Di Chiro G. Diffusion tensor MR imaging of the human brain. Radiology. 1996;201:637–648. doi: 10.1148/radiology.201.3.8939209. [DOI] [PubMed] [Google Scholar]
- Schocke MF, Seppi K, Esterhammer R, Kremser C, Mair KJ, Czermak BV, Jaschke W, Poewe W, Wenning GK. Trace of diffusion tensor differentiates the Parkinson variant of multiple system atrophy and Parkinson’s disease. NeuroImage. 2004;21:1443–1451. doi: 10.1016/j.neuroimage.2003.12.005. [DOI] [PubMed] [Google Scholar]
- Simpkins N, Jankovic J. Neuroprotection in Parkinson disease. Arch Intern Med. 2003;163:1650–1654. doi: 10.1001/archinte.163.14.1650. [DOI] [PubMed] [Google Scholar]
- Song SK, Sun SW, Ramsbottom MJ, Chang C, Russell J, Cross AH. Dysmyelination revealed through MRI as increased radial (but unchanged axial) diffusion of water. NeuroImage. 2002;17:1429–1436. doi: 10.1006/nimg.2002.1267. [DOI] [PubMed] [Google Scholar]
- Song SK, Kim JH, Lin SJ, Brendza RP, Holtzman DM. Diffusion tensor imaging detects age-dependent white matter changes in a transgenic mouse model with amyloid deposition. Neurobiol Dis. 2004;15:640–647. doi: 10.1016/j.nbd.2003.12.003. [DOI] [PubMed] [Google Scholar]
- Song SK, Yoshino J, Le TQ, Lin SJ, Sun SW, Cross AH, Armstrong RC. Demyelination increases radial diffusivity in corpus callosum of mouse brain. NeuroImage. 2005;26:132–140. doi: 10.1016/j.neuroimage.2005.01.028. [DOI] [PubMed] [Google Scholar]
- Vila M, Przedborski S. Targeting programmed cell death in neurodegenerative diseases. Nat Rev, Neurosci. 2003;4:365–375. doi: 10.1038/nrn1100. [DOI] [PubMed] [Google Scholar]
- Yoshikawa K, Nakata Y, Yamada K, Nakagawa M. Early pathological changes in the parkinsonian brain demonstrated by diffusion tensor MRI. J Neurol, Neurosurg Psychiatry. 2004;75:481–484. doi: 10.1136/jnnp.2003.021873. [DOI] [PMC free article] [PubMed] [Google Scholar]