

Abstract
Recent nanoindentation studies have demonstrated that the hardness and Young's modulus of human molar enamel decreases by more than 50% on moving from the occlusal surface to the dentin-enamel junction on cross-sectional samples. Possible sources of these variations are changes in local chemistry, microstructure, and prism orientation. This study investigates the latter source by performing nanoindentation tests at two different orientations relative to the hydroxyapatite prisms: parallel and perpendicular. A single sample volume was tested in order to maintain a constant chemistry and microstructure. The resulting data show very small differences between the two orientations for both hardness and Young's modulus. The 1.5 to 3.0% difference is significantly less than the standard deviations found within the data set. Thus, the variations in hardness and Young's modulus on cross-sectional samples of human molar are attributed to changes in local chemistry (varying levels of mineralization, organic matter, and water content) and changes in microstructure (varying volume fractions of inorganic crystals and organic matrix). The impact of prism orientation on mechanical properties measured by nanoindentation appears to be minimal.
Keywords: Nanoindentation, Enamel, Prism Orientation, Young's Modulus, Hardness
Introduction
Enamel is the hardest substance in the human body, harder even than bone and cartilage, and exhibits high values of Young's modulus as well. With such superior mechanical properties, it is ideally suited for the physiological functions of biting, chewing, and protecting the soft inner pulp where nerves reside. At least part of enamel's superior mechanical properties can be attributed to its composite microstructure. It consists of mineral-rich prisms embedded in a matrix consisting of water, organic material, and non-prismatic material. The individual prisms are bundles of similarly oriented calcium hydroxyapatite (HA) crystals (Ca10(PO4)6(OH)2) that are both carbonated and defective. The prisms measure 3-6 μm in cross-sectional diameter while the crystallites are approximately 200 nm in diameter and reach 100 μm in length. The prisms vary in orientation throughout the enamel. Near the occlusal surface, they are generally perpendicular to the surface and arranged in an orderly fashion. Near the dentinoenamel junction (DEJ), however, the prisms are randomly oriented with no fixed alignment relative to the occlusal surface. 1,2,3
Over the last decade a number of investigators have modeled enamel as a homogenous material.4,5 However, some studies have explored variations in the mechanical properties of enamel with test location. For example, Knoop microhardness tests6,7 and compression tests8 have suggested that the Young's modulus and hardness may be slightly higher for cusp (or surface) enamel than for side (or subsurface) enamel, while investigations with a depth-sensing Vickers indenter9 have shown that the Young's modulus (E) and hardness (H) values obtained from an occlusal section of enamel are generally higher than those obtained from an axial section. More recent nanoindentation tests10 have shown that the E and H of enamel will decrease from values greater than 6 GPa and 115 GPa at the occlusal surface to values less than 3 GPa and 70 GPa at the DEJ, respectively.
One hypothesis that attempts to explain the variations in Young's modulus and hardness proposes that they are due to variations in the local chemistry of the enamel. The chemistry varies in mineral, organic, and water content as one moves from the occlusal surface of the enamel to the DEJ. Many researchers have characterized the chemistry of human enamel as a function of position, 11,12,13,14,15,16 and in some cases the results have been correlated with spatial variations in the mechanical properties of enamel.10,15,17,18,19 Habelitz et al.20 showed Young's moduli and hardness were lower in the inter-rod enamel than in the head of the enamel rod. These differences in mechanical properties were attributed to higher organic tissue in the inter-rod areas. Cuy et al.10 showed a strong correlation between decreases in Young's modulus and hardness values and drops in mineral content, CaO and P2O5, specifically.
Another hypothesis proposes that mechanical property variations are due to anisotropy of the enamel due to differences in the orientation of the prisms depending on test location.17 For example, Staines et al.17 found that enamel hardness was higher when the indentation direction was perpendicular to the c-axis of the hexagonal hydroxyapatite crystals (parallel to the basal planes), and lower when the indentation direction was coaxial. Finite element modeling of the Young's modulus of enamel has been conducted using the volumetric crystalline fraction of hydroxyapatite to calculate the possible ranges of values for stiffness, both parallel and perpendicular to crystal orientation.19 These indicate that parallel to the crystal direction E increases from 93 GPa to 113 GPa as the crystalline fraction increases from 0.81 to 0.99. Perpendicular to the crystal direction E shows a much larger variation from 19 to 91 GPa over the same range of crystalline fraction. Cuy et al.10 found similar variations for both Young's modulus and hardness on a cross-sectional surface. When testing near the occlusal surface where prisms are well oriented and perpendicular to the direction of testing, E and H are higher than when testing near the DEJ where the prism orientation becomes less regular and more random.20 In addition, recent studies have revealed that the tensile strength of enamel is dependent on enamel prism orientation.21,22 These differences in testing direction versus prism orientation coupled with the lower crystal fraction (ratio of mineral to organic) closer to the DEJ could account for variations in Young's modulus and hardness.
To investigate which factor - local chemistry or prism orientation – has the largest impact on the Young's modulus and hardness of enamel measured by indentation, one factor must be held constant while the other is varied. However, given that both chemistry and prism orientation vary throughout human enamel, such an investigation has not yet been completed. In this experiment, E and H data are measured and compared for distinct prism orientations, both perpendicular to the long axes of the prisms (cross-sectional cut surface) and parallel to the long axes of the prisms (occlusal surface). By testing these two mutually perpendicular surfaces near their common edge, all indentation experiments were confined to a small volume of enamel (∼0.1 mm3). Thus, the chemical variations are minimal within the volume and theoretically the chemistry is identical when the data are extrapolated to the edge common to both test surfaces.
Methods and Materials
Sample Preparation
To perform a series of nanoindentations, a sound unerupted (full tissue impacted) human maxillary third molar was mounted in blocks of Buehler two-part Epo-Kwick epoxy, and then cross-sectioned using a diamond-bladed saw. The tooth was sliced so that it was divided approximately in half, perpendicular to the dividing line between the buccal and lingual sides (Figure 1a). To be consistent with previous testing,10 the mesial half of the prepared sample was selected for nanoindentation testing. After cross sectioning, the tooth was polished on the cross-sectional cut surface (that lies perpendicular to the occlusal surface) and also on the occlusal surface. The polishing was accomplished using a motorized polishing wheel and pads of declining grit size (320, 400, 600, 600, 800, and 1200 grit). The sample was then polished using 1 μm and then 0.25 μm diamond suspensions to finalize preparation. In between grit and suspension sizes, the sample was rinsed and blown dry. The final surface was smooth and free of scratches under 100x magnification in an optical microscope.
Figure 1. Sample Indent Test Location.

a: Maxillary third molar sectioned perpendicularly between buccal and lingual sides dividing tooth into mesial and distal halves.
b: Indent arrays on the cross-sectional cut and occlusal surfaces of the mesial buccal cusp.
Mechanical Characterization using the Nanoindenter XP™
Nanoindentation experiments were performed using a Nanoindenter XP™(MTS Systems Corp., NanoInstruments Innovation Center, Oak Ridge, TN). Indentation tests were conducted along the cross-sectional cut surface in arrays that ran towards the occlusal surface away from the DEJ (Fig. 1). Tests were also performed on the occlusal surface in arrays that ran perpendicularly towards the cross-sectional cut surface. Note that test sites were chosen so that indentation arrays on the cross-sectional cut surface lined up with the arrays on the occlusal surface (Fig. 1b). 200 nm deep indentations were made using a Berkovich (3 sided pyramidal) diamond tip. Indentations were spaced approximately 10 μm apart in a given row and the rows were spaced at 50 μm. The indentations started approximately 600 μm from the common edge and stopped approximately 200 μm from this edge. This avoided any testing on rounded surfaces near the common edge.
Since Staines et al. 17 reported that Young's modulus increased by ∼15% when a wet sample was allowed to dry in air for over 72 hours, care was taken to perform all indentation tests in the same environment in which the sample was stored. After sample preparation, the sample was allowed to dry at room temperature (22.3 °C) for 4 days. The sample was then stored dry and tested under these same ambient conditions, and, hence, the impact of drying is taken to be negligible.
For each indent, both Young's modulus and hardness were calculated using the force-displacement data and the standard methods of Oliver and Pharr.23 The depth of each indentation was determined by fitting a polynomial expression to the upper 70% of the unloading curve. The contact area was then determined using the depth to area calibration for the tip. Young's modulus was calculated using the contact stiffness, the contact area at maximum load, and a value of 0.25 for Poisson's ratio for enamel and values of 0.07 and 1141 GPa for Poisson's ratio and Young's modulus for the diamond tip. Hardness was calculated using the maximum load and the contact area at maximum load.
Results
The results of the nanoindentation testing of the third molar sample are shown in Figure 2. The measurements of Young's modulus (Fig. 2a) and hardness (Fig. 2b) are plotted as a function of distance from the edge between the cross-sectional cut surface and the occlusal surface (240-600 μm). The individual data points are each an average of 3 to 9 individual indentation measurements, each made at a similar distance from the edge and in relatively close proximity to each other. Standard deviations for each data point are shown as error bars (1 deviation above and below the point). The standard deviations for Young's modulus ranged from 1.82 to 13.83 GPa (2-11%), with an average deviation of 6.01 GPa (5%), for the cross-sectional cut surface, and from 1.25 to 13.68 GPa (1-12%), with an average deviation of 5.21 GPa (4%) for the occlusal surface. The standard deviations for hardness ranged from 0.17 to 0.90 GPa (3-14%), with an average deviation of 0.35 GPa (5%), for the cross-sectional cut surface, and from 0.07 to 0.76 GPa (1-12%), with an average of 0.33 GPa (5%), for the occlusal surface. Thus, both surfaces show a similar scatter in the data. Trend-lines in Figure 2 were calculated using linear regression.
Figure 2.
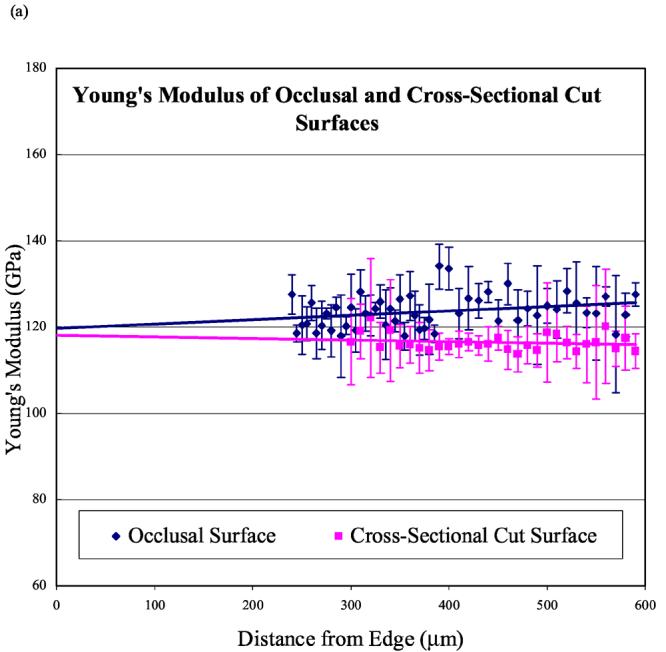
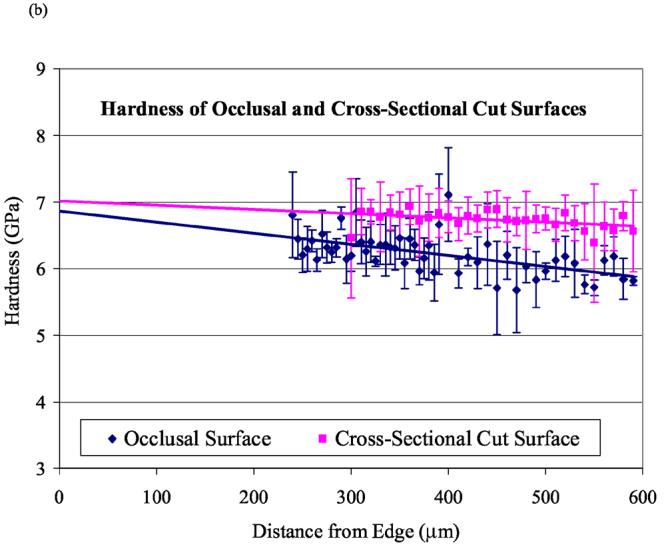
(a) Young's modulus and (b) hardness of the occlusal and cross-sectional cut surfaces of enamel approaching a common edge. Data points are averages of 3-9 points; lines are linear regression fits to data.
Fig. 2a shows that the Young's modulus of the cross-sectional cut surface increases slightly (<2%) with distance when approaching the common edge. In contrast, the Young's modulus of the occlusal surface decreases from ∼125 GPa to 120 GPa (∼4%) as distance decreases from 600 μm to 0 μm. Comparing the two orientations, at a distance of 600 μm from the common edge, the Young's modulus is ∼10 GPa (∼8.5%) lower on the cross-sectional cut surface than on the occlusal surface. However at the common edge (x=0), the extrapolated value of Young's modulus is only 2 GPa (1.5%) lower on the cross-sectional cut surface than on the occlusal surface. Figure 2b shows a similar pattern for hardness. Hardness increases ∼0.4 GPa (∼6%) with distance when approaching the common edge for the cross-sectional cut surface and increases ∼0.9 GPa (∼13%) for the occlusal surface. Comparing the perpendicular and parallel orientations, at 600 μm from the common edge, the hardness of the cross-sectional cut surface is ∼0.7 GPa (∼10%) higher than the occlusal surface. The extrapolated value of hardness at the common edge, though, is only 0.2 GPa (∼3%) higher on the cross-sectional cut surface than on the occlusal surface.
Discussion
Prior to comparing values for the two orientations, it is useful to compare measured magnitudes with earlier reports. Previous research has found varying values for the Young's modulus and hardness of enamel. In this study, values of 120-130 GPa and 6-7 GPa are measured for E and H, respectively, near the occlusal surface of the enamel. These E and H values are consistent with those previously reported by Cuy et al.10 where E and H had a maximum of 120 GPa and 6.4 GPa, respectively, at the cusp tip and a minimum of 47 GPa and 2.7 GPa near the DEJ. However, the absolute values of E and H seen here and the maximum values reported previously by Cuy et al.10 are higher than the values of E and H seen in prior investigations. This difference can be attributed to the location of measurements. Investigators have typically presented the mechanical properties of enamel with average values measured away from the occlusal surface (Table 1). Using nanoindentation methods Cuy et al.10 showed that the highest values of E and H (and the most rapid decrease in E and H) are found near the cusp tips. E and H are significantly lower in the majority of the enamel, hundreds of microns below the occlusal surface as noted by Cuy et al.10 Since most earlier reports focus primarily in this middle region, between the occlusal surface and the DEJ, lower values have been reported as seen in Table 1.
Table 1.
Mechanical Properties of Human Enamel
| Test Method | E (GPa) | H(GPa) | Investigator |
|---|---|---|---|
| Nanoindentation | 120-130 (at cusp tip) | 6-7 (at cusp tip) | This work |
| Nanoindentation | 120 - 47 (from cusp tip to DEJ) |
6.4 - 2.7 (from cusp tip to DEJ) |
Cuy et al.10 |
| Nanoindentation | 80.35 +/− 7.71 | 4.88 +/− 0.35 | Mahoney et al.27 |
| Nanoindentation | 90.59 +/− 16.13 | 3.39 +/− 0.18 | Willems et al.5 |
| Nanoindentation – occlusal | 87.2 +/− 2.2 | 3.9 +/− 0.3 | Habelitz et al.20 |
| Nanoindentaiton - axial | 72.7 +/− 4.5 | 3.8 +/− 0.4 | |
| Vickers – occlusal section | - | 3.23 +/− 0.30 | Xu et al.9 |
| Vickers – axial section | - | 3.03 +/− 0.09 | |
| Modified Vickers – occlusal section |
94 +/− 5 | 3.62 +/− 0.20 | |
| Modified Vickers –axial section | 80 +/− 4 | 3.37 +/− 0.15 | |
| Compression - cusp section | 84.1 +/− 6.2 | - | Craig et al.8 |
| Compression – axial section | 77.9 +/− 4.8 | - | |
| Spherical Indentation | 83 | - | Staines et al. 17 |
The geometrically small sample used here allowed for the measurement of Young's modulus and hardness of a chemically similar group of prisms in separate orientations – parallel and perpendicular to the long axes of the prisms. The trend-lines in Fig. 2 allow easy comparison between the data sets, and enable one to extrapolate the data to a common point for both orientations, the shared edge at x=0. Extrapolation of the results to a distance of zero μm from the common edge of the cross-sectional cut surface and the occlusal surface yields approximate values for Young's modulus and hardness for prisms in both the perpendicular and parallel directions (relative to the long axis of the prism). The convergence of the trend-lines shows that the values of Young's modulus and hardness are quite similar for the two orientations at essentially the same location and chemistry. From Figs. 2a and 2b, we can see that at zero distance – at the common edge – the Young's modulus varies ∼1.5% between the two orientations and the hardness varies by ∼3%. These differences are quite small and are less than the average standard deviations (approximately 4% to 5%). As the data points move away from the common edge, the data sets diverge for both the Young's modulus and the hardness values. This is not surprising, and is likely due to a combination of factors such as small changes in local chemistry, increasing amounts of interprismatic material, varying crystalline amounts among the prisms, or potential structural defects in the enamel like tufts, spindles, and cracks.
While these indentation experiments show no significant difference in the mechanical properties measured perpendicular or parallel to the prisms in enamel, the results do not preclude a difference in these properties when tested by other methods. Indentation testing generates radial, and not uniaxial, deformation, and therefore tends to average over multiple orientations (Tabor, 1951). Vlassak and Nix (1994) have shown theoretically and experimentally that indentations even on highly anisotropic materials give only relatively small variations in indentation (Young's) modulus and hardness. Compression tests, which are uniaxial in nature, may yield differences with orientation as seen by Craig et al. (1961). Noting this difference, however, the data presented here strongly suggest that variations in the prism orientation of the enamel are not likely to contribute to the variations of Young's modulus and hardness that were measured by indentation in previous work (Cuy et al. 2002).
Conclusion
Nanoindentation experiments were used to determine if prism orientation contributes to the variation in hardness and Young's modulus observed in previous indentation research. The experiment was designed to compare E and H data for distinct prism orientations, both perpendicular to the long axes of the prisms (cross-sectional cut surface) and parallel to the axes of prisms (occlusal surface) by testing two mutually perpendicular surfaces near a common edge. The resulting data, when extrapolated back to the common edge, showed there is effectively no difference between the hardness and Young's modulus values for different prism orientations. It is likely, therefore, that the variations mapped by previous researchers using indentation studies are predominantly due to variations in chemistry across the enamel and not due to variations in prism orientation.
Acknowledgements
L.A. Darnell was supported by NIH Grant F30 DE014130.
Footnotes
Publisher's Disclaimer: This is a PDF file of an unedited manuscript that has been accepted for publication. As a service to our customers we are providing this early version of the manuscript. The manuscript will undergo copyediting, typesetting, and review of the resulting proof before it is published in its final citable form. Please note that during the production process errors may be discovered which could affect the content, and all legal disclaimers that apply to the journal pertain.
References
- 1.Fox PG. The toughness of tooth enamel, a natural fibrous composite. J Mater Sci. 1980;15:3113–3121. [Google Scholar]
- 2.Williams PL, Warwick R, Dyson M, Bannister LH, editors. Splanchology: The teeth. Gray's Anatomy. Churchill Livingstone Inc.; New York: 1989. pp. 1308–1309. [Google Scholar]
- 3.Koenigswald WV, Clemens WA. Levels of complexity in the microstructure of mammalian enamel and their application in studies of systematics. Scanning Microscopy. 1992;6(1):195–218. [PubMed] [Google Scholar]
- 4.Remizov SM, Prujansky LY, Matveevsky RM. Wear resistance and microhardness of human teeth. Proc Inst Mech Eng [H] 1991;205(3):201–202. doi: 10.1243/PIME_PROC_1991_205_290_02. [DOI] [PubMed] [Google Scholar]
- 5.Willems G, Celis JP, Lambrechts P, Braem M, Vanherle G. Hardness and Young's modulus determined by nanoindentation technique of filler particles of dental restorative materials compared with human enamel. J Biomed Mater Res. 1993;27:747–755. doi: 10.1002/jbm.820270607. [DOI] [PubMed] [Google Scholar]
- 6.Craig RG, Peyton FA. The micro-hardness of enamel and dentin. J Dent Res. 1958;37(4):661–668. doi: 10.1177/00220345580370041301. [DOI] [PubMed] [Google Scholar]
- 7.Meredith N, Sherriff N, Setchell DJ, Swanson SA. Measurement of the microhardness and Young's modulus of human enamel and dentine using an indentation technique. Arch Oral Biol. 1996;41(6):539–545. doi: 10.1016/0003-9969(96)00020-9. [DOI] [PubMed] [Google Scholar]
- 8.Craig RG, Peyton FA, Johnson DW. Compressive properties of enamel, dental cements, and gold. J Dent Res. 1961;40(5):936–945. [Google Scholar]
- 9.Xu HHK, Smith DT, Jahanmir S, Romberg E, Kelly JR, Thompson VP, Rekow ED. Indentaiton damage and mechanical properties of human enamel and dentin. J Dent Res. 1998;77:472–480. doi: 10.1177/00220345980770030601. [DOI] [PubMed] [Google Scholar]
- 10.Cuy JL, Mann AB, Livi KJ, Teaford MF, Weihs TP. Nanoindentation mapping of the mechanical properties of human molar enamel. Arch Oral Biol. 2002;47(4):281–291. doi: 10.1016/s0003-9969(02)00006-7. [DOI] [PubMed] [Google Scholar]
- 11.Weatherell JA, Robinson C, Hallsworth AS. Variations in the chemical composition of human enamel. J Dent Res. 1974;53(2):180–192. doi: 10.1177/00220345740530020501. Review. [DOI] [PubMed] [Google Scholar]
- 12.Annegarn HJ, Jodaikin A, Cleaton-Jones PE, Sellschop JPF, Madiba CCP, Bibby D. PIXE analysis of caries related trace elements in tooth enamel. Nucl. Instr Methods. 1981;181:323–326. [Google Scholar]
- 13.Theuns HM, van Dijk JK, Jongebloed WL, Groeneveld A. The mineral content of human enamel studied by polarizing microscopy, microradiography and scanning electron microscopy. Arch Oral Biol. 1983;28(9):797–803. doi: 10.1016/0003-9969(83)90035-3. [DOI] [PubMed] [Google Scholar]
- 14.Svalbe ID, Chaudhri MA, Traxel K, Ender C, Mandel A. Surface profiling of trace elements across pre-carious lesions in teeth. Nucl Instr Method Phys Res. 1984;(PtB3):651–653. [Google Scholar]
- 15.Svalbe ID, Chaudhri MA, Traxel K, Ender C, Mandel A. Microprobe profiling of fluorine and other trace elements to large depths in teeth. Nucl Instr Method Phys Res. 1984;(PtB3):648–650. [Google Scholar]
- 16.Wilson PR, Beynon AD. Mineralization differences between human deciduous and permanent enamel measured by quantitative microradiography. Arch Oral Biol. 1989;34(2):85–88. doi: 10.1016/0003-9969(89)90130-1. [DOI] [PubMed] [Google Scholar]
- 17.Staines M, Robinson WH, Hood JAA. Spherical indentation of tooth enamel. J Mater Sci. 1981;16:2551–2556. [Google Scholar]
- 18.Kodaka T, Debari K, Yamada M, Kuroiwa M. Correlation between microhardness and mineral content in sound human enamel. Caries Res. 1992;26:139–141. doi: 10.1159/000261498. [DOI] [PubMed] [Google Scholar]
- 19.Spears IR. A three-dimensional finite element model of prismatic enamel: A re-appraisal of the data on the Young's modulus of enamel. J Dent Res. 1997;76(10):1690–1697. doi: 10.1177/00220345970760101101. [DOI] [PubMed] [Google Scholar]
- 20.Habelitz S, Marshall SJ, Marshall GW, Balooch M. Mechanical properties of human dental enamel on the nanometer scale. Arch. Oral Biol. 2001;46(2):173–183. doi: 10.1016/s0003-9969(00)00089-3. [DOI] [PubMed] [Google Scholar]
- 21.Carvalho RM, Santiago SL, Fernandes CAO, Suh BI, Pashley DH. Effects of prism orientation on tensile strength of enamel. J Adh Dent. 2000;2:251–257. [PubMed] [Google Scholar]
- 22.Giannini M, Soares CJ, de Carvalho M. Ultimate tensile strength of tooth structures. Dent Mat. 2004;20(4):322–329. doi: 10.1016/S0109-5641(03)00110-6. [DOI] [PubMed] [Google Scholar]
- 23.Oliver WC, Pharr GM. An improved technique for determining hardness and elastic modulus using load and displacement sensing indentation experiments. J Mater Res. 1992;7(6):1564–1583. [Google Scholar]
- 24.Iwai-Liao Y, Higashi Y, Guo L, Ogita Y, Nonaka T. Fine structure study and energy dispersive spectroscopy (EDS) X-ray microprobe (EDX) analysis of organic elements in the human enamel. J. Trace and Microprobe Tech. 1997;15(4):673–682. [Google Scholar]
- 25.Tabor D. The Hardness of Metals. Oxford University Press; Oxford: 1951. Hardness Measurements with conical and pyramidal indenters; pp. 95–113. [Google Scholar]
- 26.Vlassak JJ, Nix WD. Measuring the elastic properties of anisotropic materials by means of indentation experiments. J Mech Phys Solids. 1994;42(8):1223–1245. [Google Scholar]
- 27.Mahoney E, Holt A, Swain M, Kilpatrick N. The hardness and modulus of elasticity of primary molar teeth: an ultra-micro-indentation study. J Dent. 2000;28:589–594. doi: 10.1016/s0300-5712(00)00043-9. [DOI] [PubMed] [Google Scholar]