Abstract
To minimize inhomogeneous spectral line-broadening, high spatial resolution acquisition was previously proposed for 3D echo-planar spectroscopic imaging (EPSI) in combination with a high spatial resolution water reference EPSI data set, allowing local frequency shift (B0-shift) correction for human brain metabolite maps at 1.5 T (Ebel A et al., Magn. Reson. Imaging 21:113–120, 2003). At higher magnetic field strength, B0, increased field inhomogeneities typically lead to increased line-broadening. Additionally, increased susceptibility variations render shimming of the main magnetic field over the whole head more difficult. This study addresses the question whether local B0-shift correction still helps limit line-broadening in whole-brain 3D EPSI at higher magnetic fields. The combination of high spatial resolution acquisition and local B0-shift correction to limit line-broadening is evaluated at 4 T. Similar to results at 1.5 T, the approach provided a high yield of voxels with good spectral quality for 3D EPSI, resulting in improved brain coverage.
Keywords: 1H MR echo-planar spectroscopic imaging, brain, local B0-shift correction, high spatial resolution acquisition, 4 Tesla
INTRODUCTION
Spectral quality in 1H MR spectroscopic imaging (MRSI) of the brain is often considerably reduced in regions subject to local magnetic susceptibility variations, which induce broadening and distortions of spectral lineshapes. Previously, a modified acquisition strategy for volumetric echo-planar spectroscopic imaging (3D EPSI) was presented to recover spectral quality in these brain regions [1]. In this approach, the data is sampled at higher than the targeted spatial resolution, then corrected for local magnetic field (B0) variations and reconstructed such that the final spatial resolution matches that of 3D EPSI data acquired with the conventional lower spatial resolution to preserve signal-to-noise ratio (SNR). This approach was based on the argument by Li et al. [2] that B0-field variations primarily determine spectral linewidth, i.e. , and that a reduction in the voxel dimensions by higher spatial resolution will proportionately reduce the variation of B0 within the voxel and thus increase . Here, T2 and are the transverse and effective transverse relaxation time, respectively. Spectral lines will therefore be narrower and higher, which can partially compensate for signal loss due to the smaller voxel volume. Comparison of in vivo 3D EPSI data obtained at 1.5 T with the high spatial resolution acquisition (HR) and the conventional lower spatial resolution acquisition (LR) showed that the HR approach limited spectral line broadening in many problematic brain regions. However, the HR approach also resulted in a loss in SNR by a factor between 1.4 and 1.6 for the matrix sizes used [1]. Nevertheless, this loss was largely offset by improved spectral quality, leading to an overall improvement of the metabolite image quality in problematic brain regions. At higher magnetic field strengths (B0 > 3T), the problems with poor spectral quality are exacerbated, since regional B0 inhomogeneities scale with the magnetic field strength [3]. Although, the studies by Li et al. [2] were conducted at 4 T, their results were based on 3D MRSI localized well within the brain, sufficiently distant from sinuses and bones with strong susceptibility variations. It is therefore still uncertain whether significant reductions in spectral linewidth can be accomplished by the HR approach at 4 T in regions of strongly varying magnetic susceptibility. In the present study, the usefulness of the HR approach is demonstrated for whole brain MRSI at 4 and 1.5 T.
METHODS
The data acquisition and processing strategies employed at 1.5 T (Siemens Magnetom Vision, Siemens Medical Solutions, Erlangen, Germany) and 4 T (Bruker MedSpec, Bruker BioSpin, Ettlingen, Germany) have been described previously ([1] and [4], respectively). All studies involving human subjects were conducted in compliance with local IRB regulations. High spatial resolution EPSI data were taken from three volunteer studies at 1.5 T using echo times, TE, of 25 ms (n=1) and 135 ms (n=2). Two of these data sets had been acquired for a previous study [1] and were reprocessed for this analysis. At 4 T, data were taken at TE=30 ms, 45 ms, and 70 ms (n=1 each). Acquisitions at 1.5 T were carried out with a repetition time, TR, of 1685 ms, an inversion time, TI, of 210 ms, a field-of-view, FOV, of 373×280×180 mm3 (x, y, z), a matrix size of 64×48×18×512 (x, y, z, time), a spectral bandwidth, SW, of 1250 Hz, and a total acquisition time, TACQ, of 24.4 min. At 4 T, acquisition parameters were TR/TI=1780/280 ms, FOV=280×280×180 mm3, matrix size= 50×50×18×800, SW=1667 Hz, and TACQ=27 min. However, in contrast to our earlier work [1], no “standard” (lower) resolution data was acquired for this analysis. After reconstruction, including spatial smoothing by k-space apodization, the effective voxel size was approximately 2 mL for all data sets. The B0 field map was derived from the water reference EPSI data [1], which was acquired either sequentially (1.5 T, TACQ=6.7 min.) or interleaved (4 T) with the metabolite acquisition. Data were processed once with and once without the correction for local B0-shifts, and fitted using an automated spectral analysis procedure [5] to extract metabolite peak areas and linewidths. The spectral model included the singlet resonances of N-acetyl aspartate (NAA, 2.01 ppm), Choline (Cho, 3.19 ppm), and Creatine (Cr, 3.03 ppm). In addition, for data acquired at B0=1.5 T and TE=25 ms, the model included myo-Inositol (mIns, 3.52 ppm). Note that the spectral analysis procedure fits one common Lorentzian-Gaussian lineshape to all metabolite peaks resulting in one linewidth parameter. Quality maps, identifying voxels with acceptable spectral quality, i.e. with fitted metabolite linewidth between 3 Hz and 8 Hz (1.5 T), or 3 Hz and 21.3 Hz (4 T), were calculated [6], and the relative number of acceptable voxels compared for data reconstructed with and without B0-shift correction. To this end, acceptance rates (in percent) were determined for each data set as the ratio of the number of voxels with acceptable spectral quality over the number of all fitted brain voxels. The upper limit on the metabolite linewidth corresponds to approximately 0.12 ppm and is on the order of the peak separation between Cho and Cr. In order to estimate the effect of higher-resolution acquisition on SNR, as measured by NAA peak height over the spectral-spatial RMS noise level, one of the data sets acquired at 4 T (TE=70 ms) was resampled taking only the central 32 by 32 k-space points in kx and ky and all points along kz into account. Processing was done as for the HR data with the exception of the B0-shift correction. Furthermore, Gaussian k-space apodization was matched in such a way that the data were subject to the same attenuation as the central 32 by 32 k-space points in kx and ky of the HR data, yielding an effective voxel size of approximately 2.5 mL. After subtracting the baseline estimate obtained by the automated spectral analysis, the peak height was calculated for both data sets in each brain voxel, and the ratio with respect to the RMS noise level estimated from voxels outside the brain was determined. This was then corrected for differences in acquisition time, effective voxel size, and receiver bandwidth.
RESULTS
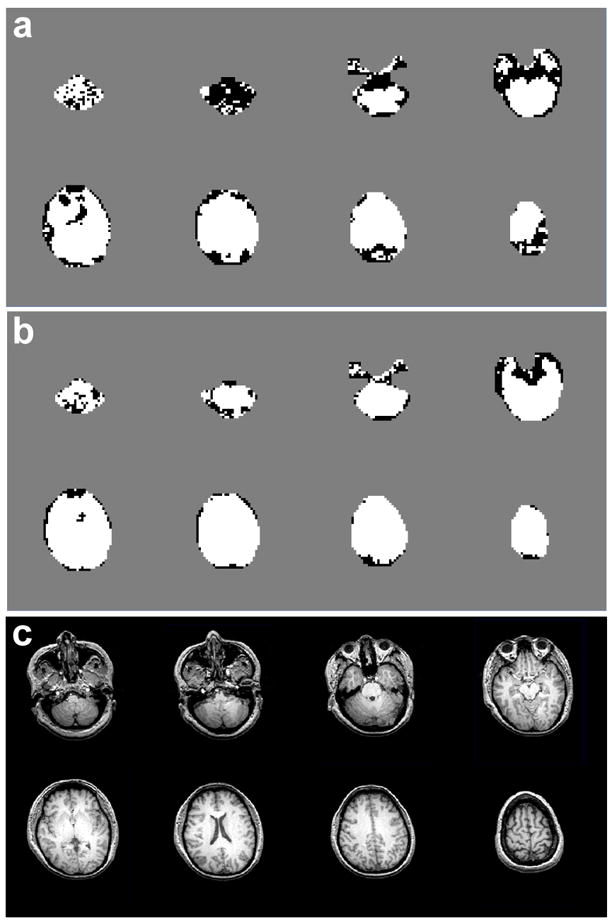
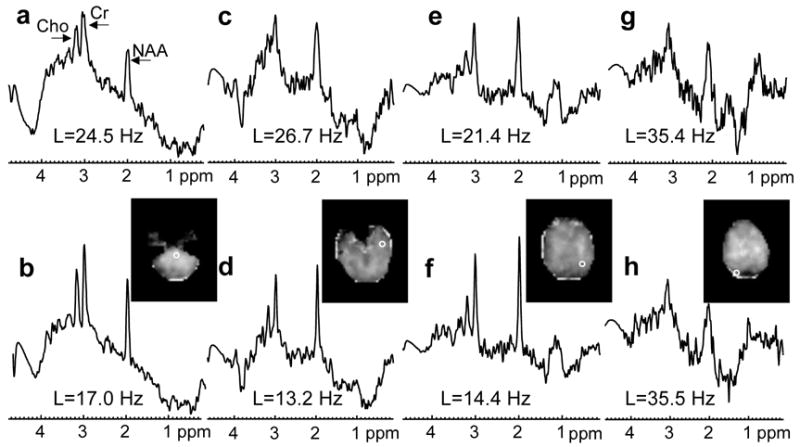
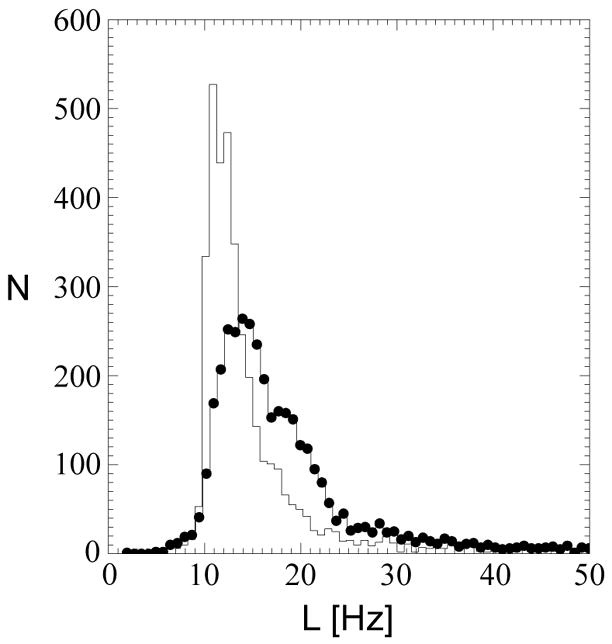
In Fig. 1, quality maps are shown for a volunteer scanned at 4 T (TE=45 ms) without (a) and with B0-shift correction (b). Aside from edge slices, increases in the number of voxels with acceptable spectral quality were observed in all slices. In Fig. 2 are shown spectra for one volunteer study at 4 T (TE=45 ms) without (a, c, e, g) and with B0-shift correction (b, d, f, h). The two spectra in each column are from the same respective voxel as indicated in the fitted NAA image (insert). Fitted metabolite linewidth, L, is given in each plot indicating that in three out of the four voxels presented the B0-shift correction led to a substantial reduction in linewidth and changed the rating from ‘unacceptable’ to ‘acceptable’. In Fig. 3 is shown a histogram of the fitted metabolite linewidth for one subject scanned at 4 T (TE=30 ms) without (symbol) and with B0-shift correction (line). In Table 1, acceptance rates without, Au, and with B0-shift correction, Ac, as well as their ratios are summarized for all volunteers studied at 1.5 T and 4 T. The 4 T data set resampled to 32 by 32 points in kx and ky (data not shown) was in very good agreement with the HR data processed without B0-shift correction in terms of peak height, linewidth, and RMS noise level. The noise outside the brain was compatible with a Gaussian distribution. Comparison between resampled and B0-shift-corrected HR data (not shown) revealed very good agreement in terms of RMS noise level and resulted in a mean NAA peak height ratio of 1.22±0.32 for HR to resampled data. Accounting for differences in acquisition time, effective voxel size, and receiver bandwidth, and assuming two averages for lower-resolution data, the estimated SNR ratio for high-resolution to resampled data was 1.06±0.28. The two averages were assumed since signal averaging would have been done in a corresponding lower-resolution 3D EPSI acquisition. In the calculation of the error estimate, uncertainties in the effective voxel volumes were neglected.
Figure 1.

Maps of accepted voxels (white) and rejected voxels (black) in one volunteer studied at 4 T (TE=45 ms) without (a) and with local B0-shift correction (b). Also shown are the corresponding structural MR images (c).
Figure 2.

Spectra from four voxels obtained from one volunteer studied at 4 T (same subject as in Fig. 1; TE=45 ms) processed without (a, c, e, g) and with B0-shift correction (b, d, f, h). Voxel locations are indicated in the image inserts showing fitted NAA area. The metabolite linewidth obtained by automated spectral analysis is denoted by L.
Figure 3.

Histogram of fitted metabolite linewidth for one volunteer studied at 4 T (TE=30 ms). Data processed with and without B0-shift correction are represented by symbols and lines, respectively.
Table 1.
Relative number of voxels with acceptable spectral quality at 1.5 T (3 Hz ≤ L ≤ 8 Hz)a and 4 T (3 Hz ≤ L ≤ 21.3 Hz)
| Subject (field strength) | TE [ms] | Au [%]b | Ac [%]c | Ac/Au |
|---|---|---|---|---|
| 1 (1.5 T) | 135 | 69.0 | 84.0 | 1.22 |
| 2 (1.5 T) | 25 | 60.1 | 79.1 | 1.32 |
| 3 (1.5 T) | 135 | 72.8 | 85.6 | 1.18 |
| 4 (4 T) | 70 | 69.7 | 82.6 | 1.19 |
| 5 (4 T) | 45 | 68.2 | 83.1 | 1.21 |
| 6 (4 T) | 30 | 74.0 | 85.5 | 1.16 |
The metabolite linewidth obtained by automated spectral analysis is denoted by L
Acceptance rate without B0-shift correction
Acceptance rate with B0-shift correction
DISCUSSION
At both 1.5 and 4 T, substantial increases in the relative number of voxels with acceptable spectral quality were observed for 3D EPSI of normal human brain. In particular, spectral quality of voxels in lower regions of the brain as well as in frontal regions, which are typically subject to considerable field inhomogeneities, benefited from the B0-shift correction. While acceptance rates depend to some extent on the definition of the brain mask used for fitting, the ratio of acceptance rates with versus without B0-shift correction reflects the success of the correction in reducing metabolite linewidth, independent of the definition of the brain mask. Note that since in this study high-resolution EPSI data without B0-shift correction were used as opposed to “standard resolution” EPSI data acquired in our previous study [1], results for 1.5 T may differ between these two studies. As shown in Fig. 3, the B0-shift correction leads to a narrowing of the linewidth histogram and a shift towards smaller linewidth, resulting in an increase in the number of voxels with linewidth inside the range defining acceptable spectral quality. Since the conversion of a voxel from ‘unacceptable’ to ‘acceptable’ depends not only on the reduction in fitted linewidth but also on the linewidth without B0-shift correction, a voxel-based evaluation of linewidth reduction with respect to enhancement of spectral quality is difficult. As shown in Table 1, whole-brain results are comparable for all subjects at both field strengths and at all echo times studied. Differences may be attributed to variability in shim quality. In particular, at higher field strength, shimming of the main magnetic field over the entire head becomes increasingly difficult.
A limitation of this study is that the assessment of spectral quality is based on a spectral fitting procedure without accounting for fitting accuracy. As pointed out previously [6], Cramer-Rao bounds and confidence intervals [7] have limits to evaluate fitting accuracy. While these measures are able to assess the fitting performance, they are not useful to reliably determine if spectra suffer from severely distorted lineshapes or strong lipid contamination, and they provide no additional information to the criteria used in this study. This limitation occurs because prior knowledge of signal contributions to the baseline is limited, with the result that any slowly varying signal, including severely broadened metabolite lineshapes, are well modeled by our analysis procedure, resulting in small residuals of the fit. Although a few voxels convert from ‘acceptable’ to ‘unacceptable’ upon application of the B0-shift correction, as seen in Fig. 1, visual inspection of the fit results indicates that these occurrences are most likely due to a failure of the fit algorithm in voxels near the edge of the brain. Since this happens only in a very small number of voxels, it has negligible impact on acceptance rates.
The results of this study are in good agreement with the report by Li et al. [2], which stated that field homogeneity within voxels (expressed by ) tends to increase as voxel size decreases with higher spatial resolution, leading to narrower metabolite peaks. While the study by Li et al. at 4 T was restricted to 3D MRSI localized well within the brain, the present study demonstrates that the argument still holds for whole brain MRSI at 4 T even for regions in the vicinity of sinuses and bones, where major B0-variations are expected. The findings further imply that it is advantageous to acquire spectroscopic imaging data at high resolution, irrespective of SNR, and recover signal intensity retrospectively by spatial smoothing after establishing spectral coherence by local B0-shift correction. Analysis of the data set resampled to 32 by 32 points in kx and ky shows that sufficient SNR can be recovered with the high-resolution approach. Note that due to the relatively small number of samples acquired along kz, resampling along this direction would have been error-prone and was therefore avoided. The better performance of the high-resolution acquisition over the resampled lower-resolution version as compared to previous results reported for 1.5 T [1] can be attributed to the fact that the 4 T data was not resampled along kz. Since lower-resolution data, acquired over a smaller range of kz values, sample the region near kz=0 more densely than the high-resolution variant, an increased SNR for the lower-resolution approach is expected.
Acknowledgments
This work was supported by the US Department of Veterans Affairs, by the US Department of Defense grant DAMD-17-01-1-0764, and by PHS grants R01NS41946 and R01NS38029. Support from Dr. Michael W. Weiner is gratefully acknowledged.
Footnotes
Publisher's Disclaimer: This is a PDF file of an unedited manuscript that has been accepted for publication. As a service to our customers we are providing this early version of the manuscript. The manuscript will undergo copyediting, typesetting, and review of the resulting proof before it is published in its final citable form. Please note that during the production process errors may be discovered which could affect the content, and all legal disclaimers that apply to the journal pertain.
References
- 1.Ebel A, Maudsley AA. Improved spectral quality for 3D MR spectroscopic imaging using a high spatial resolution acquisition strategy. Magn Reson Imaging. 2003;21(2):113–120. doi: 10.1016/s0730-725x(02)00645-8. [DOI] [PubMed] [Google Scholar]
- 2.Li BS, Regal J, Gonen O. SNR versus resolution in 3D 1H MRS of the human brain at high magnetic fields. Magn Reson Med. 2001;46(6):1049–1053. doi: 10.1002/mrm.1297. [DOI] [PubMed] [Google Scholar]
- 3.Turner R, Jezzard P, Wen H, Kwong KK, Le Bihan D, Zeffiro T, Balaban RS. Functional mapping of the human visual cortex at 4 and 1.5 Tesla using deoxygenation contrast EPI. Magn Reson Med. 1993;29:277–279. doi: 10.1002/mrm.1910290221. [DOI] [PubMed] [Google Scholar]
- 4.Ebel A, Maudsley AA, Weiner MW, Schuff N. Achieving sufficient spectral bandwidth for volumetric 1H echo-planar spectroscopic imaging at 4 Tesla. Magn Reson Med. 2005;54:697–701. doi: 10.1002/mrm.20593. [DOI] [PMC free article] [PubMed] [Google Scholar]
- 5.Soher BJ, Young K, Govindaraju V, Maudsley AA. Automated spectral analysis III: Application to in vivo proton MR spectroscopy and spectroscopic imaging. Magn Reson Med. 1998;40:822–831. doi: 10.1002/mrm.1910400607. [DOI] [PubMed] [Google Scholar]
- 6.Ebel A, Soher BJ, Maudsley AA. Assessment of 3D proton MR echo-planar spectroscopic imaging using automated spectral analysis. Magn Reson Med. 2001;46(6):1072–1078. doi: 10.1002/mrm.1301. [DOI] [PubMed] [Google Scholar]
- 7.Young K, Khetselius D, Soher BJ, Maudsley AA. Confidence images for MR spectroscopic imaging. Magn Reson Med. 2000;44:537–545. doi: 10.1002/1522-2594(200010)44:4<537::aid-mrm7>3.0.co;2-8. [DOI] [PubMed] [Google Scholar]


