

Abstract
S-Adenosyl-L-methionine (SAM) is the principal biological methyl donor. Methionine adenosyltransferase (MAT) catalyzes the only reaction that generates SAM. Hepatocytes were treated with cycloleucine, an inhibitor of MAT, to evaluate whether hepatocytes enriched in cytochrome P450 2E1(CYP2E1) were more sensitive to a decline in SAM. Cycloleucine decreased SAM and glutathione (GSH) levels and induced cytotoxicity in hepatocytes from pyrazole-treated rats (with an increased content of CYP2E1) to a greater extent as compared to hepatocytes from saline-treated rats. Apoptosis caused by cycloleucine in pyrazole hepatocytes appeared earlier and was more pronounced than control hepatocytes and could be prevented by incubation with SAM, glutathione reduced ethyl ester and antioxidants. The cytotoxicity was prevented by treating rats with chlormethiazole, a specific inhibitor of CYP2E1. Cycloleucine induced greater production of reactive oxygen species (ROS) in pyrazole hepatocytes than in control hepatocytes, and treatment with SAM, Trolox and chlormethiazole lowered ROS formation. In conclusion, lowering of hepatic SAM levels produced greater toxicity and apoptosis in hepatocytes enriched in CYP2E1. This is due to elevated ROS production by CYP2E1 coupled to lower levels of hepatoprotective SAM and GSH. We speculate that such interactions e.g. induction of CYP2E1, decline in SAM and GSH may contribute to alcohol liver toxicity.
Keywords: Apoptosis, cytochrome P450 2E1, Reactive oxygen species, Reduced glutathione, S-adenosyl-L-methionine, Chlormethiazole, Pyrazole, Cycloleucine, Rat hepatocytes
Introduction
S-Adenosyl-L-methionine (SAM) is the principal biological methyl donor, the precursor of aminopropyl groups utilized in polyamine biosynthesis and, in the liver, SAM is also a precursor of glutathione (GSH) through its conversion to cysteine via the trans-sulfuration pathway [1]. SAM is important for the metabolism and regulation of nucleic acids [2] and for the structure and function of membranes and many other cellular constituents[3, 4]. SAM is particularly important in opposing the toxicity of free radicals generated by various toxins, including alcohol [1]. SAM biosynthesis is the first step in methionine metabolism in a reaction catalyzed by methionine adenosyltransferase (MAT), and MAT is a critical cellular enzyme because it catalyzes the only reaction that generates SAM [5]. In mammals, two different genes, MAT1A and MAT2A, encode for two homologous MAT catalytic subunits, α1 and α2 [6]. MTA1A is expressed mostly in the liver and MAT2A is widely distributed [6]. MAT1 knockout mice have markedly increased serum methionine levels, as well as reduced hepatic SAM and GSH levels [7]. Hepatic SAM levels were decreased in baboons and micropigs fed ethanol [8, 9]. Rat fed intragastrically with ethanol and high fat for 9 weeks had a 40% fall in SAM levels [10].
Cytochrome P450 2E1 (CYP2E1), an ethanol-inducible form of CYP, metabolizes and activates many toxicological important substrates including ethanol, carbon tetrachloride, acetaminophen, and N-nitrosodimethylamine to more toxic products [11]. The ability of SAM in vitro to protect against CYP2E1-dependent toxicity was studied in pyrazole-treated rat hepatocytes treated with arachidonic acid [12]. Exogenous administration of SAM significantly decreased hepatic toxicity induced with Jo2 Fas antibody plus pyrazole treatment in C57BL/6 mice [13]. In the MAT1A knockout mouse, hepatic CYP2E1 mRNA and activity were increased compared with wild type mice [14]. In ethanol-fed rats, SAM levels were decreased while the CYP2E1 levels were increased [9]. We hypothesized that lowering of SAM potentiates CYP2E1 toxicity and this may be one mechanism contributing to alcohol liver injury.
Cycloleucine is an inhibitor of MAT [15], which prevents the conversion of 5′-methylthioadenosine to SAM through the methionine salvation pathway [16, 17], Cycloleucine, 20 mM added to rat hepatocyte cultures, inhibited MAT activity and caused a down regulation of prohibitin 1, an effect prevented by addition of SAM to the hepatocyte cultures [18]. In this study, we incubated hepatocytes from pyrazole-treated rats with cycloleucine to inhibit MAT, and thereby reduce intracellular SAM levels in order to evaluate whether a decrease in SAM levels potentiates CYP2E1 toxicity in primary rat hepatocytes.
Materials and Methods
Rat hepatocytes preparation and treatments
Rats received humane care according to the criteria outlined in the “Guide for the Care and Use of Laboratory Animals” and studies were approved by The Mount Sinai Animal Care and Use Committee. Male Sprague-Dawley rats (Charles River Laboratories, Wilmington, MA), 200–250 g body weight were injected intraperitoneally with pyrazole (Aldrich), an inducer of CYP2E1, 200 mg/kg body weight, once a day for 2 days, or injected with pyrazole plus chlormethiazole (CMZ) (Sigma Chemical Co., St. Louis, MO), a specific inhibitor of CYP2E1 in vivo [19, 20], 75 mg/kg body weight once a day for two days together with the pyrazole. After an overnight fast, rat hepatocytes were isolated by a two-step collagenase (Sigma) perfusion method [21]. Hepatocytes were seeded onto 6-, or 24-well plates, or 10 or 20 cm dishes, which were coated with Matrigel basement membrane Matrix (BD Biosciences, San Jose, CA) and cultured in HeptoZYME-SFM medium (Invitrogen Corp. Carlsbad, CA) containing 2 mM glutamine and 100 units/ml of penicillin and 100 μg/ml streptomycin. After overnight culture, the medium was changed to fresh HepatoZYME with or without 5, 10, and 20 mM cycloleucine (Aldrich).
Assay of SAM levels
SAM levels were assayed by high performance liquid chromatography as previously described [22]. Briefly, 5 ×10⁶ of hepatocytes were seeded onto 15 cm culture dishes, treated with 0 or 20 mM cycloleucine (Aldrich) for 24 or 48 h. Hepatocytes were washed 2 times with PBS and scraped in PBS, centrifuged for 10 min at 80 ×g, and the cell pellet was dispersed with 120 μl of 0.1 M KPi, pH 7.4. After removing 5 μl for detecting the protein concentration, the rest of the cell suspension was added to 120 μl of 0.4 N HClO4, mixed well and centrifuged at 12 000 rpm for 10 min at 4ºC. The supernatant was filtered and applied for high performance liquid chromatography analysis [22] or stored at −20 ºC for further assay.
Cytotoxicity and cell viability change and DNA fragmentation assay
Cytotoxicity and cell viability were measured by a lactate dehydrogenase (LDH) leakage assay (Roche Diagnostics GmbH, Penzberg, Germany) and a 3(4,5-dimethylthiazole-2-yl) 2,5-diphenyltetrazolium bromide (MTT) reduction assay as previously described [23]. The DNA fragmentation pattern (DNA ladder) was carried out by agarose gel electrophoresis as described in reference [24].
Microscopic examination of nuclei
Hepatocytes were seeded on 6-well plates. After treatment with 0, 5, 10 or 20 mM cycloleucine for 48 h, the cells were fixed in ice-cold 80% methanol solution for 30 min. The nuclei were stained with 50 μg/ml propidium iodide (PI) and the cells were subjected to inspection under a fluorescent microscope (Nikon Eclipse, TE2000). Dead cells were identified by condensed or broken nuclei [25].
Western blot analysis
One million cells were plated in 10 cm dishes. After treatment with 0, 5, 10, or 20 mM cycloleucine for different times, the cells were washed twice with PBS, harvested by scraping, centrifuged and the cell pellet was dispersed in PBS containing a protease inhibitor cocktail mix (Roche Applied Science, Indianapolis, IN) and subsequently sonicated for 10 s on ice. Twenty to 75 μg of denatured protein were resolved on 12 or 20% SDS-PAGE and electroblotted onto nitrocellulose membranes (Osmonics Inc, Westboro, MA). The membrane was incubated with rabbit anti-human CYP2E1 polyclonal antibody (1:10000, provided by Dr. J. M. Lasker, Hackensack Biomedical Research Institute, NJ), or rabbit anti-caspase 3 antibody (H-277, Santa Cruz Biotechnology Inc, Santa Cruz, CA, 1: 1000), followed by incubation with relevant horseradish peroxidase conjugated secondary antibodies (1:10000). Detection by the chemiluminescence reaction was carried out for 1 min using the ECL western blotting substrate (Pierce Biotechnology, Rockford, IL), followed by exposure to CL-XPosure film (Pierce Biotechnology). The membranes were stripped with stripping buffer (0.05% v/v, Tween 20 in 0.2 M glycine-HCl, pH 2.5) at 60°C for 1 h, and re-blotted with monoclonal anti-β-actin antibody (Clone AC-74, Sigma Chemical Co., 1:10000). ImageJ image processing program developed by Wayne Rasband (National Institute of Mental Health, Bethesda, Maryland, USA) was used to quantify the bands.
Production of reactive oxygen species (ROS
Fluorescence spectrophotometry was used to measure hepatocyte ROS generation, with 2′,7′-dichlorofluorescin diacetate as the probe. 2′,7′-dichlorofluorescin diacetate penetrates the cells and becomes hydrolyzed by an intracellular esterase to form 2′,7′-dichlorofluorescin which is oxidize by ROS to 2′,7′-dichlorofluorescein (DCF) [26]. Hepatocytes (1×10⁵) were seeded in 6-well plates and incubated without or with 20 mM cycloleucine for 24 or 48 h, washed 2 times with PBS, followed by incubation with 5 μM 2′,7′-dichlorofluorescin diacetate in 1 ml minimal essential medium without phenol red for 30 min at 37 °C in the dark. The cells were washed with PBS, scraped in 2 ml of PBS, and the intensity of fluorescence was immediately read in a fluorescence spectrophotometer at 485 nm for excitation and at 530 nm for emission. Background readings from cells incubated without 2′,7′-dichlorofluorescin diacetate were subtracted. The oxidation-dependent fluorescent dye dihydroethidium (Molecular Probes, Eugene, OR) was used to evaluate in situ production of superoxide anion (O2•−) as described previously [23].
Intracellular GSH measurement
GSH levels were determined using the fluorometric substrate o-phthalaldehyde (MP Biomedicals, LLC, Aurora, Ohio) [27].
Statistical analysis
Results are expressed as mean ± standard deviation of at least 3 independent experiments carried out in duplicate or triplicate, except where indicated. Statistical differences were analyzed by one- or two-way ANOVA followed by multiple comparisons performed with post hoc LSD test (SPSS version 10.0) with P<0.05 as the level of significance. In the case of two-sample comparisons, a Student’s t test assuming unequal variances was used to determine whether there was a significant difference between two sample means.
Results
Effect of pyrazole in vivo and cycloleucine in vitro on hepatocyte SAM levels
The levels of SAM in freshly isolated rat hepatocytes from pyrazole-treated rats were 4-fold lower than control hepatocytes and remained low during culture for 3 days (Two way ANOVA P<0.001). SAM levels in control hepatocytes declined to 50% after culture for 2 and 3 days after separation compared with day 0 or when cultured for 1 day (Fig. 1). SAM levels have been reported to decline in hepatocyte culture [28] with MAT1A mRNA expression progressively decreasing [29]. Treatment with 20 mM cycloleucine for 24 (day 2 of culture) or 48 h (day 3 of culture) dramatically decreased SAM levels to 30% those of non-treated control hepatocytes (Fig. 1, two way ANOVA P<0.001). Undetectable (0) levels of SAM were found in pyrazole hepatocytes incubated with 20 mM cycloleucine for 24 or 48 h (Fig. 1, two way ANOVA P<0.001). Yang et al reported that HepG2 cells treated with 20 mM of cycloleucine for 24 h had a 80% decline in SAM levels [16]. Song et al reported that RAW cells treated with 40 mM cycloleucine for 2 h were depleted of intracellular SAM [30]. Thus, cycloleucine was effective in lowering SAM levels in both hepatocyte cultures, causing a complete loss of detectable SAM in pyrazole hepatocytes with lower initial levels of SAM.
Fig. 1.
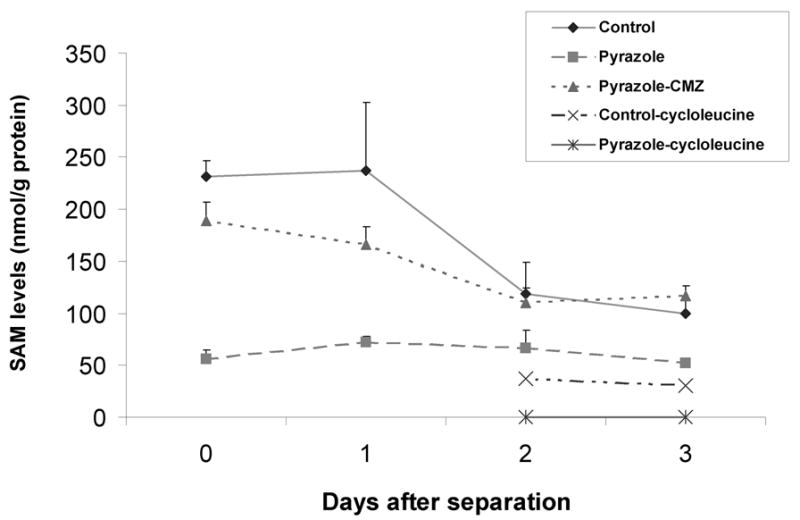
SAM levels in isolated hepatocytes before or after culture in vitro with or without cycloleucine treatment. Five million hepatocytes from control, pyrazole-treated, or pyrazole plus chlormethiazole (CMZ) treated rats were collected and not incubated (day 0) or were incubated in 15 cm dishes for 1, 2, or 3 days. Some hepatocytes were treated on day 1 with 20 mM cycloleucine for 24 or 48 h (day 2 or 3). Cells that were not incubated or cells collected on days 1, 2, or 3 after culture, were treated with HClO4 and SAM levels were assayed by high performance liquid chromatography as described in Materials and Methods.
Cytotoxicity and cell viability change caused by cycloleucine treatmen
Hepatocytes were treated with 0, 5, 10, or 20 mM of cycloleucine and cytotoxicity and cell viability were evaluated by LDH leakage and MTT reduction assays. LDH leakage assay showed hepatocytes from pyrazole rats were more sensitive after 48 h of cycloleucine treatment than were control hepatocytes (Fig. 2A, two-way ANOVA, P<0.001); no significant LDH leakage was found after 24 h of cycloleucine treatment. Similar results were observed with the MTT assay, as pyrazole hepatocytes were more sensitive to cycloleucine treatment than were the control hepatocytes e.g. results with 20 mM cycloleucine at 24 h and 5, 10, and 20 mM of cycloleucine at 48 h. Interestingly, the control hepatocytes remained viable even after 48 h of cycloleucine treatment, a condition which lowered intracellular SAM concentrations more than 70%. Also, the non-cycloleucine treated pyrazole hepatocytes remained viable after 48 h in culture despite low SAM levels thoughout the treatment. However, the pyrazole hepatocytes, without significant SAM levels after the cycloleucine treatment lost viability.
Fig. 2.
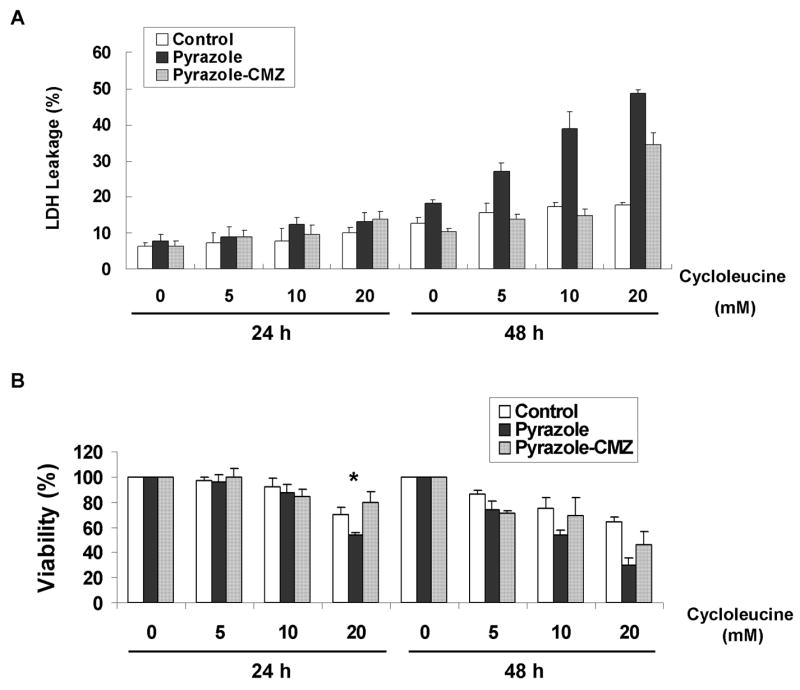
Cytotoxicity assay after cycloleucine treatment. Ten thousand rat hepatocytes were incubated with HepatoZYME medium containing 0, 5, 10, or 20 mM of cycloleucine in 24-well plates for 24 or 48 h. (A) Cell membrane damage was evaluated by LDH leakage. One representative result of two is shown. (B) Cell viability after treatment with different amounts of cycloleucine was assayed with MTT. The A570–630nm of hepatocytes treated with 0 mM of cycloleucine was taken as the 100% viability value. * P<0.005 vs control hepatocytes treated with 20 mM cycloleucine.
Morphological changes and apoptosis caused by cycloleucine treatment
After 48 h of cycloleucine treatment, cell nuclear morphology was assessed by PI staining. Hepatocytes from pyrazole-treated rats showed more condensed chromatin compared to control hepatocytes suggesting an apoptotic mode of cell death (Fig. 3A). Apoptosis was assessed by a DNA ladder assay. Hepatocytes from pyrazole-treated rats showed a DNA ladder after treatment with 10 or 20 mM cycloleucine for 24 h, whereas control hepatocytes only showed a faint DNA ladder after 20 mM cycloleucine treatment (Fig. 3C). Western blot showed the precursor of caspase 3 was cleaved substantially in pyrazole hepatocytes treated with 10 or 20 mM of cycloleucine for 24 and 48 h, whereas little or no cleavage was found with the control hepatocytes (Fig. 3D). These results suggest that the increased toxicity produced by the combination of cycloleucine plus elevated CYP2E1 was apoptotic in nature.
Fig. 3.
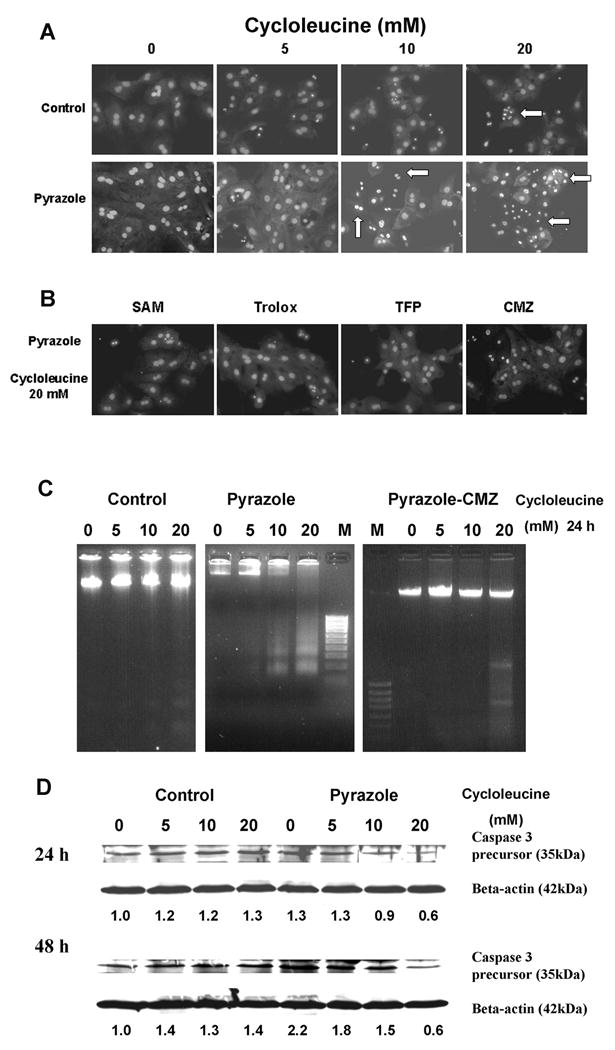
Cycloleucine-induced apoptosis in rat hepatocytes. (A) Morphology of hepatocyte nuclei after 48 h treatment with 0, 5, 10 or 20 mM of cycloleucine (Magnification, ×600). Apoptotic hepatocytes displayed condensation of nuclear chromatin (arrows). (B) Morphology of pyrazole hepatocyte nuclei after 48 h of treatment with 20 mM cycloleucine plus 2 mM SAM, or plus 100 μM Trolox, or plus 2 μM TFP, or hepatocytes from pyrazole plus CMZ treated rats treated with 20 mM of cycloleucine. (C) DNA ladder induced by cycloleucine treatment. One million hepatocytes from control, pyrazole, or pyrazole plus CMZ treated rats were seeded into 10 cm dishes and treated with 0, 5, 10, or 20 mM of cycloleucine for 24 h. DNA fragmentation was assayed as described in Materials and Methods. M, 100 bp DNA ladder marker (Fermetas Inc., Hanover, MD). One representative experiment of three is shown. (D) Western blot analysis of caspase 3 precursor. One million hepatocytes were seeded into 10 cm dishes and treated with 0, 5, 10, or 20 mM of cycloleucine for 24 or 48 h, and 75 μg of cell lysate was subjected to 20% SDS-PAGE. The same membrane was stripped and reblotted with anti-β-actin antibody as loading control. Numbers below the blots refer to the caspase 3 precursor/βactin ratio. The caspase 3 precursor/β-actin ratio of control hepatocytes treated with 0 cycloleucine is taken as 1.
CYP2E1 expression
The increased toxicity found with the pyrazole hepatocytes compared to control hepatocytes after cycloleucine treatment is likely due to the higher expression of CYP2E1 in the former, and relative lower CYP2E1 expression in the latter. Western blot assay of CYP2E1 protein expression showed that the pyrazole hepatocytes just separated from liver had a 2-fold higher level of CYP2E1 than control hepatocytes (Fig. 4A) The levels of CYP2E1 in control and pyrazole hepatocytes decreased after culture in vitro for 1–3 days as previously reported [31]. The CYP2E1 levels remained higher in the pyrazole hepatocytes at all time points (Fig. 4A). Treatment with cycloleucine for 24 h did not reduce CYP2E1 protein expression levels in either pyrazole-treated or control hepatocytes(Fig. 4B).
Fig. 4.
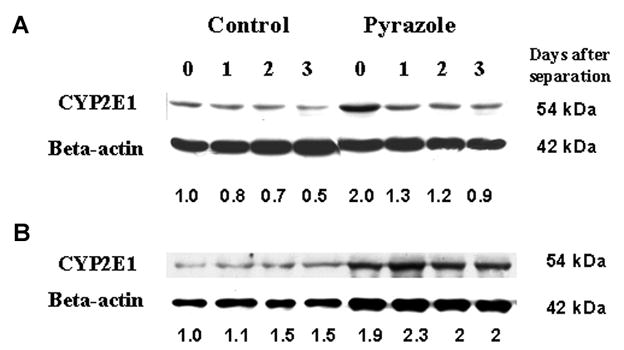
CYP2E1 expression. (A) Western blot analysis of CYP2E1 expression after the separation of hepatocytes (day 0) and after culture in 10 cm dishes for 1, 2, and 3 days. (B) Western blot analysis of CYP2E1 expression after treatment with 0, 5, 10, or 20 mM cycloleucine for 24 h. Quantification of bands with β-actin as loading control is shown below the blots. In (A) the 0 day control CYP2E1/β-actin ratio and in (B) the control hepatocytes treated with 0 mM cycloleucine CYP2E1/β-actin ratio are taken as a ratio of 1. One representative experiment of three is shown.
Protection against CYP2E1 plus cycloleucine induced cell death
To evaluate mechanisms which contribute to the cycloleucine toxicity in pyrazole hepatocytes, SAM, glutathione reduced ethyl ester (GSEE), Trolox (6-hydroxy-2,5,7,8-tetramethylchroman-2-carboxylic acid), a water-soluble vitamin E derivative antioxidant, N-acetyl-L-cysteine (NAC), a general antioxidant and precursor of GSH, trifluoperazine (TFP), a mitochondrial permeability transition inhibitor [32], and Mn (III) tetrakis (1-methyl-4-pyridyl) porphyrin pentachloride (MnTMPyP) (EMD Biosciences, Inc., San Diego, CA), a cell-permeable superoxide dismutase mimetic, which can interact with and remove O2•−, [33] were added to the cell incubation during the cycloleucine treatment, followed by assays of cell viability. The viability of pyrazole hepatocytes was decreased to 25% after 48 h of 20 mM cycloleucine treatment compared to non-treated pyrazole hepatocytes (Fig. 5). SAM, GSEE, Trolox, NAC, MnTMPyP, and TFP increased the viability of the pyrazole hepatocytes subjected to cycloleucine treatment (Fig. 5). Cell nuclear morphology assessed by PI staining also showed that SAM, Trolox, and TFP can protect pyrazole hepatocytes from 20 mM cycloleucine induced apoptosis (Fig. 3B compare to 20 mM cycloleucine pyrazole panel in Fig. 3A). These findings suggest that declines in SAM and GSH (protection by SAM and GSEE), increased production of ROS (protection by Trolox, NAC and MnTMPyP) and decline in mitochondrial membrane potential (protection by TFP) may contribute to the cycloleucine plus CYP2E1 potentiated toxicity.
Fig. 5.
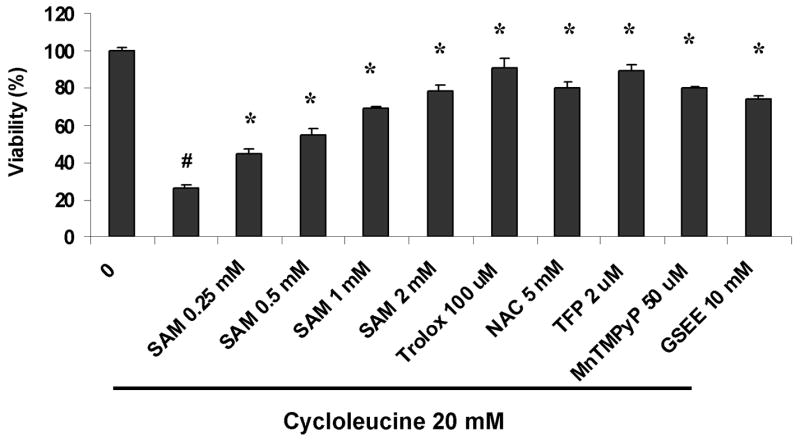
Protection against loss of cell viability induced by cycloleucine in pyrazole-treated hepatocytes. Hepatocytes (1×10⁵ cells) from pyrazole-treated rats were seeded onto 6-well plates, and treated with 20 mM of cycloleucine. Some cells were also treated with either 0.25, 0.5, 1, 2 mM SAM, or 100 μM trolox, or 2 μM TFP, or 50 μM MnTMPyP, or 10 mM GSEE. After incubation for 48 h, cell viability was determined by the MTT assay. Relative viability refers to the 100% × A570–630 nm of cells with treatment/A570–630 nm of cells without any treatment (0 cycloleucine). # P<0.001, t test vs hepatocytes without any treatment. * P<0.001, one-way ANOVA, vs cycloleucine treated pyrazole hepatocytes.
ROS production is increased after cycloleucine treatment
DCF fluorescence was higher in pyrazole hepatocytes treated with 20 mM cycloleucine for 24 or 48 h than that of control hepatocytes treated with cycloleucine for 24 or 48 h, or pyrazole hepatocytes without cycloleucine treatment (Fig. 6A). SAM and Trolox treatment but not TFP addition could blunt the cycloleucine-induced increase of DCF fluorescence in pyrazole hepatocytes (Fig. 6B). The oxidation-dependent fluorescent dye dihydroethidium was used to evaluate in situ production of O2•−. Pyrazole hepatocytes showed a very strong red fluorescence in the nuclei after 48 h of 10 or 20 mM cycloleucine treatment, whereas control hepatocytes showed weak fluorescence (Fig. 6C). SAM and Trolox decreased O2•− production in pyrazole hepatocytes treated with 20 mM cycloleucine (Fig. 6D). These results suggest that cycloleucine plus elevated CYP2E1 increased production of intracellular ROS.
Fig. 6.
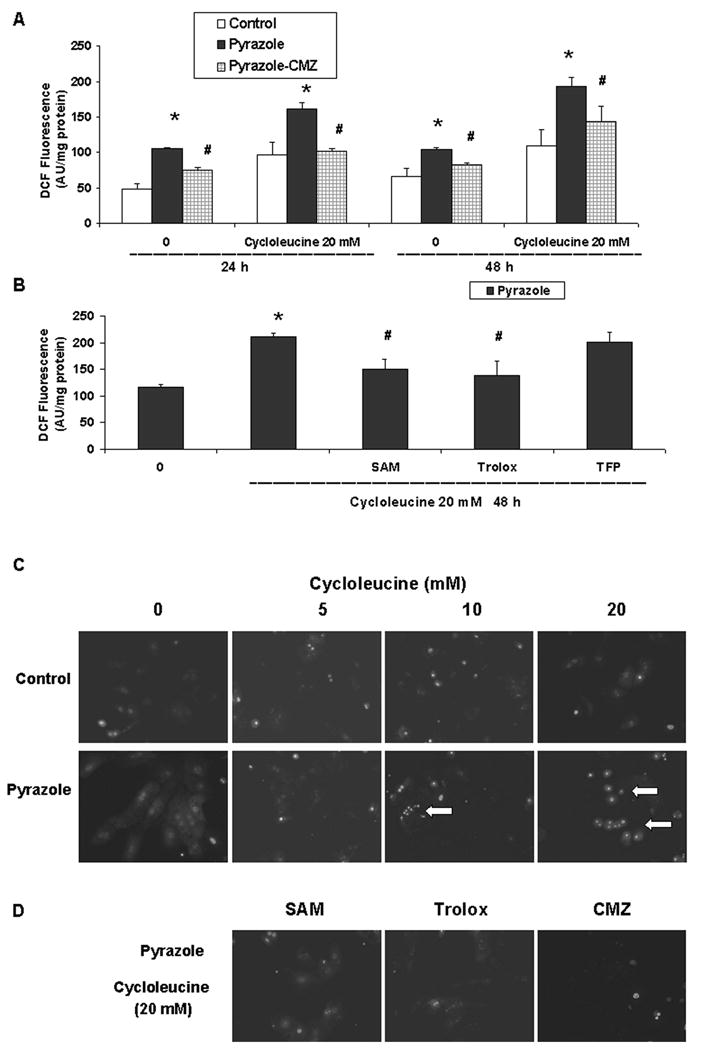
Intracellular ROS production. (A) Intracellular ROS levels of hepatocytes from control, pyrazole, or pyrazole plus CMZ treated rats were assayed using DCF fluorescence after treatment with 0 or 20 mM cycloleucine for 24 or 48 h. The results are expressed as arbitrary units of the fluorescence intensity per mg of protein. * P<0.05, t test vs the same time point for control hepatocytes. # P<0.01 vs the same time point for pyrazole hepatocytes. (B) Effect of treatment with 20 mM cycloleucine plus 2 mM SAM, or 100 μM Trolox or 2 μM TFP on ROS levels. One-way ANOVA, * P<0.001, vs pyrazole hepatocytes without any cycloleucine treatment, # P<0.005, vs pyrazole hepatocytes treated with 20 mM cycloleucine for 48 h. (C) Production of O2•− was assayed using dihydroethidium after treatment with 0 to 20 mM cycloleucine for 48 h as described in Materials and Methods. Images were visualized with a fluorescent microscope (Magnification, × 600). Arrows indicate strong red fluorescence in the nuclei. (D) Effect of treatment with 20 mM cycloleucine plus either 2 mM SAM or 100 μM trolox, on O2•− production by pyrazole hepatocytes or O2•− production by hepatocytes isolated from rats treated with pyrazole plus CMZ and incubated with 20 mM of cycloleucine.
Intracellular GSH levels
GSH is among the most important intracellular antioxidants. The intracellular GSH levels of the pyrazole hepatocytes were only 50% of control hepatocytes after culture in HepatoZYME medium for 24 and 48 h (P<0.001). After cycloleucine treatment for 24 and 48 h, the GSH levels of both hepatocyte preparations were lowered; the GSH levels of the pyrazole hepatocytes remained lower compared with control hepatocytes (Two-way ANOVA, P<0.001, Fig. 7A). SAM, GSEE and Trolox but not TFP could increase the GSH levels compared with pyrazole hepatocytes treated with 20 mM cycloleucine alone for 48 h (Fig. 7B).
Fig. 7.
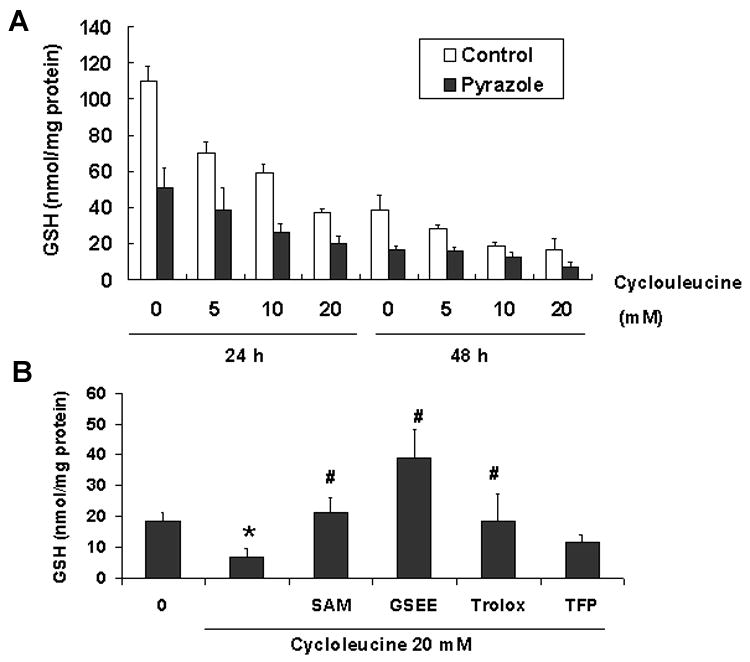
Intracellular levels of reduced glutathione (GSH). (A) GSH levels were determined as described in Materials and Methods after incubating with or without cycloleucine for the indicated times. (B) Effect of treatment with 20 mM cycloleucine plus 2 mM SAM, or 10 mM GSEE, or 100 μM trolox, or 2 μM TFP on intracellular GSH levels. One way ANOVA * P<0.001, vs pyrazole hepatocytes without any cycloleucine treatment, # P<0.001, vs pyrazole hepatocytes treated with 20 mM cycloleucine for 48 h.
The protective effects of the CYP2E1 inhibitor, CMZ
To validate that CYP2E1 plays an important role in the cycloleucine induced toxicity to pyrazole hepatocytes, we treated pyrazole-injected rats with CMZ, a specific inhibitor of CYP2E1 in vivo [19, 20, 34]. The CMZ treatment to the rats also administered pyrazole lowered p-nitrophenol oxidation activity about 50%, showing inhibition of CYP2E1 activity (data not shown). The CMZ treatment increased SAM levels in pyrazole treated hepatocytes (Fig. 1, two way ANOVA, P<0.001) indicating that induction of CYP2E1 is responsible for the decline in hepatic SAM levels caused by pyrazole. CMZ also provided protection against cycloleucine toxicity as shown by a lower LDH leakage compared with pyrazole hepatocytes (Fig. 2A, two-way ANOVA, P<0.001) or increased viability (MTT reduction) (Fig. 2B, two-way ANOVA, P<0.001). A decline in PI staining of the nucleus (Fig. 3B) and a less pronounced DNA ladder (Fig. 3C) also showed that the CMZ treatment was protective against cycloleucine toxicity to pyrazole hepatocytes. CMZ treatment decreased the elevated intracellular DCF fluorescence and O2•− production found in the cycloleucine treated pyrazole hepatocytes (Fig. 6A and 6D).
Discussion
SAM levels were lower in hepatocytes isolated from pyrazole-treated rats than control hepatocytes. Mato et al found that defective formation of SAM is associated with an impaired synthesis of GSH and that reduced synthesis of SAM and GSH can both act together in a self-perpetuating cycle, where a reduction in hepatic GSH leads to an inhibition of MAT activity via a mechanism involving ROS [35]. A critical cysteine residue required for MAT1A activity is oxidized by ROS, with a subsequent decline in MAT1A activity and SAM [36, 37]. Pyrazole elevates expression of CYP2E1, which produces ROS during its catalytic cycle [38]. We speculate that CYP2E1-derived ROS inhibit the MAT1A which results in lower SAM levels in the hepatocytes isolated from pyrazole-treated rats. Further experiments evaluating this are in progress. Hepatocytes from CMZ plus pyrazole treated rats show higher SAM levels than that of pyrazole treated rats, validating a role for CYP2E1 in the pyrazole-induced decline in hepatic SAM levels. Hepatocytes from CMZ plus pyrazole treated rats with lower CYP2E1 activity have lower production of intracellular ROS and O2•− (Fig. 6A and 6D).
Cycloleucine is an effective MAT inhibitor and can strongly lower the SAM levels in control hepatocytes and deplete the SAM level in pyrazole hepatocytes to undetectable concentrations (Fig. 1). Pyrazole hepatocytes that express elevated CYP2E1 were more sensitive to cycloleucine treatment, and exhibited significant cell death compared with that of control hepatocytes (Fig. 2). Cell nuclear morphology, DNA ladder and caspase 3 cleavage revealed that cycloleucine treatment induced apoptosis in pyrazole hepatocytes to a much greater extent than in control hepatocytes. LDH leakage assay indicated that necrosis may also be occurring and contributing to the pyrazole hepatocyte death. The CYP2E1 inhibitor, CMZ protected pyrazole hepatocytes from cycloleucine cytotoxicity by decreasing the elevated CYP2E1 activity, maintaining SAM levels and decreasing ROS levels. It is important to emphasize the very effective hepatoprotective effects of SAM since toxicity is observed only when SAM levels are lowered to undetectable levels. Decreases of “only” 70 to 80% as found with non-treated pyrazole hepatocytes or cycloleucine-treated control hepatocytes did not result in hepatotoxicity even after 3 days in culture.
A likely explanation as to why cycloleucine toxicity is increased in the CYP2E1-expressing cells is an elevated oxidant stress, as ROS is generated via the induction of CYP2E1 in the endoplasmic reticulum, and ROS detoxification is lowered by the decline in SAM. The antioxidants Trolox, NAC and MnTMPyP could rescue pyrazole hepatocytes from cycloleucine-induced cell death. Trolox also decreased the elevated ROS and intracellular O2•− produced by cycloleucine in the pyrazole hepatocytes, indicating that enhanced ROS production appears to be central to the mechanism leading to the death of pyrazole hepatocytes. In addition to an increased production of ROS, a decrease of the intracellular GSH level, likely due to the decline in SAM, is probably an important mechanism for the cycloleucine-induced apoptosis. The lower intracellular GSH levels likely sensitize the pyrazole hepatocytes to the increase in ROS caused by the combination of CYP2E1 plus cycloleucine treatment.
TFP had been used to inhibit the mitochondrial membrane permeability transition and subsequently the loss of mitochondrial membrane potential [32]. TFP effectively protected pyrazole hepatocytes from toxicity induced by cycloleucine treatment, which suggests that a decrease in mitochondrial membrane potential contributes to the potentiation of cell death caused by cycloleucine treatment in the pyrazole hepatocytes. TFP did not restore GSH levels or prevent the increase in ROS suggesting that mitochondrial injury is a downstream target of the elevated oxidative stress.
Fig. 8 shows a scheme of the proposed mechanism of cycloleucine plus pyrazole induced cell death. Pyrazole induces CYP2E1, which increases intracellular ROS production. Cycloleucine and the increased CYP2E1-derived ROS inhibit MAT which results in a decrease in SAM synthesis. A decline in SAM may produce a decline of GSH. The fall in SAM and GSH sustain accumulation of ROS which further causes a loss in MAT activity. The increase in oxidant stress results in a decline in the mitochonrial membrane potential, leading to apoptosis and necrosis. The scheme depicts sites where various protective agents used in this study would operate to protect against the cycloleucine plus CYP2E1 potentiated injury.
Fig. 8.
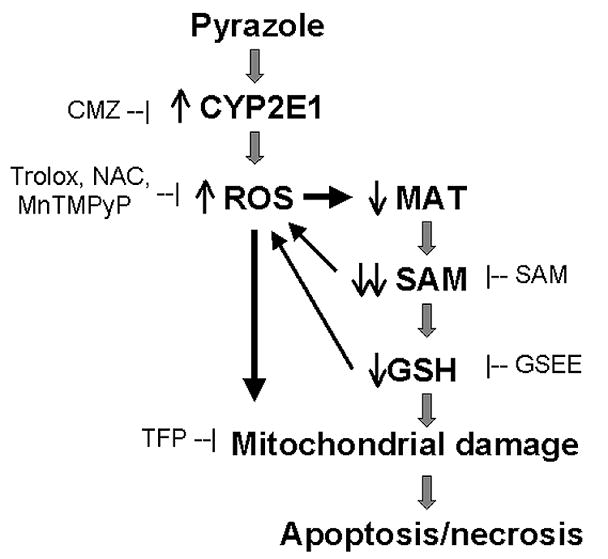
Summary of a proposed mechanism for the enhancement of cell death induced by cycloleucine treatment of pyrazole hepatocytes. Pyrazole elevates CYP2E1 expression and increases intracellular production of ROS. Increases in ROS inhibit methionine adenosyltransferase (MAT) 1A, which combined with cycloleucine inhibition of MAT1A dramatically decrease levels of S-adenosyl-L-methionine (SAM) and GSH. These decreases further potentiation oxidative stress, which results in decreased mitochondrial membrane potential. This ultimately leads to apoptosis and necrosis. Sites within this scheme where CMZ, SAM, GSEE, Trolox, NAC, MnTMPyP, or TFP react are shown to clarify how these additions protect against the cycloleucine plus CYP2E1 enhanced toxicity.
SAM levels were lowered in animal models of alcohol liver injury and human alcoholic liver disease [39]. In these situations the CYP2E1 levels are usually elevated. Depleted SAM, reduced GSH levels, and elevated CYP2E1 expression combine to lead to an increased oxidative stress in hepatocytes, which plays a crucial role in execution of the downstream events of apoptosis and necrosis. That could make an important contribution to mechanisms of alcoholic liver injury.
Acknowledgments
The authors gratefully acknowledge Dr. Andres A. Caro of this laboratory for help on assays of SAM levels. This work was supported by USPHS Grant AA-014132 from the National Institute on Alcohol Abuse and Alcoholism.
Abbreviations
- SAM
S-adenosyl-L-methionine
- GSH
reduced glutathione
- CYP2E1
cytochrome P450 2E1
- MAT
methionine adenosyltransferase
- CMZ
chlormethiazole
- LDH
lactate dehydrogenase
- MTT
3(4,5-dimethylthiazole-2-yl) 2,5-diphenyltetrazolium bromide
- PI
propidium iodide
- ROS
reactive oxygen species
- DCF
2′,7′-dichlorofluorescein
- O2•−
superoxide anion
- GSEE
glutathione reduced ethyl ester
- Trolox
6-hydroxy-2,5,7,8-tetramethylchroman-2-carboxylic acid
- NAC
N-acetyl-L-cysteine
- TFP
trifluoperazine
- MnTMPyP
Mn(III)tetrakis(1-methyl-4-pyridyl)porphyrin pentachloride
Footnotes
Publisher's Disclaimer: This is a PDF file of an unedited manuscript that has been accepted for publication. As a service to our customers we are providing this early version of the manuscript. The manuscript will undergo copyediting, typesetting, and review of the resulting proof before it is published in its final citable form. Please note that during the production process errors may be discovered which could affect the content, and all legal disclaimers that apply to the journal pertain.
References
- 1.Lieber CS. Am J Clin Nutr. 2002;76:1183S–1187S. doi: 10.1093/ajcn/76/5.1183S. [DOI] [PubMed] [Google Scholar]
- 2.Ahmad I, Rao DN. Crit Rev Biochem Mol Biol. 1996;31:361–380. doi: 10.3109/10409239609108722. [DOI] [PubMed] [Google Scholar]
- 3.Boelsterli UA, Rakhit G, Balazs T. Hepatology. 1983;3:12–17. doi: 10.1002/hep.1840030102. [DOI] [PubMed] [Google Scholar]
- 4.Chawla RK, Bonkovsky HL, Galambos JT. Drugs. 1990;40(Suppl 3):98–110. doi: 10.2165/00003495-199000403-00010. [DOI] [PubMed] [Google Scholar]
- 5.Mato JM, Corrales FJ, Lu SC, Avila MA. Faseb J. 2002;16:15–26. doi: 10.1096/fj.01-0401rev. [DOI] [PubMed] [Google Scholar]
- 6.Kotb M, Mudd SH, Mato JM, Geller AM, Kredich NM, Chou JY, Cantoni GL. Trends Genet. 1997;13:51–52. doi: 10.1016/s0168-9525(97)01013-5. [DOI] [PubMed] [Google Scholar]
- 7.Lu SC, Alvarez L, Huang ZZ, Chen L, An W, Corrales FJ, Avila MA, Kanel G, Mato JM. Proc Natl Acad Sci U S A. 2001;98:5560–5565. doi: 10.1073/pnas.091016398. [DOI] [PMC free article] [PubMed] [Google Scholar]
- 8.Lieber CS, Casini A, DeCarli LM, Kim CI, Lowe N, Sasaki R, Leo MA. Hepatology. 1990;11:165–172. doi: 10.1002/hep.1840110203. [DOI] [PubMed] [Google Scholar]
- 9.Villanueva JA, Halsted CH. Hepatology. 2004;39:1303–1310. doi: 10.1002/hep.20168. [DOI] [PubMed] [Google Scholar]
- 10.Lu SC, Huang ZZ, Yang H, Mato JM, Avila MA, Tsukamoto H. Am J Physiol Gastrointest Liver Physiol. 2000;279:G178–185. doi: 10.1152/ajpgi.2000.279.1.G178. [DOI] [PubMed] [Google Scholar]
- 11.Gonzalez FJ. Mutat Res. 2005;569:101–110. doi: 10.1016/j.mrfmmm.2004.04.021. [DOI] [PubMed] [Google Scholar]
- 12.Wu D, Cederbaum AI. Am J Physiol Gastrointest Liver Physiol. 2006;290:G674–684. doi: 10.1152/ajpgi.00406.2005. [DOI] [PubMed] [Google Scholar]
- 13.Wang X, Cederbaum AI. J Pharmacol Exp Ther. 2006;317:44–52. doi: 10.1124/jpet.105.098004. [DOI] [PubMed] [Google Scholar]
- 14.Martinez-Chantar ML, Corrales FJ, Martinez-Cruz LA, Garcia-Trevijano ER, Huang ZZ, Chen L, Kanel G, Avila MA, Mato JM, Lu SC. Faseb J. 2002;16:1292–1294. doi: 10.1096/fj.02-0078fje. [DOI] [PubMed] [Google Scholar]
- 15.Lombardini JB, Talalay P. Adv Enzyme Regul. 1971;9:349–384. doi: 10.1016/s0065-2571(71)80054-7. [DOI] [PubMed] [Google Scholar]
- 16.Yang H, Sadda MR, Li M, Zeng Y, Chen L, Bae W, Ou X, Runnegar MT, Mato JM, Lu SC. Hepatology. 2004;40:221–231. doi: 10.1002/hep.20274. [DOI] [PubMed] [Google Scholar]
- 17.Martinez-Chantar ML, Latasa MU, Varela-Rey M, Lu SC, Garcia-Trevijano ER, Mato JM, Avila MA. J Biol Chem. 2003;278:19885–19890. doi: 10.1074/jbc.M211554200. [DOI] [PubMed] [Google Scholar]
- 18.Santamaria E, Avila MA, Latasa MU, Rubio A, Martin-Duce A, Lu SC, Mato JM, Corrales FJ. Proc Natl Acad Sci U S A. 2003;100:3065–3070. doi: 10.1073/pnas.0536625100. [DOI] [PMC free article] [PubMed] [Google Scholar]
- 19.Hu Y, Mishin V, Johansson I, von Bahr C, Cross A, Ronis MJ, Badger TM, Ingelman-Sundberg M. J Pharmacol Exp Ther. 1994;269:1286–1291. [PubMed] [Google Scholar]
- 20.Gouillon Z, Lucas D, Li J, Hagbjork AL, French BA, Fu P, Fang C, Ingelman-Sundberg M, Donohue TM, Jr, French SW. Proc Soc Exp Biol Med. 2000;224:302–308. doi: 10.1046/j.1525-1373.2000.22435.x. [DOI] [PubMed] [Google Scholar]
- 21.Wu D, Cederbaum AI. J Biol Chem. 2003;278:1115–1124. doi: 10.1074/jbc.M207856200. [DOI] [PubMed] [Google Scholar]
- 22.Caro AA, Cederbaum AI. Biochem Pharmacol. 2005;69:1081–1093. doi: 10.1016/j.bcp.2005.01.007. [DOI] [PubMed] [Google Scholar]
- 23.Zhuge J, Cederbaum AI. Free Radic Biol Med. 2006;40:63–74. doi: 10.1016/j.freeradbiomed.2005.08.012. [DOI] [PubMed] [Google Scholar]
- 24.Bai J, Cederbaum AI. J Biol Chem. 2003;278:4660–4667. doi: 10.1074/jbc.M206273200. [DOI] [PubMed] [Google Scholar]
- 25.Mitsui H, Takuwa N, Maruyama T, Maekawa H, Hirayama M, Sawatari T, Hashimoto N, Takuwa Y, Kimura S. Int J Cancer. 2001;92:55–62. [PubMed] [Google Scholar]
- 26.Siraki AG, Pourahmad J, Chan TS, Khan S, O’Brien PJ. Free Radic Biol Med. 2002;32:2–10. doi: 10.1016/s0891-5849(01)00764-x. [DOI] [PubMed] [Google Scholar]
- 27.Zhuge J, Cederbaum AI. Free Radic Biol Med. 2006;41:1100–1112. doi: 10.1016/j.freeradbiomed.2006.06.017. [DOI] [PubMed] [Google Scholar]
- 28.Avila MA, Carretero MV, Rodriguez EN, Mato JM. Gastroenterology. 1998;114:364–371. doi: 10.1016/s0016-5085(98)70489-5. [DOI] [PubMed] [Google Scholar]
- 29.Garcia-Trevijano ER, Latasa MU, Carretero MV, Berasain C, Mato JM, Avila MA. Faseb J. 2000;14:2511–2518. doi: 10.1096/fj.00-0121com. [DOI] [PubMed] [Google Scholar]
- 30.Song Z, Chen T, Deaciuc IV, Uriarte S, Hill D, Barve S, McClain CJ. Cytokine. 2004;28:214–223. doi: 10.1016/j.cyto.2004.08.004. [DOI] [PubMed] [Google Scholar]
- 31.Wu DF, Clejan L, Potter B, Cederbaum AI. Hepatology. 1990;12:1379–1389. doi: 10.1002/hep.1840120620. [DOI] [PubMed] [Google Scholar]
- 32.Broekemeier KM, Dempsey ME, Pfeiffer DR. J Biol Chem. 1989;264:7826–7830. [PubMed] [Google Scholar]
- 33.Perez MJ, Cederbaum AI. Free Radic Biol Med. 2002;33:111–127. doi: 10.1016/s0891-5849(02)00865-1. [DOI] [PubMed] [Google Scholar]
- 34.Simi A, Ingelman-Sundberg M. J Pharmacol Exp Ther. 1999;289:847–852. [PubMed] [Google Scholar]
- 35.Mato JM, Alvarez L, Ortiz P, Pajares MA. Pharmacol Ther. 1997;73:265–280. doi: 10.1016/s0163-7258(96)00197-0. [DOI] [PubMed] [Google Scholar]
- 36.Sanchez-Gongora E, Ruiz F, Mingorance J, An W, Corrales FJ, Mato JM. Faseb J. 1997;11:1013–1019. doi: 10.1096/fasebj.11.12.9337154. [DOI] [PubMed] [Google Scholar]
- 37.Ruiz F, Corrales FJ, Miqueo C, Mato JM. Hepatology. 1998;28:1051–1057. doi: 10.1002/hep.510280420. [DOI] [PubMed] [Google Scholar]
- 38.Ekstrom G, Ingelman-Sundberg M. Biochem Pharmacol. 1989;38:1313–1319. doi: 10.1016/0006-2952(89)90338-9. [DOI] [PubMed] [Google Scholar]
- 39.Lu SC, Martinez-Chantar ML, Mato JM. J Gastroenterol Hepatol. 2006;21(Suppl 3):S61–64. doi: 10.1111/j.1440-1746.2006.04575.x. [DOI] [PubMed] [Google Scholar]