

Abstract
Stroke is a devastating disease and a leading cause of death and disability. Currently, the only FDA approved therapy for acute ischemic stroke is the intravenous administration of the thrombolytic medication, recombinant tissue plasminogen activator (tPA). However, this treatment has many contraindications and can have dangerous side effects such as intra-cerebral hemorrhage. These treatment limitations have led to much interest in potential adjunctive therapies, such as therapeutic hypothermia (T ≤ 35 °C) and ultrasound enhanced thrombolysis. Such interest may lead to combining these therapies with tPA to treat stroke, however little is known about the effects of temperature on the thrombolytic efficacy of tPA. In this work, we measure the temperature dependence of the fractional clot mass loss Δm(T) resulting from tPA exposure in an in vitro human clot model. We find that the temperature dependence is well described by an Arrhenius temperature dependence with an effective activation energy Eeff of 42.0 ± 0.9 kJ mole−1. Eeff approximates the activation energy of the plasminogen-to-plasmin reaction of 48.9 kJ mole−1. A model to explain this temperature dependence is proposed. These results will be useful in predicting the effects of temperature in future lytic therapies.
Introduction
Stroke is a significant medical problem in the United States and is a leading cause of death and disability (Thompson and Furlan 1996). Currently, the only FDA approved therapy for acute ischemic stroke is the intravenous administration of tissue plasminogen activator (tPA). The tPA activates the in vivo proenzyme plasminogen to the fibrinolytic enzyme plasmin. The plasmin then cleaves the fibrin mesh of the target thrombus, thereby breaking up the clot and eliminating the mechanical obstruction in the affected cerebral artery. This therapy is effective, but the administration of tPA can be problematic. The tPA must be administered within 3 h of stroke symptom onset, and there is a long list of contraindications such as significant hypertension or recent surgery. In addition, there can be severe side effects such as intra-cerebral hemorrhage (ICH), which occurs in approximately 6% of tPA treated patients (Tanne et al 1999).
The potential for disastrous side effects has resulted in interest in possible adjunctive treatments for acute ischemic stroke, such as ultrasound-enhanced thrombolysis (Alexandrov et al 2004), other platelet inhibiting medications such as GP IIb–IIIa inhibitors (Zhang et al 2003), and therapeutic hypothermia (Meden et al 1994). This leads to the exciting possibility of combining lytic and other therapies to improve stroke treatment. An example of this approach is the current treatment of acute myocardial infarction (MI). Many medications are administered such as beta blockers, aspirin and anticoagulants, in addition to thrombolytic therapy in these patients. It is reasonable to expect that future stroke treatment would involve more than one treatment modality. However, there are little data on the effects of combining therapies, such as hypothermia and tPA, on the lytic efficacy of such treatment. Such data would be useful in planning future treatment approaches to stroke.
The use of adjunctive hypothermia treatment is an area of active investigation for both stroke (Meden et al 1994, Krieger et al 2001) and myocardial infarction (Kandzari et al 2004, Dixon et al 2002). Cooling the patient to a lower temperature reduces the metabolic activity of the ischemic cells, thus reducing cell damage and necrosis. Hypothermic treatment is currently under study in the CHILI (Controlled Hypothermia in Large Infarction) and NOCSS (Nordic Cooling Stroke Study) trials (Stroke Trials Registry). Mild hypothermia (T = 30–33 °C) was recently shown to improve neurologic outcome in patients who suffered cardiac arrest (Holzer 2004) and was shown to be safe in individuals suffering from stroke (DeGeorgia et al 2004). However, little is known about the effects of these lower temperatures on the thrombolytic efficacy of tPA in either the in vitro, in vivo or clinical setting.
The phenomenon of ultrasound enhanced thrombolysis (UET) has been under investigation for some time (Suchkova et al 1998, Cheng et al 2005), and was shown to improve vessel recanalization in acute ischemic stroke (Alexandrov et al 2004). However, the mechanism responsible for this lytic enhancement is not well understood. Possibilities include cavitation (Everbach and Francis 2000), acoustic streaming (Francis et al 1995) and thermal heating (Sakharov et al 2000, Higazi et al 1993). Data on the temperature dependence of tPA lytic efficacy would be useful in delineating the mechanisms responsible for ultrasound enhanced thrombolysis. Such data would be of use in planning trials utilizing such therapies.
In this work, the effects of temperature in the range 30–39.5 °C on tPA thrombolysis in an in vitro human clot model are presented. These temperatures span the range proposed for hypothermia therapies in stroke patients. In this model, human whole blood clots are exposed to human fresh-frozen plasma and tPA at fixed temperatures. This roughly approximates the in vivo scenario of an artery occluding thrombus exposed to tPA with little or no blood flow in the affected vessel. A model is proposed to explain the resulting temperature dependence.
Materials and methods
Sample clots were made from human whole blood drawn by sterile venipuncture. Blood was drawn from ten healthy human donors, after local Institutional Review Board approval of the protocol. The blood was aliquoted as 1.5 ml samples into 8 mm diameter sterile glass tubes (Vacutainer), and allowed to clot at room temperature for approximately 10 min. The clots were incubated at T = 37 °C in a temperature controlled water bath (Fisher Scientific, Isotemp 2100) for 3 h to ensure clot retraction (Emelianov et al 2002). The clots were stored at 5 °C prior to use to prevent spontaneous clot degradation, and aged for at least 2 days to ensure maximal clot retraction (Francis and Totterman 1995, Loren et al 1989, Shaw et al 2006). The degree of tPA clot lysis in these sample clots is reproducible and constant for at least 14 days, as shown in a previous work (Shaw et al 2006). The average initial clot mass for clots used in this study was 0.7 ± 0.15 gm (mean and standard deviation), and the typical clot was roughly cylindrical with a diameter of approximately 7 mm. The initial clot length was approximately 2.8 cm, and retracted over time to a length of about 2.4 cm. For purposes of comparison, the diameter of the human middle cerebral artery is 2.5–4 mm (Pay et al 2005).
Recombinant tissue plasminogen activator (tPA, Activase, Genentech, San Francisco, CA) was obtained as a lyophilized powder. The powder was mixed with sterile water to a concentration of 1 mg ml−1, as per the manufacturer’s instructions. The solution was immediately aliquoted into 0.6 ml centrifuge tubes (Fisher Scientific) and stored at −70 °C for later use. It has been demonstrated by others that the biological activity of tPA is stable for at least 1 year when stored in this manner (Jaffe et al 1989). The aliquots were allowed to thaw at room temperature (~22 °C) when needed for use, and the unused portion discarded after a given trial. The concentration of tPA used in all experiments was 3.15 μg ml−1 which is within the therapeutic concentration range in humans (Tanswell et al 1991, Seifried et al 1989).
Human fresh-frozen plasma was obtained from a local blood bank. One unit contained approximately 200–300 cc of plasma. Each unit was briefly thawed to the liquid state, and re-aliquoted into 30 ml centrifuge tubes (Fisher Scientific). The aliquots were immediately stored at −70 °C. Aliquots were than thawed at room temperature as needed for use in a given trial.
The marker for thrombolytic efficacy in these experiments was the fractional clot mass loss, Δm. This quantity is determined by measuring the mass of the sample clot before (mb) and after (ma) an experimental treatment and calculating the fractional change in the clot mass. The use of this quantity as a measure of thrombolysis is well established in the literature (Kimura et al 1994, Suchkova et al 1998).
In each experiment, the sample clot was gently decanted from the 8 mm diameter glass tube onto sterile blotting paper, and weighed on an electronic scale (Mettler E200, Mettler-Toledo, Toledo, OH) to obtain mb. The sample clot was placed into a latex condom and exposed to human fresh-frozen plasma (hFFP) alone (control) or hFFP and tPA (tPA treated). The sample and sample holder were placed in a temperature controlled water bath (Neslab EX-111, Neslab Instruments, Newington, NH) and all exposures were 30 min in duration. This duration was sufficient to result in substantial clot lysis from tPA (Francis et al 1992, Nedelmann et al 2002). In addition, at 30 min more than 55% of the tPA would be administered in standard tPA treatment of an ischemic stroke patient (The NINDS and Stroke rt-PA Stroke Study Group 1995). The values of the temperatures used in these experiments were 30°, 31.3°, 32.8°, 34.8°, 36.7°, 38.3° and 39.5 ± 0.5 °C. The value of T = 36.7 °C is a better reflection of ‘average’ human body temperature than the often-quoted value of 37 °C (Sund-Levander et al 2002).
The hFFP temperature was checked prior to and immediately after each exposure using a small thermocouple (Thermalert TH-5, Physitemp Corp, Clifton, NJ) to ensure temperature stability. At the conclusion of an experiment, the clot was gently decanted from the latex sample holder onto blotting paper and re-weighed to measure ma. Clots from an average of five subjects (range = 3–8) using 16 samples (range = 8–31) were used for each treatment (control or tPA treated) and temperature combination. A total of 226 clot samples were used in these experiments.
The mean per cent mass loss and standard deviations (SD) were calculated using SAS v8.02 (SAS Institute, Cary, NC). Least-squares fits of the mass loss as a function of temperature were performed using SPSS v13.0, and 95% confidence limits were calculated as needed. A p-value of less than 0.05 was considered significant.
Model development
In this section, a physical model of whole blood clot lysis in tPA treated clots is described. An expression is subsequently derived for the temperature dependence of the fractional clot mass loss ΔmtPA(T, t) as a function of duration of tPA exposure t and temperature T.
Physical considerations
Clot lysis in this system occurs due to diffusion of the added tPA into the clot surface from the plasma. This has been established in studies by other groups that have directly observed the diffusion of tPA into the clot (Devcic-Kuhar et al 2004). One can approximate this ‘lytic front’ as a moving boundary that diffuses into the clot normal to the surface. Behind the lytic front, the concentration of tPA in the clot increases from near zero to that of the surrounding plasma (Senf 1981, Blinc and Francis 1996). The tPA then converts plasminogen to plasmin in this region, resulting in clot lysis. Although the fibrin mesh is a small portion of the total clot mass, it is largely responsible for its structural integrity as evidenced by the clinical efficacy of various plasminogen activators including tPA.
In accordance with the above description, we make the following assumptions in formulating a model of tPA induced clot lysis. First, the sample clot is initially uniform in density and chemical composition. Second, the exogenous tPA diffuses into the clot normal to the clot surface, and this ‘lytic front’ advances at a rate proportional to t1/2 consistent with a diffusive process (Pathria 1972). Figure 1 provides an illustration of this model in a cylindrical geometry. Third, the reactions resulting in lysis occur only in the clot volume traversed by the lytic front. Fourth, there is no diffusion of lytic debris such as fibrin degradation products within the clot, therefore conservation of mass holds over local length scales. Fifth, it is assumed that the concentration of tPA behind the lytic front is constant and equal to the plasma concentration of the exogenous tPA. Sixth, the clot density is proportional to the fibrin concentration.
Figure 1.

Schematic of the one-dimensional clot lysis model assuming a cylindrical clot of radius ρo. Clot lysis occurs only for the portions of the clot between ρ= ρo and ρ= ρLF. The tPA concentration within the clot lysis region is assumed to be constant, and at the same value as in the plasma.
The total mass m of the clot at fixed temperature T and time t can be written as
| (1) |
where D(T, r, t) is the density of the clot as a function of position r, T and t. The integral is over the total volume of the clot V. At t equal to zero, the exogenous tPA is added to the system. Recalling the above assumptions, (1) can be written in terms of the fibrin concentration of the clot. If we denote the concentration of a given chemical species x as Cx(T, r, t), the fibrin (F) concentration can be written as CF(T, r, t). Using this notation, expression (1) becomes
| (2) |
where B is an undetermined proportionality constant. Recalling the definition of the fractional mass loss ΔmtPA for tPA treated clots from the introduction;
| (3a) |
with the identification;
| (3b) |
where the mass before and after treatment is mb and ma respectively, and To and to denote the temperature and time at which the experiment is begun. Here To is equal to T, since at the start of the experiment, the clots are exposed to tPA and plasma at temperature T. Expression (3b) follows from the fact that at to, the sample clot has not undergone any treatment, and the clot mass is therefore equal to mb. Similarly, after treatment time t, the sample clot has undergone treatment exposure and the clot mass is equal to ma. For convenience, to is set equal to zero in the further derivation of this model.
Substituting from (2) into (3a) yields the expression
| (4) |
An expression for CF(T, r, t) consistent with the enzymatic reactions that occur in the sample clot remains to be determined.
Chemical considerations
Following the treatment of Rijken et al 1990 and Anand and Diamond (1996), there are four chemical reactions pertaining to thrombolysis by tPA. These reactions include the activation of plasminogen (Pm) to plasmin (P) by tPA, the inhibition of tPA by plasminogen activator inhibitor 1 (PAI), the inhibition of the resulting plasmin by α2 antiplasmin (AP) and the degradation of fibrin (F) by plasmin into fibrin degradation products (Fs). These can be written using standard chemical nomenclature as,
| (5a) |
| (5b) |
| (5c) |
| (5d) |
The quantities on the right-hand side of (5b) and (5c) are the enzyme–inhibitor complexes for tPA (tPA*PAI) and plasmin (P*AP), respectively. These complexes essentially remove active tPA and plasmin from the system, and are assumed to be irreversible. The quantities k1(T), k2(T), k3(T) and k4(T) are the rate constants governing these reactions, and contain the explicit temperature dependence of these processes. Values for k1(T), k2(T), k3(T) and k4(T) have been determined by others at T = 37 °C (Schneider and Nesheim 2004, Coleman et al 1986, Wiman and Collen 1978, Tiefenbrunn et al 1986, Wu and Diamond 1995), and are 0.011, 29, 10 and 0.77 (μM−1 s−1) respectively.
At fixed r and T, such that r is within the region of clot lysis (figure 1), we can write the following expression from (5d) using standard chemistry nomenclature: d
| (6) |
where t′ denotes the time since the lytic front has passed through r. Prior to t′ equal to zero, no clot lysis can occur at r as there is no available tPA to convert plasminogen to plasmin (5a). Therefore t′ is a function of both r and t and one can postulate that t′ has the form
| (7) |
where τ (r) is the time at which the lytic front passes through position r.
Recalling assumption number four, local conservation of mass requires that
| (8) |
At t′ equal to 0, there are no fibrin degradation products therefore CFs(0) is 0. This expression can be substituted into (6) yielding
| (9) |
Solving yields the formal solution
| (10) |
where t″ is an integration variable.
Similarly, from (5a) and (5c), one can obtain
| (11) |
This equation can be simplified by taking into account the relative magnitudes of the various chemical species.
The average concentration of plasminogen activator inhibitor 1 (PAI) in venous clot is approximately 11.4 nM (Robbie et al 1996), using a value for the clot density of 1.08 g ml−1 (Nahirnyak et al 2006). The concentration of tPA used in these experiments is ~50 nM, which is substantially larger than the concentration of PAI. In addition, the volume of the plasma containing the tPA is 30 ml compared to an approximate clot volume of 1 ml. This justifies the assumption that CtPA is constant and equal to CtPA(0) throughout the lytic region defined by the advancing lysis front. Similarly, the concentration of plasminogen in venous clot is approximately 0.13 μM (Robbie et al 1996) which is smaller than the concentration of α2 antiplasmin either in venous clot (0.44 μM) or in plasma (1.28 μM). Therefore, CAP(t′) is approximated by CAP(0) for all t′.
Solving (11) requires an expression for CPm(t′). Recalling (5a), one can obtain
| (12) |
using the approximation that CtPA(t′) equals CtPA(0) for all t′. Solving for CPm(t′) yields
| (13) |
Recalling that CtPA(0) is approximately 50.1 nM and k1 is 0.011 (μM−1 s−1), the exponential term in (13) is equal to 1 for all meaningful values of t′. Therefore (13) reduces to
| (14) |
This implies that reaction (5a) is not limited by the amount of its substrate plasminogen.
Taking into account these approximations, (11) can be written as
| (15) |
The solution to (15) is
| (16) |
with the initial condition CP(T, 0) equal to 0. Expression (16) can then be used to solve (10) yielding (17):
| (17) |
Recalling that k3 is much larger than both k1 and k4, one notes that the second term in the exponential argument of (17) is proportional to (1/k3)2 which is quite small compared to the first term. Therefore, the second term is dropped leading to the approximate expression
| (18) |
This expression for CFs(T, t′) can now be utilized to determine ΔmtPA(T, t).
From (4), one can obtain
| (19) |
where the clot volume has been divided into two portions; N denotes the normal portion of the clot, and L denotes the portion of the clot undergoing lysis. In the N portion of the clot, the fibrin concentration is constant and is equal to its initial concentration. Using this fact and recalling (8), expression (19) can be simplified to
| (20) |
By definition, adding volumes N and L yields V, therefore (20) reduces to
| (21) |
where the explicit dependence of CFs on t′ is noted and CF(T, r, 0) is a constant and equal to CF(0). Substituting (18) into (21) yields the approximate expression
| (22) |
where β(T) is defined as
| (23) |
In order to evaluate (22) for the experimental model here, we assume that a given sample can be approximated as a cylindrical clot with radius ρo and height ho (figure 1). Recalling the definition of the ‘lytic front’, we can write
| (24) |
where ρLF(T, t) is the position of the lytic front at time t and fixed temperature T, and ν(T) is the ‘lytic rate’. Note that the contribution to clot lysis of the cylinder ends is neglected. One can then determine the form for τ(r) from (7) by arguing that at time t equal to τ, the lytic front is at position ρ. Therefore (24) then yields
| (25a) |
and
| (25b) |
Finally, substituting into (7) with the identification that r is ρ results in the expression,
| (25c) |
where the temperature dependence of ν(T) has been made explicit. Substituting (25c) into (22) and taking into account the assumed cylindrical geometry yields the expression
| (26) |
Expanding the exponential term in (26) and keeping terms to first order in β only yields
| (27) |
Evaluating (27) to first order in (ν/ρo) yields the expression
| (28) |
It is known that the temperature dependence of kinetic rate constants typically follows an Arrhenius temperature dependence (Segel 1975),
| (29) |
where k is the rate constant for a given enzymatic reaction, F is a constant proportional to the number of collisions per unit time that can result in a reaction, Ea is the ‘activation energy’, R is the molar gas constant and T is the temperature in Kelvin.
In addition, the lytic rate ν in (24) also depends upon temperature. As we have postulated that diffusion is the mechanism for tPA penetration of the clot, we recall the classical expression for the average mean square displacement x for a particle undergoing Brownian motion (Pathria 1972),
| (30) |
where t is time, and D is the diffusion constant for the given process. The initial condition is x is zero at t equal to zero. As we have assumed that the progression of the lytic front within the clot is the result of a diffusive process and is proportional to t1/2, it is reasonable to assume that the lytic rate ν(T) of (24) is proportional to D1/2, as follows from (30). We therefore assume that
| (31) |
where νo is an undetermined proportionality constant, and DrtPA is the diffusion constant for tPA in this system. Finally, it is known that the temperature dependence of diffusion constants in liquids can be approximated by an Arrhenius temperature dependence (Crank 1976, Rah and Eu 2002) such that we can assume
| (32) |
where Do is a constant, ED is the activation energy for this diffusive process and T is the temperature in Kelvin. It should be noted that Do has a temperature dependence of approximately T 1/2 (Rah and Eu 2002), however, this quantity varies by only a few per cent over the temperature range discussed in this work. This weak temperature dependence is therefore neglected in the further development of the model.
Substitution of (32) into (31) yields
| (33) |
for the temperature dependence of ν(T).
Using (30)–(33), equation (28) can be written as
| (34) |
where (F1, E1), (F3, E3) and (F4, E4) are the collision frequency and activation energy for k1, k3 and k4 respectively. As can be seen, (33) predicts an Arrhenius temperature dependence for ΔmtPA at constant t, with an ‘activation energy’ of (E1 + E4 − E3 + [ED/2]).
It is interesting to note that the above model can be used to determine the time dependence for tPA induced clot lysis. Although there are little data for short time scale measurements (0–30 min) such as those discussed in this work, there are studies in the literature that measured tPA induced clot lysis for longer time scales. To determine the time dependence of Δm(T, t) for large t, we note that for long time scales, t dominates the exponential term in equation (26). This expression can then be approximated as
| (35) |
Evaluating the integral yields
| (36) |
Note that this expression has the form
| (37) |
where A, B and C are constants.
Results
Figure 2 exhibits the fractional clot mass loss (in per cent) for all clots as a function of temperature for the tPA and control groups. The error bars are the standard errors for the data. The fractional clot mass loss for the tPA treated group was significantly larger than that of the control group at all temperatures. It can be concluded that ΔmtPA increases with increasing temperature whereas there is little or no effect of temperature on Δmcontrol. Conversely, the thrombolytic efficacy of tPA is reduced at the temperatures contemplated for clinical hypothermic therapy (T = 30–33 °C).
Figure 2.
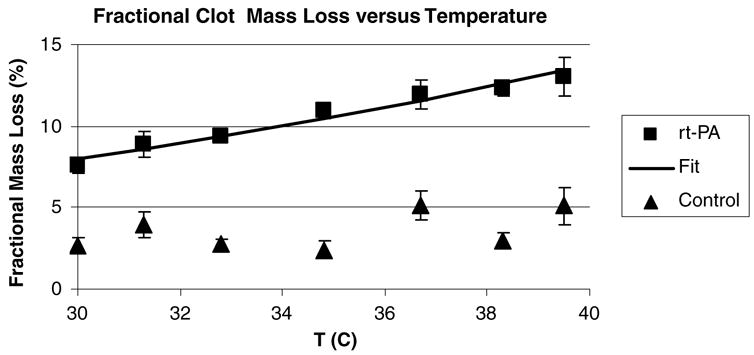
Mean fractional mass loss (in per cent) for the tPA treated and control clots versus temperature. The error bars are the standard errors of the mean (SEM) for the data. The solid line is a fit to an Arrhenius temperature dependence (35) of ΔmtPA with an Eeff = 43 ± 3.8 (kJ mole−1) and the agreement is very good (R2 = 0.95).
The solid line in figure 2 is a fit to the data of the expression
| (38) |
where Eeff and A are constants derived from the fit. Here, R has a value of 8.306 × 10⁻³ (kJ M−1 K−1). The constants were determined by a least-squares fit, and A = 1.99 × 10⁸ (95% confidence limits = 0.47–8.49 × 10⁸) and Eeff = (43.0 ± 3.8 kJ mole−1 K−1) (±SE, R2 = 0.95). The limits on A are artificially large since the least-squares fitting routine converts the data to a logarithmic form prior to analysis.
Discussion
It has been shown that the temperature dependence of tPA clot lysis is well described by a simple Arrhenius temperature dependence with an effective activation energy of Eeff = 43 ± 3.8 (kJ mole−1 K−1). This result is consistent with the chemical model proposed above, which predicts such an Arrhenius temperature dependence. To the authors’ knowledge, this is the first report of the temperature dependence of tPA in human whole blood clots and plasma. From a clinical perspective, this result implies that the lytic efficacy of rt-PA is likely reduced at the lower temperatures currently contemplated for hypothermic therapy in acute ischemic stroke. Also quantification of this temperature dependence bounds the amount of lysis from UET that can be attributed to temperature. These findings have implications for the design and execution of lytic therapy trials utilizing hypothermia.
A possible explanation for the observed Arrhenius temperature dependence may be found in the work of Rijken et al 1990. This group measured the temperature dependence of plasminogen activation (reaction (5a) in this work) in a well-controlled system containing fibrinogen, plasminogen, α2 antiplasmin and tPA ([tPA] = 3 μg ml−1) in buffered normal saline. The conversion of plasminogen to plasmin exhibited an Arrhenius temperature dependence with an activation energy of 48.9 kJ mol−1; in the current work this corresponds to E1 (see (5a)). The value Eeff = 43 ± 3.8 (kJ mole−1) determined from the data here approximates E1, differing by 12%. If one makes the identification from (34) and (38) that
| (39) |
one can conclude that the activation energy for tPA clot lysis in human whole blood clots is dominated by the plasminogen to plasmin conversion reaction of (5a). To our knowledge, there are no measurements of E4, E3 or ED available in the literature for comparison, however the results here imply that the quantity (E4 − E3 + [ED/2]) is small compared with E1.
Others have found that the lytic efficacy of tPA depends upon temperature. Schwarzenberg et al 1998 measured the time to complete clot lysis in fibrin clots as a function of temperature from 30 to 45 °C at a concentration of [tPA] = 0.52 (mg ml−1). The lysis time increased from 111 min at T = 37.5 °C to 186 min at 30 °C. Similarly, Yenari et al 1995 found that clot lysis decreased 0.5% per °C in rabbit clots exposed to tPA ([tPA] = 3 (μg ml−1)). However, the work described here used human whole blood clots and human plasma, which is closer to the in vivo scenario of an acute thrombotic event.
As a test of the model, data measuring tPA induced clot lysis as a function of exposure time were obtained from the literature, and fit to (37) using a nonlinear least-squares fitting routine (SPSS 13.0). The results of this analysis are shown in figures 3(a) and (b) which exhibit the data of Trusen et al 1998 and Onundarsen et al 1992 respectively. In the work of Trusen et al, human whole blood clots were exposed to plasma at varying concentrations of tPA, and the clot mass loss measured as a function of time. Data for two tPA concentrations, 0.1 and 3.0 (μg ml−1) respectively, are shown and the lines are fits to (37). For the 0.1 (μg ml−1) data, the fitting parameters were determined to be A = 1.08 ± 0.33 h−1 and B = 16.3 ± 1.4 h−1/2. For the 3 (μg ml−1) data, A = 1.2 ± 0.2 h−1 and B = 26.6 ± 1.3 h−1/2, and the description is quite good (R2 ⩾ 0.98). In both cases, the linear t term (parameter C) in (37) was not significant.
Figure 3.
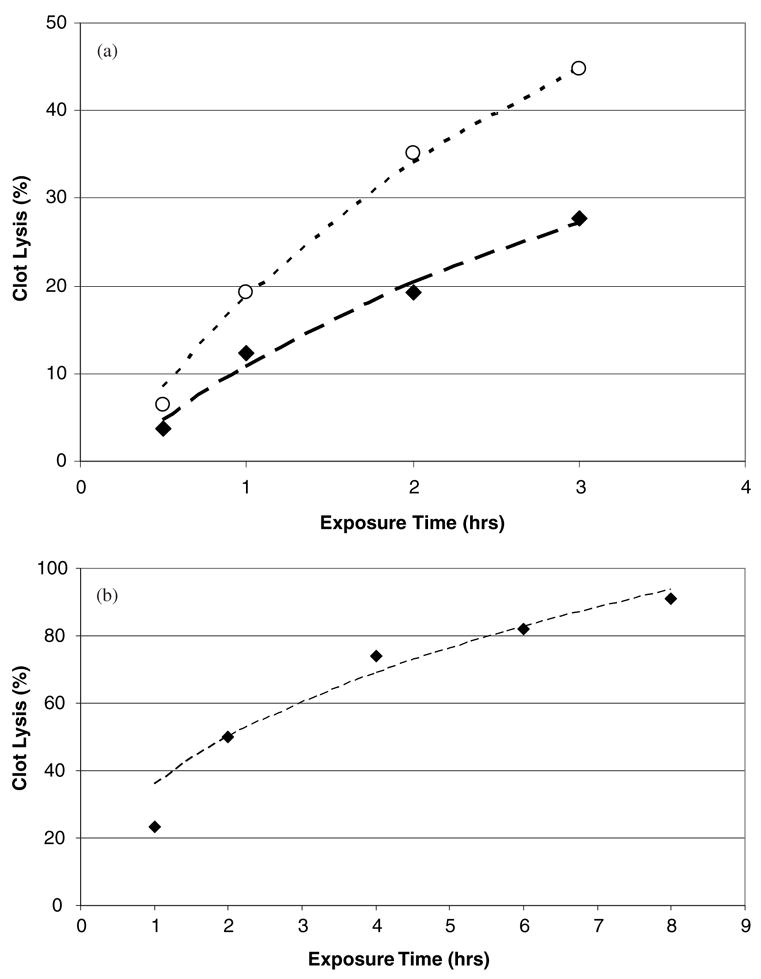
(a) Data from Trusen et al 1998 measuring tPA induced clot lysis in human whole blood clots and plasma. Data exhibited are for clots exposed to tPA at a concentration of 0.1 (◆) and 3 (○) μg ml−1 respectively. The lines are fits to the data of equation (37) and the agreement is excellent (R2 ⩾ 0.98). (b) Data from Onundarsen et al 1992 measuring tPA induced clot lysis in whole blood clots. Clots were exposed to a tPA concentration of 0.25 μg ml−1. The line is a fit to (37), and the agreement is quite good (R2 = 0.88).
In the work of Onundarsen et al 1992, whole blood clots were incubated with radio-labeled fibrinogen, and clot lysis determined by measuring the fraction of radioactive fibrin split products in the solute. These clots were exposed to tPA in plasma at a concentration of 0.25 (μg ml−1), and clot lysis measured as a function of time. These data are exhibited in figure 3(b) and the line is a fit to (37) as before. The parameters obtained from the fit were B = 37.7 ± 10.1 h1/2 and C = 1.6 ± 4.2 h−1, and the description is good (R2 = 0.88). The exponential term (parameter A) in (37) was not significant for this fit. This is likely due to the long time scales (up to 8 h) used in their experiments. At such time scales, clot lysis in the regions of the clot where tPA has penetrated may have had enough time for reactions (5a)–(5d) to go to completion. Therefore, subsequent clot lysis is dominated by the diffusive behavior of the tPA, thus the importance of the t1/2 term in the subsequent fit to (37).
Given the reasonable description of the predicted temperature dependence with the data presented here, and the predicted time dependence (37) with the data of Onundarsen et al 1992 and Trusen et al 1998, one can conclude that the model may be a reasonable description of tPA induced clot lysis in the in vitro setting. It seems that the phenomenon of in vitro tPA induced clot lysis is predominantly controlled by (1) the chemical reactions elucidated in (5a)–(5d) and (2) the diffusion of exogenous tPA into the sample clot. In particular the temperature dependence of ΔmtPA(T, t) appears to be controlled by the plasminogen to plasmin conversion reaction of (5a), as evidenced by the correspondence of Eeff and E1, at least for short (~30 min) time scales. Clot lysis over these short time scales is of substantial clinical interest, since early vessel recanalization is linked to better long-term outcome in ischemic stroke patients (Molina et al 2004).
A significant limitation of these experiments is that the in vitro system is static in nature. In the in vivo setting of an acute thrombus, there is a time-dependent pressure gradient from the cardiac pulse pressure. It is known that such pressure gradients increase the penetration of thrombolytics into similar sample clots (Blinc and Francis 1996), thus increasing the degree of clot lysis. Therefore, the degree of clot lysis discussed here is likely different, and probably less than what can be expected in the in vivo setting from tPA thrombolysis. Also, venous stasis clots are likely quite different in composition from arterial thrombi, limiting the applicability of these results to the in vivo and clinical setting. In addition, it is likely that the total amount of plasminogen available as a substrate for the plasminogen-to-plasmin reaction is somewhat larger than is assumed, since plasma also contains plasminogen. In general, the various chemical approximations made do limit the applicability of this model to the in vivo situation of venous clots with low plasminogen and tPA concentration. However, the general formulation of this mode may be useful in studying more complex and realistic models of clot lysis.
The above results imply that the temperature dependence of tPA lysis in the in vitro system used here is predominantly controlled by the conversion of plasminogen into plasmin. This result may be of use in the modeling of future lytic therapies utilizing tPA or plasminogen and hypothermia, and could provide an estimate of the contribution of temperature changes to the lytic efficacy of ultrasound enhanced thrombolysis.
Acknowledgments
This work was supported by the Whitaker Foundation (RG 0128-01) and NIH/NINDS (K02-NS056253-01). Useful discussions with Dr Jason M Meunier are gratefully acknowledged. The authors would also like to thank the reviewers of this manuscript whose suggestions were instrumental in refining the clot lysis model presented here.
References
- Adams HP, et al. Guidelines for thrombolytic therapy for acute stroke: a supplement to the guidelines for the management of patients with acute ischemic stroke. A statement for healthcare professionals from a social writing group of the stroke council, American Heart Association. Stroke. 1996;27:1711–8. [PubMed] [Google Scholar]
- Alexandrov AV, et al. for the CLOTBUST investigators. Ultrasound-enhanced systemic thrombolysis for acute ischemic stroke. N Engl J Med. 2004;351:2170–8. doi: 10.1056/NEJMoa041175. [DOI] [PubMed] [Google Scholar]
- Anand S, Diamond SL. Computer simulation of systemic circulation and clot lysis dynamics during thrombolytic therapy that accounts for inner clot transport and reaction. Circulation. 1996;94:763–74. doi: 10.1161/01.cir.94.4.763. [DOI] [PubMed] [Google Scholar]
- Blinc A, Francis CW. Transport processes in fibrinolysis and fibrinolytic therapy. Thromb Haemost. 1996;76:481–91. [PubMed] [Google Scholar]
- Cheng JY, Shaw GJ, Holland CK. In vitro microscopic imaging of enhanced thrombolysis with 120 kHz ultrasound in a human clot model. ARLO. 2005;6:25–9. doi: 10.1121/1.1815039. [DOI] [PMC free article] [PubMed] [Google Scholar]
- Coleman PL, Patel PD, Cwikel BJ, Rafferty UM, Sznycer-Laszuk R, Gelehrter TD. Characterization of the dexamethsaone-induced inhibitor of plasminogen activator in HTC hepatoma cells. J Biol Chem. 1986;261:4352–7. [PubMed] [Google Scholar]
- Crank J. The Mathematics of Diffusion. New York: Oxford University Press; 1976. [Google Scholar]
- DeGeorgia MA, Kriger DW, Abou-Chebl A, Devlin TG, Jauss M, Davis SM, Koroshetz WJ, Rordorf G, Warach S. Cooling for acute ischemic brain damage (COOL AID): a feasibility trial of endovascular cooling. Neurology. 2004;63:312–7. doi: 10.1212/01.wnl.0000129840.66938.75. [DOI] [PubMed] [Google Scholar]
- Devcic-Kuhar B, et al. Ultrasound affects distribution of plasminoden and tissue-plasminogen activator in whole blood clots in vitro. Thromb Haemost. 2004;92:980–5. doi: 10.1160/TH04-02-0119. [DOI] [PubMed] [Google Scholar]
- Dixon SR, et al. Induction of mild systemic hypothermia with endovascular cooling during primary percutaneous coronary intervention for acute myocardial infarction. J Am Coll Cardiol. 2002;40:1928–34. doi: 10.1016/s0735-1097(02)02567-6. [DOI] [PubMed] [Google Scholar]
- Emelianov SY, Chen X, O’Donnell M, Knipp B, Myers D, Wakefield TW, Rubin JM. Triplex ultrasound: Elasticity imaging to age deep venous thrombosis. Ultrasound Med Biol. 2002;28:757–67. doi: 10.1016/s0301-5629(02)00516-1. [DOI] [PubMed] [Google Scholar]
- Everbach C, Francis CD. Cavitational mechanisms in ultrasound accelerated thrombolysis at 1 MHz. Ultrasound Med Biol. 2000;26:1153–60. doi: 10.1016/s0301-5629(00)00250-7. [DOI] [PubMed] [Google Scholar]
- Francis CW, Blinc A, Lee S, Cox C. Ultrasound accelerates transport of recombinant tissue plasminogen activator into clots. Ultrasound Med Biol. 1995;21:419–24. doi: 10.1016/0301-5629(94)00119-x. [DOI] [PubMed] [Google Scholar]
- Francis CW, Önundarson PT, Carsternsen EL, Blinc A, Meltzer RS, Schwarz K, Marder VJ. Enhancement of fibrinolysis in vitro by ultrasound. J Clin Invest. 1992;90:2063–8. doi: 10.1172/JCI116088. [DOI] [PMC free article] [PubMed] [Google Scholar]
- Francis CW, Totterman S. Magnetic resonance imaging of deep vein thombi correlates with response to thrombolytic therapy. Thromb Haemost. 1995;73:386–91. [PubMed] [Google Scholar]
- Higazi AA, Katz I, Mayer M. The effect of ultrasonic irradiation and temperature on fibrinolytic activity in vitro. Thromb Res. 1993;69:251–3. doi: 10.1016/0049-3848(93)90050-x. [DOI] [PubMed] [Google Scholar]
- Holzer M for the The Hypothermia After Cardiac Arrest Study Group. Mild therapeutic hypothermia to improve the neurologic outcome after cardiac arrest. N Engl J Med. 2004;346:549–56. doi: 10.1056/NEJMoa012689. [DOI] [PubMed] [Google Scholar]
- Jaffe GJ, Green GD, Abrams GM. Stability of recombinant tissue plasminogen activator. Am J Ophthalmol. 1989;108:90–1. doi: 10.1016/s0002-9394(14)73272-6. [DOI] [PubMed] [Google Scholar]
- Kandzari DE, et al. Feasibility of endovascular cooling as an adjunct to primary percutaneous coronary intervention (results of the LOWTEMP pilot study) Am J Cardiol. 2004;93:636–9. doi: 10.1016/j.amjcard.2003.11.038. [DOI] [PubMed] [Google Scholar]
- Kimura M, Ijima S, Kobayashi K, Furuhata H. Evaluation of the thrombolysis of tissue-type plasminogen activator with ultrasound irradiation: In-vitro experiment involving assay of the fibrin degradation products from the clot. Biol Pharm Bull. 1994;17:126–30. doi: 10.1248/bpb.17.126. [DOI] [PubMed] [Google Scholar]
- Koren R, Hammes GG. A kinetic study of protein-protein interactions. Biochem. 1976;15:1165–71. doi: 10.1021/bi00650a032. [DOI] [PubMed] [Google Scholar]
- Krieger DW, DeGeorgia MA, Abou-Chebi A, Andrefsky JC, Sila CA, Katzan IL, Mayberg MR, Furlan AJ. Cooling for acute ischemic brain damage (COOL AID) Stroke. 2001;32:1857. doi: 10.1161/01.str.32.8.1847. [DOI] [PubMed] [Google Scholar]
- Loren M, Garcia Frade LJ, Toorado MC, Navarro JL. Thrombus age and tissue plasminogen activator mediated thrombolysis in rats. Thromb Res. 1989;56:67–76. doi: 10.1016/0049-3848(89)90009-1. [DOI] [PubMed] [Google Scholar]
- Meden P, Overgaard K, Petersen H, Boysen G. Effect of hypothermia and delayed thrombolysis in a rat embolic stroke model. Acta Neurol Scand. 1994;90:91–8. doi: 10.1111/j.1600-0404.1994.tb02686.x. [DOI] [PubMed] [Google Scholar]
- Molina CA, Alexandrov AV, Demchuk AM, Saqqur M, Uchino K, Alvarez-Sabin J. The CLOTBUST Investigators. Improving the predictive accuracy of recanalization on stroke outcome in patients treated with tissue plasminogen activator. Stroke. 2004;35:151–6. doi: 10.1161/01.STR.0000106485.04500.4A. [DOI] [PubMed] [Google Scholar]
- Nahirnyak VM, Yoon SW, Holland CK. Acousto-mechanical and thermal properties of clotted blood. J Acoust Soc Am. 2006;119:3766–72. doi: 10.1121/1.2201251. [DOI] [PMC free article] [PubMed] [Google Scholar]
- Nedelmann M, Eicke BM, Lierke EG, Heimann A, Kempski O, Hopf HC. Low-frequency ultrasound induces nonenzymatic thrombolysis in vitro. J Ultrasound Med. 2002;21:649–56. doi: 10.7863/jum.2002.21.6.649. [DOI] [PubMed] [Google Scholar]
- Onundarsen PT, Francis CW, Marder VJ. Depletion of plasminogen in vitro or during thrombolytic therapy limits fibrinolytic potential. J Lab Clin Med. 1992;120:120–8. [PubMed] [Google Scholar]
- Pathria RK. Statistical Mechanics. New York: Pergamon; 1972. [Google Scholar]
- Pay SB, Varma RG, Kulkarni RN. Microsurgical anatomy of the middle cerebral artery. Neurol India. 2005;53:186–90. doi: 10.4103/0028-3886.16406. [DOI] [PubMed] [Google Scholar]
- Rah K, Eu BC. Free volume and density and temperature dependence of diffusion coefficients of liquid mixtures. Phys Rev Lett. 2002;88:065901. doi: 10.1103/PhysRevLett.88.065901. [DOI] [PubMed] [Google Scholar]
- Rijken DC, Seifried E, Barrett-Bergshoeff MM, Dooijewaard G. Plasminogen activation at low temperatures in plasma samples containing therapeutic concentrations of tissue-type plasminogen activator or other thrombolytic agents. Thromb Haemost. 1990;64:47–52. [PubMed] [Google Scholar]
- Robbie LA, Bennett B, Croll AM, Brown PA, Booh NA. Proteins of the fibrinolytic system in human thrombi. Thromb Haemost. 1996;75:127–33. [PubMed] [Google Scholar]
- Sakharov V, Hekkenberg RT, Rijken DC. Acceleration of fibrinolysis by high frequency ultrasound: the combination of acoustic streaming and temperature rise. Thromb Res. 2000;100:333–40. doi: 10.1016/s0049-3848(00)00319-4. [DOI] [PubMed] [Google Scholar]
- Schneider M, Nesheim M. A study of the protection of plasmin from antiplasmin inhibition within an intact fibrin clot during the course of clot lysis. J Biol Chem. 2004;279:13333–9. doi: 10.1074/jbc.M313164200. [DOI] [PubMed] [Google Scholar]
- Schwarzenberg H, Müller-Hülsbeck S, Brossman J, Glüer CG, Bruhn HD, Heller M. Hyperthermic fibrinolysis with tPA: in vitro results. Cardiovasc Interv Radiol. 1998;21:142–5. doi: 10.1007/s002709900231. [DOI] [PubMed] [Google Scholar]
- Segel IH. Enzyme Kinetics: Behavior and Analysis of Rapid Equilibrium and Steady State Enzyme Systems. New York: Wiley; 1975. pp. 930–1. [Google Scholar]
- Seifried E, Tanswell P, Ellbruck D, Haerer W, Schmidt A. Pharmacokinetics and haemostatic status during consecutive infusion of recombinant tissue-type plasminogen activator in patients with acute myocardial infarction. Thromb Haemost. 1989;61:497–501. [PubMed] [Google Scholar]
- Senf L. A special case of diffusion with moving boundary. Int J Heat Mass Transfer. 1981;24:1903–5. [Google Scholar]
- Shaw GJ, Bavani N, Dhamija A, Lindsell CJ. Effect of mild hypothermia on the thrombolytic efficacy of 120 kHz ultrasound enhanced thrombolysis in an in-vitro human clot model. Thromb Res. 2006;117:603–8. doi: 10.1016/j.thromres.2005.05.005. [DOI] [PubMed] [Google Scholar]
- Soeki T, Tamura Y, Fukuda N, Ito S. Plasma and platelet plasminogen activator inhibitor-1 in patients with acute myocardial infarction. Japan Circ J. 2000;64:547–53. doi: 10.1253/jcj.64.547. [DOI] [PubMed] [Google Scholar]
- Stroke Trials Registry. The Internet Stroke Center: http://www.strokecenter.org/trials/
- Suchkova V, Siddiqi FN, Carstensen EL, Dalecki D, Child S, Francis CW. Enhancement of thrombolysis with 40 kHz ultrasound. Circulation. 1998;98:1030–5. doi: 10.1161/01.cir.98.10.1030. [DOI] [PubMed] [Google Scholar]
- Sund-Levander M, Forsberg C, Wahren LK. Normal oral, rectal, tympanic and axillary body temperature in adult men and women: a systematic literature review. Scand J Caring Sci. 2002;16:122–8. doi: 10.1046/j.1471-6712.2002.00069.x. [DOI] [PubMed] [Google Scholar]
- Tanne D, et al. Initial clinical experience with IV tissues plasminogen activator for acute ischemic stroke: a multicenter survey. The t-PA Stroke Survey Group. Neurol. 1999;53:424–7. doi: 10.1212/wnl.53.2.424. [DOI] [PubMed] [Google Scholar]
- Tanswell P, Seifried E, Stang E, Krause J. Pharmacokinetics and hepatic catabolism of tissue-type plasminogen activator. Arzneim-Forsch/Drug Res. 1991;12:1310–9. [PubMed] [Google Scholar]
- Tenenbaum M, Pollard H. Ordinary Differential Equations. New York: Dover; 1963. [Google Scholar]
- The National Institute of Neurologic Disorders and Stroke rt-PA Stroke Study Group. Tissue plasminogen activator for acute ischemic stroke. N Engl J Med. 1995;333:1581–7. doi: 10.1056/NEJM199512143332401. [DOI] [PubMed] [Google Scholar]
- Thompson DW, Furlan AJ. Clinical epidemiology of stroke. Neurol Clin. 1996;14:309–15. doi: 10.1016/s0733-8619(05)70258-9. [DOI] [PubMed] [Google Scholar]
- Tiefenbrunn AJ, Graor RA, Robison AK, Lucas FV, Hotchkiss A, Sobel BE. Pharmacodynamics of tissue-type plasminogen activator characterized by computer-assisted simulation. Circulation. 1986;73:1291–9. doi: 10.1161/01.cir.73.6.1291. [DOI] [PubMed] [Google Scholar]
- Trusen B, Ries M, Zenker M, Rauh M, Beinder E, Keuper H, Hamrs D. Whole blood clot lysis in newborns and adults after adding different concentrations of recombinant tissue plasminogen activator (Rt-PA) Semin Thromb Haemost. 1998;24:599–604. doi: 10.1055/s-2007-996060. [DOI] [PubMed] [Google Scholar]
- Wiman B, Collen D. On the kinetics of the reaction between human antiplasmin and plasmin. Eur J Biochem. 1978;84:573–8. doi: 10.1111/j.1432-1033.1978.tb12200.x. [DOI] [PubMed] [Google Scholar]
- Wu JH, Diamond SL. A fluorescence quench and dequench assay of fibrinogen polymerization, fibrinogenolysis, or fibrinolysis. Anal Biochem. 1995;224:83–91. doi: 10.1006/abio.1995.1011. [DOI] [PubMed] [Google Scholar]
- Yenari MA, Palmer JT, Bracci PM, Steinberg GK. Thrombolysis with tissue plasminogen activator (tPA) is temperature dependent. Thromb Res. 1995;77:475–81. doi: 10.1016/0049-3848(95)93883-2. [DOI] [PubMed] [Google Scholar]
- Zhang L, Zhang ZG, Zhang R, Morris D, Lu M, Coller BS, Chopp M. Adjuvant treatments with a glycoprotein IIb/IIIa inhibitor increases the therapeutic window for low-dose tissue plasminogen activator administration in a rat model of embolic stroke. Circulation. 2003;107:2837. doi: 10.1161/01.CIR.0000068374.57764.EB. [DOI] [PubMed] [Google Scholar]