Abstract
We have developed a semiautomated RNA sequence editor (SARSE) that integrates tools for analyzing RNA alignments. The editor highlights different properties of the alignment by color, and its integrated analysis tools prevent the introduction of errors when doing alignment editing. SARSE readily connects to external tools to provide a flexible semiautomatic editing environment. A new method, Pcluster, is introduced for dividing the sequences of an RNA alignment into subgroups with secondary structure differences. Pcluster was used to evaluate 574 seed alignments obtained from the Rfam database and we identified 71 alignments with significant prediction of inconsistent base pairs and 102 alignments with significant prediction of novel base pairs. Four RNA families were used to illustrate how SARSE can be used to manually or automatically correct the inconsistent base pairs detected by Pcluster: the mir-399 RNA, vertebrate telomase RNA (vert-TR), bacterial transfer-messenger RNA (tmRNA), and the signal recognition particle (SRP) RNA. The general use of the method is illustrated by the ability to accommodate pseudoknots and handle even large and divergent RNA families. The open architecture of the SARSE editor makes it a flexible tool to improve all RNA alignments with relatively little human intervention. Online documentation and software are available at http://sarse.ku.dk.
Keywords: RNA structural alignment, RNA secondary structure, SARSE
INTRODUCTION
The vast amount of available sequence data makes it necessary to use computational methods to generate RNA alignments and extract structural information. Both energy minimization and comparative sequence analysis have been used to deduce RNA secondary structure (Zuker and Stiegler 1981; Woese et al. 1983). Subsequently, methods using stochastic context-free grammars (SCFGs) (Eddy and Durbin 1994; Sakakibara et al. 1994) incorporated constraints of the biological system to improve the structure predictions. SCFG methods were extended to fold multiple RNA sequence alignments where phylogenetic information is incorporated explicitly (Knudsen and Hein 1999, 2003). An alternative method based on energy parameters and covariance scores was also introduced (Hofacker et al. 2002). An apparent paradox of these methods, which predict RNA structures from phylogenetic data, is that they require the alignment of sequences to be known in advance (Gorodkin et al. 1997).
An RNA alignment is easily constructed when the sequences are conserved but in many cases secondary structure features must be considered to align the variable regions. Methods for pairwise alignment of sequences using secondary structure features have been developed based on Sankoff's algorithm (Sankoff 1985): FOLDALIGN (Havgaard et al. 2005), PMcomp (Hofacker et al. 2004), and Dynalign (Mathews and Turner 2002; Mathews 2005). Also, SCFG procedures have been devised for pairwise alignment of RNA structure, such as Stemloc (Holmes and Rubin 2002; Holmes 2005). However, these methods are relatively calculation-expensive and thus applicable to only relatively small portions of the available data. Recently, improved methods for constructing a multiple alignment of RNA sequences have been introduced: RNAcast (Reeder and Giegerich 2005), CMfinder (Yao et al. 2006), and FoldalignM (Torarinsson et al. 2007). For a comparison of the various approaches, see Torarinsson et al. (2007).
Manual editing of sequence alignments by an expert gives the most reliable prediction of RNA secondary structures (for review, see Pace and Thomas 1999). By inspecting a multiple alignment, the expert can make corrections based on experimental data with close consideration of structure and function. To help in this task several sequence alignment editors are available, including DCSE (De Rijk and De Wachter 1993), Mview (Brown et al. 1998), SEQPUP (Gilbert 1999), BioEdit (Hall 2005), GDE (De Oliveira et al. 2003), Jalview (Clamp et al. 2004), Construct (Luck et al. 1999), ARB (Ludwig et al. 2004), RALEE (Griffiths-Jones 2005), and 4SALE (Seibel et al. 2006). Unfortunately, the majority of the programs are no longer supported or lack a simple way to incorporate existing or new tools, e.g., the RNAdbtools package (Gorodkin et al. 2001) and the Vienna package (Hofacker 2003).
Here, we present an approach to iteratively update structural RNA alignments based on a new editor, the semiautomated RNA sequence editor (SARSE), and a new algorithm, Pcluster, as an extension to the SARSE toolbox. Pcluster subgroups an alignment based on differences in secondary structure prediction by Pfold and was found to reveal misalignments, pseudoknots, and helix insertions/deletions. The Pcluster algorithm was used to investigate 574 alignments in the Rfam database (Griffiths-Jones et al. 2005). Using four different RNA families, we demonstrate how SARSE and Pcluster complement each other to reveal and correct alignment mistakes. SARSE, Pcluster, editing procedures, and evaluation measures are described in the Materials and Methods section.
RESULTS
Semiautomated RNA sequence editor
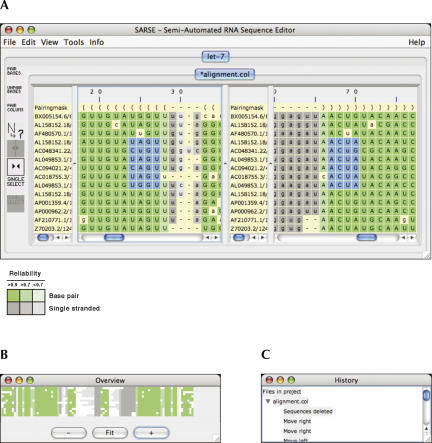
A semiautomated RNA sequence editor was developed in Java to allow the editing of RNA alignments. SARSE uses the conventions described for the tmRDB and SRPDB resources (Andersen et al. 2006). Lower case and upper case letters indicate single-stranded and base-paired regions, respectively, and a “pairing mask” designates the secondary structure of the alignment. Each sequence has an independent annotation of base pairs to allow structural differences within an alignment. The editor can be used to investigate the secondary structure assignment by selection of a base pair with a single click, and distant pairings can be observed simultaneously in split view (Fig. 1A). Colors are used to highlight secondary structure or other calculated features. As an example of such coloring, a Pfold prediction (Knudsen and Hein 2003) results in an alignment where different colors indicate base pair or single strand, and different shades are used to represent the prediction reliabilities (Fig. 1A, inset below). The overview window provides a zoomable representation of the colored alignment (Fig. 1B) and by mouse clicking provides interactive navigation of the editor window. The history window allows backtracking within the editing history (Fig. 1C).
FIGURE 1.
Semiautomated RNA sequence editor. (A) The editor window displays a Pfold secondary structure prediction of an alignment of let-7 miRNA sequences. The blue selection was made by the mouse in split view and shows how selection in the left panel automatically selects the corresponding bases in the right panel. Color code is given below the window: Colors indicate base pair or single-stranded. Shadings indicate the reliability of prediction. (B) The overview window can be interactively clicked to move the editor window to a specific alignment position. (C) The history window logs the editing manipulations and can be clicked to jump back in the iterative alignment procedure.
SARSE is easily extended with new programs. A program from the toolbox is activated from within SARSE, and the results of the request are loaded back into the editor. This toolbox relies on the communication with the Unix command line, and thus SARSE is distributed only for Linux and Mac OS X platforms. For this study, we used RNAdbtools (Gorodkin et al. 2001), Pfold (Knudsen and Hein 2003), Pcluster, and FoldalignM (Torarinsson et al. 2007). Further details about the use of the external tools are at the SARSE homepage (http://sarse.ku.dk).
Clustering based on secondary structure prediction
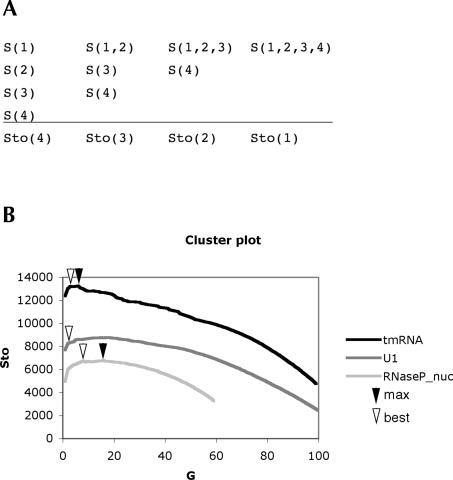
Pcluster was developed to allow the analysis of erroneous and structurally divergent alignments. The method uses the structure score, S, for clustering sequences into subgroups. S is defined as the sum of reliability values for all base-paired positions of a Pfold prediction multiplied by the number of sequences (see Materials and Methods). The clustering procedure proceeds by sorting the sequences of an alignment into subgroups based on obtaining the highest S score. To evaluate the clustering procedure, a total structure score, Sto, is calculated for each step of the clustering as the sum of the S scores of the subgroups (Fig. 2A). The Sto score will increase if the combined subgroups support each other in secondary structure prediction and decrease if they conflict in secondary structure prediction. Thus, subgroups with significant structural differences will be found in the decreasing part of the curve of Sto scores (Fig. 2B, curves, left side). We devised an automatic procedure to obtain the “best” subgrouping in the decreasing part of the curve that represents a tradeoff between defining structural differences and loss of prediction (see Materials and Methods). Pcluster allows other subgroupings to be investigated manually.
FIGURE 2.
Clustering and subgrouping of Rfam seed alignments. (A) Scheme showing the relation between the structure score, S, and the total structure score, Sto, during the clustering of four sequences. The S score is calculated from one Pfold prediction on one or more sequences, and the Sto score is the sum of S scores for a given subgrouping. The first step of clustering is done by doing Pfold prediction on all combinations of two sequences, and then choosing the combination with highest S score for further clustering. At last all sequences end up in one group. (B) The cluster plot shows the Sto scores versus the number of groups, G, obtained by the progressive clustering of alignment sequences from right to left. Cluster curve examples are shown from Rfam version 8.0 for the alignments U1, RNaseP_nuc, and tmRNA. The maximum Sto score is indicated by black arrowheads, and the “best” Sto score is indicated by open arrowheads.
Pcluster was used in an attempt to evaluate the 574 seed alignments of the Rfam database version 8.0 (Griffiths-Jones et al. 2005). The Rfam alignments were subjected to Pcluster analysis and 290 alignments were automatically subgrouped, indicating a loss of prediction during clustering of the alignment sequences (Fig. 2B, see examples). Visual inspection of the subgrouped alignments revealed possible misalignments (e.g., mir-399), pseudoknots (e.g., in tmRNA), and hairpin insert/deletions (e.g., in tRNA). Misalignments were observed as distinct subgroups. Pcluster recognized the two parts of a pseudoknot as different subgroups, since the Pfold algorithm is unable to predict pseudoknots (Knudsen and Hein 1999). Helix insertions were recognized as subgroups because Pcluster favors subgrouping of sequences with an extra structure feature.
Detection of structural inconsistency
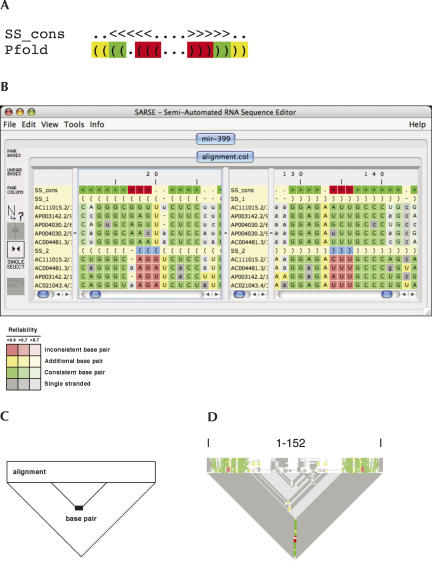
The predicted base pairs were classified as consistent, inconsistent, or novel by comparing the structural annotation obtained by Pcluster to the Rfam annotation of conserved secondary structure (Fig. 3A) and are easily spotted in SARSE by coloring of the alignment (Fig. 3B). To facilitate the inspection of Pcluster predictions, we developed the “alistem-plot” that in a rectangle plots a representation of the alignment (Fig. 1B, similar to the overview window) and in a triangle below plots the base-pairings (Fig. 3C). The plot provides an easy overview of the consistent, inconsistent, and novel base pairs in an alignment with different structural groups (Fig. 3D).
FIGURE 3.
Evaluating an alignment with subgroups. (A) The Rfam secondary structure consensus (SS_cons) is shown in bracket annotation with “<” and “>” indicating a base pair. The Pfold secondary structure prediction (Pfold) is shown in bracket annotation with “(” and “)” indicating a base pair. Each base pair of the Pfold secondary structure prediction is evaluated in relation to the Rfam SS_cons as consistent (green), inconsistent (red), or novel (yellow). (B) The SARSE editor window showing the mir-399 alignment with Rfam structure annotation (SS_cons) and two subgroups (SS_1 and SS_2). The evaluation shows that base pairs of one subgroup differ from the Rfam SS_cons (colored in red). The alignment is colored as indicated by the color code shown below the editor window, where the shading indicates the prediction reliability of a given base pair. (C) Schematics of the “alistem” plot. The rectangle is a representation of the alignment, and the triangle below is used to show base pair. (D) “Alistem” plot for the Pcluster-evaluated mir-399 alignment with alignment length shown above the plot.
To identify Rfam alignments as candidates for manual editing, we define scores for ranking prediction consistency, Sco, inconsistency, Sin, and novelty, Sno (see definitions in Materials and Methods). The three scores are calculated as follows: The Sco score sums only the prediction reliability of base pairs, when the assignment is equal to the Rfam assignment; Sin only sums over predicted base pairs that are incompatible with the Rfam assignment, that is, for a position in the two assignments with base pairs, where the base pair partner differs between the two structure assignments; the Sno score sums only when predicted base pairs are not coinciding with the Rfam structure annotation. The sum of the Sco, Sin, and Sno score equals the Sto score. Note that the scores depend both on the reliability of prediction and number of sequences. Of all Pcluster-predicted base pairs (weighed by prediction reliability) in the Rfam alignments, 75% are found to be consistent, 10% to be inconsistent, and 15% novel.
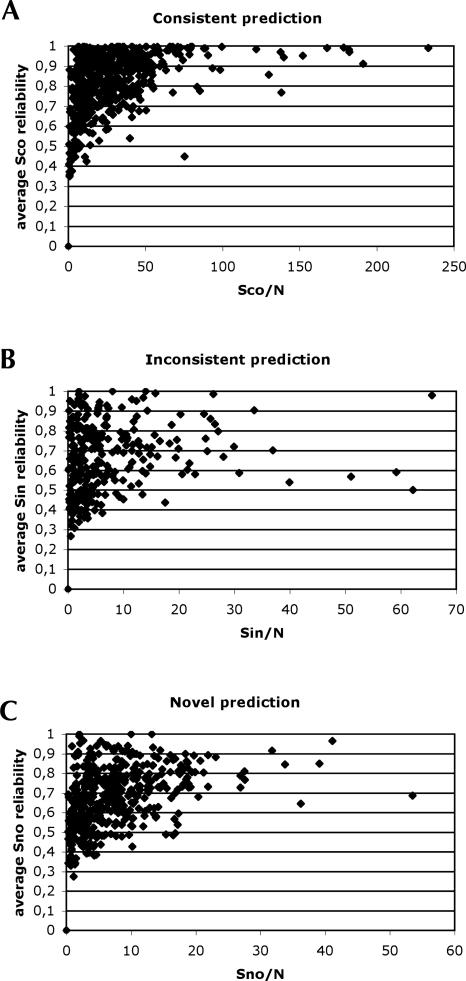
To find the Rfam alignments that need to be corrected in SARSE, we evaluate the amount of score per sequence and the average reliability of the prediction for the Sco, Sin, and Sno scores (Fig. 4A–C). Because the Rfam database contains many small alignments (403 alignments have ≤10 sequences), the reliability of predictions is expected to be low since they contain little phylogeny to support Pfold predictions. Also, the Pcluster subgrouping of the alignments makes less phylogenetic support available for predictions. To find the alignments that have the most significant inconsistent and novel predictions we calculate the average reliability (P av) for each category of consistent, inconsistent, and novel prediction and partition the alignments in three average reliability groups: high (P av ≥ 0.8), medium (0.8 > P av ≥ 0.6), and low (P av < 0.6). Of the high average reliability predictions we found that 319 alignments were consistent, 71 were inconsistent, and 102 were novel. Thirty-three alignments contained both inconsistent and novel predictions of high average reliability. This showed that 11% of all Rfam alignments should be investigated for misalignment or inconsistent structure annotation and 18% should be considered to have extended structure annotation. The medium reliability predictions should also be investigated, since they might contain a mixture of high- and low-reliability predictions. The ranking lists of consistent, inconsistent, and novel predictions can be found at http://sarse.ku.dk/Rfam_sarse/.
FIGURE 4.
Evaluation of Pcluster prediction in relation to Rfam structure annotation. (A) The consistent structure score, Sco, per sequence, N, of an alignment is plotted against the average reliability of the predicted base pairs that are consistent with the Rfam structure annotation. (B,C) Similar plots for the inconsistent structure score, Sin, and the novel structure score, Sno.
We investigated the high-reliability inconsistent prediction ranked by the Sin score per sequence (available at http://sarse.ku.dk/Rfam_sarse/sin.html). The “RNaseP_bact_a” alignment obtained the highest score, which was caused by errors in the Rfam structure annotation. The “S-element” and “K_chan_RES” alignments are examples of another type of high scoring alignments, where the Pfold predicted structures were significantly different from the Rfam structure annotation. The majority of the subgrouped Rfam alignments were only partially inconsistent and, as judged by the Pfold reliability scores, likely to be real misalignments (examples are given below). The alignments with novel prediction of high reliability were evaluated by ranking the Sno score per sequence (available at http://sarse.ku.dk/Rfam_sarse/sno.html). Several alignments with missing annotation were identified. Of notable examples were “Intron_gpI,” which had an unannotated structural insert for a large subgroup of sequences, and “SSU_rRNA_5”, with an unannotated helix. Taken together, the Pcluster analysis revealed numerous inconsistencies and novel base pairs, and the ranking isolated a significant number of errors for further investigation.
Correcting alignment inconsistencies
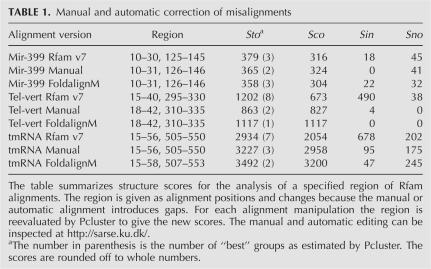
Four RNA families are chosen to demonstrate the usefulness of SARSE and Pcluster in generating higher-quality RNA alignments: (1) mir-399 RNA; (2) vertebrate telomerase RNA (vert-TR); (3) tmRNA; and (4) SRP RNA. Alignments 1–3 are from Rfam version 7.0 to show severe cases of misalignment (Rfam version 8.0 has updated alignments 2 and 3). Alignment 4 is from the SRPDB resource and was used as an example of a large and structurally divergent RNA family. The following editing procedure is used: (1) Pcluster is run on the full alignment; (2) regions of inconsistency are spotted and evaluated by Pcluster; (3) the alignment is edited manually or automatically by Foldalignm; and (4) Pcluster is used to evaluate the improvement in structural alignment quality observed as an increase in Sto score (compared in Table 1). The editing projects can be downloaded at http://sarse.ku.dk/Rfam_sarse/, and the files inspected in the project directory or in the SARSE editor using the history window.
TABLE 1.
Manual and automatic correction of misalignments
Mir-399
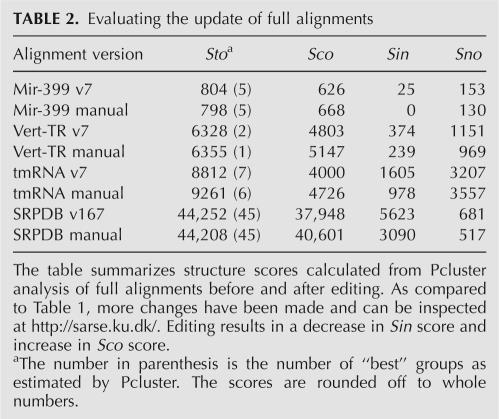
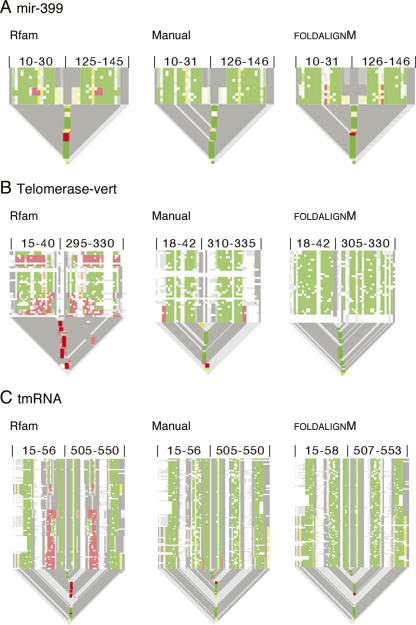
Pcluster analysis of the Rfam “mir-399” alignment gave rise to five subgroups with 3% of the predictions being inconsistent with the Rfam structure annotation (Table 2). The inconsistent base pairs are located at the center of the miRNA helix for a subset of the sequences (Fig. 3D). Pcluster analysis of the misaligned region (positions 10–30 and 125–145) resulted in three subgroups with one subgroup containing a misalignment (Fig. 5A, Rfam). An extra column was inserted at position 17 and the inconsistent bases were moved to overlap with base pairs of the two other subgroups, and reevaluation by Pcluster gave no inconsistent base pairs (Fig. 5B, Manual). FoldalignM was used in an attempt to automatically align the inconsistency (positions 15–25 and 129–138) but reevaluation by Pcluster indicated an alternative alignment (Fig. 5A, FoldalignM), and thus Pcluster and FoldalignM do not seem to agree on this editing. Pcluster analysis of the full manually edited alignment resulted in five subgroups with 84% consistent and no inconsistent prediction (Table 2). Pcluster continued to subgroup the alignment due to divergent structure outside the Rfam annotation corresponding to 16% of the prediction. The alignment without subgroups had an increase in Sto score (Table 2), demonstrating that the editing improved the quality of the structural alignment.
TABLE 2.
Evaluating the update of full alignments
FIGURE 5.
Detection and editing of structural alignment errors. (A–C) Region-specific “alistem”-plots are shown for Rfam version 7.0, the manually edited version, and the FoldalignM edited version. Alignment positions are indicated above each “alistem” plot and the base pairs are colored as in Fig. 3B. The “alistem”-plots are direct representations of the real alignment, which can be downloaded at http://sarse.ku.dk and inspected in SARSE. The “alistem” plots for the full alignment can be investigated in more details at http://sarse.ku.dk.
Vert-TR
Vertebrate telomerase RNA has three major domains, one of which contains a pseudoknot (Fragnet et al. 2005). Pcluster analysis of the Rfam “Telomerase-vert” seed alignment generated two subgroups with 6% of the prediction being inconsistent and 18% outside of the Rfam structure annotation (Table 2). Investigation of a plot of the prediction (available at http://sarse.ku.dk/Rfam_sarse/sin.html) shows that stem 1 has inconsistent base pairs and is not predicted for one group. Clustering of this region (positions 15–40 and 295–330) resulted in eight subgroups with 41% of the prediction being inconsistent (Fig. 4B, Rfam; Table 1). Editing results in a decrease of inconsistency to 4% (Fig. 5B, Manual; Table 1). Using FoldalignM for automatic alignment of the region (positions 18–39 and 300–327) results in a fully consistent alignment (Fig. 5B, FoldalignM). Evaluation of the full alignment by Pcluster then gave rise to one subgroup and an increase in Sto score (Table 2).
tmRNA
The tmRNA was used as an example of the analysis of a structural alignment with pseudoknots (Williams and Bartel 1996). The large amount of sequences in the Rfam seed alignment was reduced (see Materials and Methods) and Pcluster analysis gave rise to six subgroups with 18% of the prediction being inconsistent and 36% being novel base pairs (Table 2). The high amount of novel base pairs was present since only one side of the pseudoknots was annotated in Rfam version 7.0. Interestingly, the pseudoknots were observed as crossing base pairs between subgroups, and several misalignments were observed both in helix 2 and in the region of the four pseudoknots (see the plot at http://sarse.ku.dk/Rfam_sarse/sin.html). Helix 2 was analyzed by Pcluster (positions 15–56 and 505–550), which showed that 23% of its prediction was misaligned in this region (Fig. 5C, Rfam; Table 1). This was corrected to decrease the inconsistency to 3% (Fig. 5C, Manual; Table 1). Automatic alignment was done for the region (positions 40–50 and 520–550) and resulted in only 1% inconsistency as evaluated by Pcluster (Fig. 5C, FoldalignM; Table 1). Pcluster analysis was performed individually for the eight stems of the four pseudoknots, and the detected misalignments are corrected using SARSE to obtain an increased Sto score (Table 2).
SRP RNA
To demonstrate an example of insertion and deletion of helices, we used the SRP RNA alignment from the SRPDB resource (Andersen et al. 2006). In comparison, the Rfam alignments “SRP_euk_arch” and “SRP_bact” contained only a fraction of the divergent SRP structures known. Since the SRPDB alignment was too large for Pcluster analysis (385 sequences and 983 alignment positions), we manually divided the SRP RNA alignment into 17 subgroups according to phylogeny and sequence length. Pcluster analysis of each subgroup individually gave rise to a total of 45 subgroups. Evaluating the predicted base pairs in relation to the structure annotation from the SRPDB resource we measured, 86% of all predicted base pairs were consistent with the original assignment, 13% were inconsistent, and 2% were not assigned previously (Table 2). Visualizing the inconsistent base pairs with SARSE, we observed that high-reliability inconsistencies were due to annotation problems and alignment mistakes. After the corrections we were able to decrease the inconsistent base pairs to 7% (now available at http://genome.ku.dk/resources/srpdb; Table 2).
We conclude that structural misalignments can be detected and corrected with relatively little effort using Pcluster for evaluation and SARSE for editing. In addition, the manual editing done in response to the Pcluster subgrouping can, in most cases, be substituted by automatic editing by Foldalignm. The positive effect of editing on the quality of the alignments can be evaluated by Pcluster to give an increased Sto score, decrease in Sin score, and the appearance of fewer subgroups, overall indicating stronger support between the sequences of the alignment.
DISCUSSION
The SARSE program was developed to allow not only for the basic functions required for editing of RNA structural alignments, but also for simple integration of auxiliary tools. Whereas the SARSE Java applet is platform independent, the analysis programs in the toolbox depend on communication with the Unix command line. Thus, the full SARSE package is distributed for Linux and Mac OS X computers only. An important feature of SARSE is that it makes alignment editing reproducible, since the editor logs the editing history, thus making it possible for other researchers to inspect changes and updates made to an alignment.
For the current study, we developed tools for detecting alignment inconsistencies and either manually or automatically correcting them. The user can easily customize SARSE by adding new programs and constructing new analysis pipelines. The editor uses the column format (Gorodkin et al. 2001) and can load any type and number of columns. Thus, SARSE is flexible as to the information attached to each alignment position and is ready to incorporate, e.g., 3D structural information for alignment analysis. The column format can easily be converted to other relevant formats by scripts in the RNAdbtool package (Gorodkin et al. 2001) and new format converter scripts can be made for, e.g., the RNAML format (Waugh et al. 2002).
Pfold was used as the basic algorithm for RNA structure prediction in this study. It had earlier been found that the Pfold parameters are applicable over a broad range of evolutionary rates as tested by the example of the rapidly evolving retrovirus HIV-1 (Knudsen et al. 2004). Thus, we believe that Pfold is suitable for the broad analysis presented here of all the RNA alignments of the Rfam database. During the study it was found that a current implementation of the Pfold prediction algorithm broke down for some alignment (especially large alignments). However, for this study the updated version of Pfold did not break down. This problem has also been noted by others (Gardner and Giegerich 2004).
Pcluster uses Pfold predictions as the means of clustering the sequences of an alignment into structural groups. The current study shows that this can be used as a method to detect alignment inconsistencies. The detection of alignment inconsistencies depends on choosing a subgrouping based on the clustering, and the “best” subgrouping devised in this study might not be optimal in all cases. By Pcluster it is possible to inspect all subgroupings made during the clustering. Another subgrouping procedure might be based on a direct measurement of the amount of inconsistency during clustering. The calculation speed of the Pcluster algorithm is a problem for interactive editing and evaluation. The amount of sequences causes the analysis to slow down since many combinations of sequences have to be predicted by Pfold. In the current study we limited the amount of sequences to 100 but this is still too slow for interactive editing. By doing an initial subgrouping based on sequence identity, the Pcluster algorithm could work significantly faster. The secondary structure prediction algorithm used in this study was Pfold (Knudsen and Hein 2003) but could be replaced by, e.g., RNAalifold (Hofacker et al. 2002), which also assigns structure scores for the individual alignment positions. The clustering procedure could also be based on base-pair geometry information for structural alignments with RNA motifs (Leontis et al. 2002; Lescoute et al. 2005).
The Rfam database was used as the subject of analysis to show the broad applicability of the tools, and a general procedure for the update of structural alignment quality was devised. The Pcluster analysis of Rfam version 8.0 alignments showed that 10% of the predicted base pairs were inconsistent and 12% were unannotated as compared to the Rfam structure annotation. Taking only the most reliable predictions of inconsistent and novel base pairs, we found that 11% of all Rfam alignments should be investigated for misalignment or inconsistent structure annotation and 18% should be considered to have extended structure annotation. For Rfam version 7.0 examples were provided to show that the detected inconsistencies were real misalignments. Since the clustering of a large alignment is based on effects from many structural elements, specific regions were chosen as the subject of an additional Pcluster analysis. This provides a region-specific clustering that is optimal for editing. Several examples were shown where manual editing and automatic editing could significantly improve the structural alignment in the region. It was also shown that manual and automatic subgrouping could be combined to analyze large and divergent alignments for structural misalignments. Given the advantages gained by the subgrouping of the aligned sequences within a larger RNA family, we suggest that each structurally divergent subgroup should be treated as an individual seed that is part of a larger family. We also suggest that Pcluster analysis provides an indication of the quality of the Rfam database and the inconsistent base-pair assignments are expected to decrease in future versions as structural alignments are constructed according to higher-order structural information (Leontis et al. 2002; Lescoute et al. 2005). We thus provide a ranking of Rfam alignments on the SARSE homepage (http://sarse.ku.dk/Rfam_sarse/sin.html). The evaluation scheme presented here will become more efficient as more sequences arrive for each RNA family.
In conclusion, we have developed an RNA alignment editor with an open architecture that is suitable for adding established and new tools, and is capable of improving the quality of even the most challenging RNA alignments.
MATERIALS AND METHODS
Data retrieval
The alignments of the Rfam database versions 7.0 and 8.0 were retrieved as Rfam flat files containing annotated Rfam seed alignments (http://www.sanger.ac.uk/Software/Rfam/). The secondary structure mask (SS_cons) was used for comparison with the predictions. The Rfam seed was extracted to generate individual files, placed into separate alignment directories, and the 21 largest alignments were reduced by sequence similarity using the Hobohm algorithm (Hobohm et al. 1992). The cutoff value of the Hobohm algorithm was tuned to reduce the alignment to 70–100 sequences. The SARSE and Pcluster analyses were performed inside each alignment directory. The curated alignment of the signal recognition particle (SRP) RNA was retrieved from the SRPDB resource (http://genome.ku.dk/resources/srpdb). The full SRP alignment was subgrouped by phylogeny and sequence length.
SARSE: RNA alignment editing and analysis
To allow for efficient editing of RNA structural alignments, a semiautomated RNA sequence editor was implemented in Java (version 1.5) with a user-friendly graphical front-end. Other programs can be integrated by describing executable scripts into an XML file. SARSE allows the merging of several programs into a pipeline. For this study, the pipeline scripts for Pfold, Pcluster, and Foldalignm were constructed, which, apart from running the core algorithms, create plots and output files in the working directory. A special pipe was used for folding of groups of sequences such that Pfold was able to use the output of Pcluster. This was widely used to facilitate the iterative procedure for generating RNA structural alignments. The main data format of the editor was the column format (http://genome.ku.dk/resources/colformat) as this format easily integrates communication between the applied programs. It is also possible to read and write fasta and widetext formats (used in the SRPDB and tmRDB resources). Other formats can be readily generated using the format converters of the RNAdbtools package (http://genome.ku.dk/resources/rnadbtool). In addition we included Foldalignm to construct multiple structural RNA alignments of unaligned sequences (Torarinsson et al. 2007). The basic editor functionalities of SARSE have successfully been applied to curate existing RNA structural databases, SRPDB and tmRDB (Andersen et al. 2006).
Pcluster: Clustering RNA sequences based on secondary structure
In a multiple RNA alignment, there may be sequences that disrupt the Pfold secondary structure prediction for two reasons: poor alignment or variations in structure. These problems may in part be solved by splitting the sequences into smaller groups for which both the structures and the alignments are consistent. Consequently, alignment errors may become apparent and can be corrected. Here, a method is described that clusters RNA sequences into such groups according to structure without generating new alignments.
To cluster the sequences of an alignment, we chose to evaluate the secondary structure prediction of a subgroup, g, of n sequences by the structure score
 |
where i is the alignment position, and L is the length of the alignment. Pd(i,g) is the Pfold reliability of the double-stranded position i in group g. The S(g) score is used for clustering by the following iterative procedure: (1) Let each sequence form its own subgroup. (2) Calculate the S(g) score of all possible pairs of subgroups. (3) Join the two subgroups with the highest S(g) score. (4) Go back to step 2. This will produce a clustering of the sequences into subgroups. The last clustering will have all the sequences in the same group.
Next, we evaluated the clustering, and for each step of the clustering procedure we calculated the total score, Sto, as the sum of the scores of the individual groups
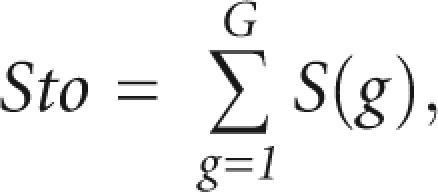 |
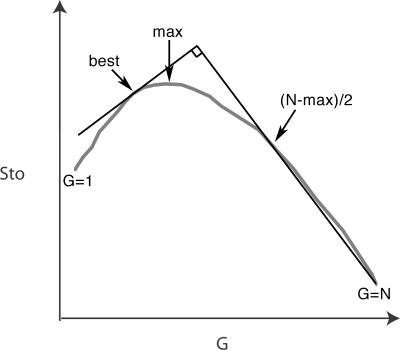
where G is the number of subgroups in the alignment. The Sto score will increase when the combined subgroups have similar structures, and decrease when the combined subgroups have different structures. We were interested in finding the subgroups that have different structure and, thus, needed to subgroup the alignment where the Sto score decreased. We devised the following automatic procedure to find a point between the maximum of the total score, Sto(max), and the score for the full alignment, Sto(1): On the plot of Sto score versus number of subgroups, we found the slope from the point at Sto(N) to the point that was halfway to Sto(max), where N is the number of sequences in the alignment and max is the number of groups with maximum score (Fig. 6). Sto(best) is found by multiplying the slope by −1 and finding the point where it tangents the graph on the left side (Fig. 6).
FIGURE 6.
Finding the “best” structural subgrouping. The clustering curve is plotted as total structure score (Sto) versus number of groups (G). The best subgrouping is found by finding the slope from the point at Sto(N) to the point that is halfway to the maximum Sto score, where N is the number of sequences in the alignment. The “best” subgroping is found by multiplying the slope by −1 and finding the point where it tangents the graph on the left side.
Evaluating alignments with subgroups
The structure prediction of a subgrouped alignment is evaluated in relation to the Rfam structure annotation, and the predicted base pairs can be consistent, inconsistent, or novel (Fig. 3A). We define scores for evaluating consistency, Sco, inconsistency, Sin, and novelty, Sno. They are computed in a similar way as the total score, Sto, but with a conditional parameter that compares Rfam with the Pcluster assignments. As an example we find the Sin score by
 |
where the conditional parameter, Bin(Rfam,g), is 1 if either the left or right base coincides with the Rfam assignment but the partner does not, and zero if not. The Sco score only sums if the assignments are consistent. The Sno score sums base pairs that are not coinciding with the Rfam pairing mask. The evaluation scores add up to the Sto score:
The scores were used for ranking the Rfam alignments (available at http://sarse.ku.dk/Rfam_sarse/).
Editing of alignment errors
Alignments were further investigated in the SARSE editor to find evidence for an alignment error. In some cases the specific region containing the alignment errors was reanalyzed by Pcluster to generate subgroups that were only dependent on a particular alignment mistake by specifying the questionable region in the Pcluster settings. Finally, SARSE was used to align the subgroups according to their structure prediction. Alternatively, the FoldalignM–McCaskill program was used to automatically align the inconsistencies. To allow single stems of a larger alignment to be aligned, it was made possible to specify a region in the following way: The region was cut out and subjected to FoldalignM–McCaskill analysis. If a region consisted of two parts, then the FoldalignM output was separated into two files by reference to the input sequences. Finally, the full alignment was reassembled. The Rfam pairing mask was added and adjusted to fit the Foldalignm pairing mask manually. The new alignment was evaluated with Pcluster to compare the Sto scores before and after the editing.
ACKNOWLEDGMENTS
We thank Jody Burks for useful comments on SARSE. This work was supported by the Danish Research Councils FNU and FTP, the Ministry of Food, Agriculture and Fisheries, the Danish Center for Scientific Computation, and the Danish National Research Foundation.
Footnotes
Article published online ahead of print. Article and publication date are at http://www.rnajournal.org/cgi/doi/10.1261/rna.215407.
REFERENCES
- Andersen, E.S., Rosenblad, M.A., Larsen, N., Westergaard, J.C., Burks, J., Wower, I.K., Wower, J., Gorodkin, J., Samuelsson, T., Zwieb, C. The tmRDB and SRPDB resources. Nucleic Acids Res. 2006;34:D163–D168. doi: 10.1093/nar/gkj142. [DOI] [PMC free article] [PubMed] [Google Scholar]
- Brown, N.P., Leroy, C., Sander, C. MView: A web-compatible database search or multiple alignment viewer. Bioinformatics. 1998;14:380–381. doi: 10.1093/bioinformatics/14.4.380. [DOI] [PubMed] [Google Scholar]
- Clamp, M., Cuff, J., Searle, S.M., Barton, G.J. The Jalview Java alignment editor. Bioinformatics. 2004;20:426–427. doi: 10.1093/bioinformatics/btg430. [DOI] [PubMed] [Google Scholar]
- De Oliveira, T., Miller, R., Tarin, M., Cassol, S. An integrated genetic data environment (GDE)-based LINUX interface for analysis of HIV-1 and other microbial sequences. Bioinformatics. 2003;19:153–154. doi: 10.1093/bioinformatics/19.1.153. [DOI] [PubMed] [Google Scholar]
- De Rijk, P., De Wachter, R. DCSE, an interactive tool for sequence alignment and secondary structure research. Comput. Appl. Biosci. 1993;9:735–740. doi: 10.1093/bioinformatics/9.6.735. [DOI] [PubMed] [Google Scholar]
- Eddy, S.R., Durbin, R. RNA sequence analysis using covariance models. Nucleic Acids Res. 1994;22:2079–2088. doi: 10.1093/nar/22.11.2079. [DOI] [PMC free article] [PubMed] [Google Scholar]
- Fragnet, L., Kut, E., Rasschaert, D. Comparative functional study of the viral telomerase RNA based on natural mutations. J. Biol. Chem. 2005;280:23502–23515. doi: 10.1074/jbc.M501163200. [DOI] [PubMed] [Google Scholar]
- Gardner, P.P., Giegerich, R. A comprehensive comparison of comparative RNA structure prediction approaches. BMC Bioinformatics. 2004;5:140. doi: 10.1186/1471-2105-5-140. [DOI] [PMC free article] [PubMed] [Google Scholar]
- Gilbert, D. SeqPup version 0.9. 1999 http://iubio.bio.indiana.edu/soft/molbio/seqpup/java/seqpup-doc.html
- Gorodkin, J., Heyer, L.J., Stormo, G.D. Finding the most significant common sequence and structure motifs in a set of RNA sequences. Nucleic Acids Res. 1997;25:3724–3732. doi: 10.1093/nar/25.18.3724. [DOI] [PMC free article] [PubMed] [Google Scholar]
- Gorodkin, J., Zwieb, C., Knudsen, B. Semi-automated update and cleanup of structural RNA alignment databases. Bioinformatics. 2001;17:642–645. doi: 10.1093/bioinformatics/17.7.642. [DOI] [PubMed] [Google Scholar]
- Griffiths-Jones, S. RALEE–RNA ALignment editor in Emacs. Bioinformatics. 2005;21:257–259. doi: 10.1093/bioinformatics/bth489. [DOI] [PubMed] [Google Scholar]
- Griffiths-Jones, S., Moxon, S., Marshall, M., Khanna, A., Eddy, S.R., Bateman, A. Rfam: Annotating noncoding RNAs in complete genomes. Nucleic Acids Res. 2005;33:D121–D124. doi: 10.1093/nar/gki081. [DOI] [PMC free article] [PubMed] [Google Scholar]
- Hall, T.A. BioEdit version 7.0.5. 2005 http://www.mbio.ncsu.edu/BioEdit/bioedit.html
- Havgaard, J.H., Lyngso, R.B., Stormo, G.D., Gorodkin, J. Pairwise local structural alignment of RNA sequences with sequence similarity less than 40% Bioinformatics. 2005;21:1815–1824. doi: 10.1093/bioinformatics/bti279. [DOI] [PubMed] [Google Scholar]
- Hobohm, U., Scharf, M., Schneider, R., Sander, C. Selection of representative protein data sets. Protein Sci. 1992;1:409–417. doi: 10.1002/pro.5560010313. [DOI] [PMC free article] [PubMed] [Google Scholar]
- Hofacker, I.L. Vienna RNA secondary structure server. Nucleic Acids Res. 2003;31:3429–3431. doi: 10.1093/nar/gkg599. [DOI] [PMC free article] [PubMed] [Google Scholar]
- Hofacker, I.L., Fekete, M., Stadler, P.F. Secondary structure prediction for aligned RNA sequences. J. Mol. Biol. 2002;319:1059–1066. doi: 10.1016/S0022-2836(02)00308-X. [DOI] [PubMed] [Google Scholar]
- Hofacker, I.L., Bernhart, S.H., Stadler, P.F. Alignment of RNA base pairing probability matrices. Bioinformatics. 2004;20:2222–2227. doi: 10.1093/bioinformatics/bth229. [DOI] [PubMed] [Google Scholar]
- Holmes, I. Accelerated probabilistic inference of RNA structure evolution. BMC Bioinformatics. 2005;6:73. doi: 10.1186/1471-2105-6-73. [DOI] [PMC free article] [PubMed] [Google Scholar]
- Holmes, I., Rubin, G.M. Pairwise RNA structure comparison with stochastic context-free grammars. Pac. Symp. Biocomput. 2002;7:163–174. doi: 10.1142/9789812799623_0016. [DOI] [PubMed] [Google Scholar]
- Knudsen, B., Hein, J. RNA secondary structure prediction using stochastic context-free grammars and evolutionary history. Bioinformatics. 1999;15:446–454. doi: 10.1093/bioinformatics/15.6.446. [DOI] [PubMed] [Google Scholar]
- Knudsen, B., Hein, J. Pfold: RNA secondary structure prediction using stochastic context-free grammars. Nucleic Acids Res. 2003;31:3423–3428. doi: 10.1093/nar/gkg614. [DOI] [PMC free article] [PubMed] [Google Scholar]
- Knudsen, B., Andersen, E.S., Damgaard, C., Kjems, J., Gorodkin, J. Evolutionary rate variation and RNA secondary structure prediction. Comput. Biol. Chem. 2004;28:219–226. doi: 10.1016/j.compbiolchem.2004.04.001. [DOI] [PubMed] [Google Scholar]
- Leontis, N.B., Stombaugh, J., Westhof, E. The non-Watson-Crick base pairs and their associated isostericity matrices. Nucleic Acids Res. 2002;30:3497–3531. doi: 10.1093/nar/gkf481. [DOI] [PMC free article] [PubMed] [Google Scholar]
- Lescoute, A., Leontis, N.B., Massire, C., Westhof, E. Recurrent structural RNA motifs, Isostericity Matrices and sequence alignments. Nucleic Acids Res. 2005;33:2395–2409. doi: 10.1093/nar/gki535. [DOI] [PMC free article] [PubMed] [Google Scholar]
- Luck, R., Graf, S., Steger, G. ConStruct: A tool for thermodynamic controlled prediction of conserved secondary structure. Nucleic Acids Res. 1999;27:4208–4217. doi: 10.1093/nar/27.21.4208. http://nar.oxfordjournals.org/content/vol27/issue21/index.dtl [DOI] [PMC free article] [PubMed]
- Ludwig, W., Strunk, O., Westram, R., Richter, L., Meier, H., Yadhukumar,, Buchner, A., Lai, T., Steppi, S., Jobb, G., et al. ARB: A software environment for sequence data. Nucleic Acids Res. 2004;32:1363–1371. doi: 10.1093/nar/gkh293. [DOI] [PMC free article] [PubMed] [Google Scholar]
- Mathews, D.H. Predicting a set of minimal free energy RNA secondary structures common to two sequences. Bioinformatics. 2005;21:2246–2253. doi: 10.1093/bioinformatics/bti349. [DOI] [PubMed] [Google Scholar]
- Mathews, D.H., Turner, D.H. Dynalign: An algorithm for finding the secondary structure common to two RNA sequences. J. Mol. Biol. 2002;317:191–203. doi: 10.1006/jmbi.2001.5351. [DOI] [PubMed] [Google Scholar]
- Pace, N.R., Thomas, B.C. Probing RNA structure, function, and history by comparative analysis. In: Gesteland R.F., et al., editors. RNA World. 2d ed. Cold Spring Harbor Laboratory Press; Cold Spring Harbor, NY: 1999. pp. 113–141. [Google Scholar]
- Reeder, J., Giegerich, R. Consensus shapes: An alternative to the Sankoff algorithm for RNA consensus structure prediction. Bioinformatics. 2005;21:3516–3523. doi: 10.1093/bioinformatics/bti577. [DOI] [PubMed] [Google Scholar]
- Sakakibara, Y., Brown, M., Hughey, R., Mian, I.S., Sjolander, K., Underwood, R.C., Haussler, D. Stochastic context-free grammars for tRNA modeling. Nucleic Acids Res. 1994;22:5112–5120. doi: 10.1093/nar/22.23.5112. [DOI] [PMC free article] [PubMed] [Google Scholar]
- Sankoff, D. Simultaneous solution of the RNA folding, alignment and protosequence problems. SIAM J. Appl. Math. 1985;45:810–825. [Google Scholar]
- Seibel, P.N., Muller, T., Dandekar, T., Schultz, J., Wolf, M. 4SALE—A tool for synchronous RNA sequence and secondary structure alignment and editing. BMC Bioinformatics. 2006;7:498. doi: 10.1186/1471-2105-7-498. [DOI] [PMC free article] [PubMed] [Google Scholar]
- Torarinsson, E., Havgaard, J.H., Gorodkin, J. Multiple structural alignment and clustering of RNA sequences. Bioinformatics. 2007;23:926–932. doi: 10.1093/bioinformatics/btm049. [DOI] [PubMed] [Google Scholar]
- Waugh, A., Gendron, P., Altman, R., Brown, J.W., Case, D., Gautheret, D., Harvey, S.C., Leontis, N., Westbrook, J., Westhof, E., et al. RNAML: A standard syntax for exchanging RNA information. RNA. 2002;8:707–717. doi: 10.1017/s1355838202028017. [DOI] [PMC free article] [PubMed] [Google Scholar]
- Williams, K.P., Bartel, D.P. Phylogenetic analysis of tmRNA secondary structure. RNA. 1996;2:1306–1310. [PMC free article] [PubMed] [Google Scholar]
- Woese, C.R., Gutell, R., Gupta, R., Noller, H.F. Detailed analysis of the higher-order structure of 16S-like ribosomal ribonucleic acids. Microbiol. Rev. 1983;47:621–669. doi: 10.1128/mr.47.4.621-669.1983. [DOI] [PMC free article] [PubMed] [Google Scholar]
- Yao, Z., Weinberg, Z., Ruzzo, W.L. CMfinder—A covariance model based RNA motif finding algorithm. Bioinformatics. 2006;22:445–452. doi: 10.1093/bioinformatics/btk008. [DOI] [PubMed] [Google Scholar]
- Zuker, M., Stiegler, P. Optimal computer folding of large RNA sequences using thermodynamics and auxiliary information. Nucleic Acids Res. 1981;9:133–148. doi: 10.1093/nar/9.1.133. [DOI] [PMC free article] [PubMed] [Google Scholar]


