

Abstract
Background
Chronically critically ill patients often have high costs of care and poor outcomes and thus might benefit from a disease management program.
Objectives
To evaluate how adding a disease management program to the usual care system affects outcomes after discharge from the hospital (mortality, health-related quality of life, resource use) in chronically critically ill patients.
Methods
In a prospective experimental design, 335 intensive care patients who received more than 3 days of mechanical ventilation at a university medical center were recruited. For 8 weeks after discharge, advanced practice nurses provided an intervention that focused on case management and interdisciplinary communication to patients in the experimental group.
Results
A total of 74.0% of the patients survived and completed the study. Significant predictors of death were age (P = .001), duration of mechanical ventilation (P = .001), and history of diabetes (P = .04). The disease management program did not have a significant impact on health-related quality of life; however, a greater percentage of patients in the experimental group than in the control group had “improved” physical health-related quality of life at the end of the intervention period (P = .02). The only significant effect of the intervention was a reduction in the number of days of hospital readmission and thus a reduction in charges associated with readmission.
Conclusion
The intervention was not associated with significant changes in any outcomes other than duration of readmission, but the supportive care coordination program could be provided without increasing overall charges.
The continued increase in healthcare costs in the United States has been well documented1,2; healthcare costs exceed $1 trillion.3 Reasons cited for the rise in costs include the increasing number of elderly persons, increases in severity of illness, and the increasing number of patients who require prolonged mechanical ventilation and expensive stays in intensive care units (ICUs).1,4,5 Patients who require prolonged mechanical ventilation and expensive ICU stays are generally more than 60 years old, have more than a single comorbid condition (eg, coronary artery disease, chronic pulmonary disease), and have high in-hospital mortality rates (35%-50%).6-8 These patients have a high cost of care as well as poor outcomes and have been called “chronically critically ill.”8-10 Poor outcomes include poor quality of life, high mortality, need for individualized rehabilitation, high readmission rates, and high cost of care.8-10
Disease management programs (DMPs) improve patients’ outcomes while reducing the cost of care for chronically ill patients11,12 and patients with congestive heart failure,13 yet only a few reports of large randomized trials of the effectiveness of such programs have been published, and even fewer have had health-related quality of life (HRQOL) as a key outcome measure.14-16 HRQOL is an important outcome to include in studies on the effect of DMPs because patients often place a higher value on quality of life than on survival.17
Evaluating the effect of a disease management program on quality of life is important because patients often place a higher value on quality of life than on survival.
Chronically critically ill patients present challenges for the healthcare teams who assume responsibility for their care after discharge from the hospital and thus may benefit from a DMP. Staff and primary care physicians at extended care facilities are faced with the challenge of quickly gaining familiarity with a patient’s history and course of illness, coordinating the continuing input from multiple healthcare providers, and assuming responsibility for managing these complex cases.
To date, the effect of using a DMP intervention focused on chronically critically ill patients after they leave the hospital has not been evaluated. The purpose of our study was to evaluate how adding a DMP to the usual care system affected outcomes after discharge (mortality, HRQOL, resource use) in chronically critically ill patients 2 months after discharge. The theoretical basis of the study was an application of the “structure-process-outcomes” model of Donabedian,18 which posits that organizations and their effectiveness can be understood through an analysis of appropriate structure (model of care, DMP), which affects processes of work (eg, discharge planning, coordination among providers, use of protocols) and leads to measurable outcomes (resource use, patients’ outcomes, caregivers’ outcomes).
Methods
This study was a randomized trial of an 8-week DMP for chronically critically ill patients and caregivers after hospitalization. An 8-week program was selected because chronically critically ill patients are at highest risk for readmission and have their greatest need for transitional care during the first 2 months after discharge from the hospital.8,19,20 The effects of the program on caregivers are described elsewhere.21
Patients who require mechanical ventilation for more than 72 hours are at high risk for death or prolonged hospitalization with multiorgan dysfunction and continuing care needs after discharge from the hospital.6,20 Although debate continues about what constitutes “prolonged” mechanical ventilation,6,19,20,22-25 we chose 72 hours to include those patients whose clinical problems were likely to entail a high risk for continued mortality and morbidity. Other inclusion criteria included understanding English, no ventilator dependency before the index hospitalization, and discharge location within 80 miles of the study site. Although we made telephone calls to subjects who lived more than 30 miles from the study hospital, we limited subject availability to an 80-mile (128-km) radius to ensure that advanced practice nurses could make in-person visits if needed. Hospice patients and patients who had received organ transplants (any type) and case management from the transplant team were excluded from the study.
The study was done at University Hospitals of Cleveland, a 950-bed tertiary care facility associated with Case Western Reserve University in Cleveland, Ohio. All patients who met eligibility criteria during their hospitalization in any adult ICU were enrolled. Patients and their family members were approached for written consent to participate when it was clear that discharge from the hospital was expected within the next few days. Approval was obtained from the institutional review board before data were collected.
Between March 2001 and December 2003, research nurses screened all ICU patients for study eligibility and cognitive status. For patients deemed cognitively impaired (Katzman score ≥6),26 interview data were obtained from a proxy (caregiver). All study staff were trained in the use of research instruments before data were collected, and interrater reliability was monitored on a quarterly basis throughout the study. Retraining and refinement of data collection rules (eg, clarification of coding rules, clarification of variable definitions) were done as needed if correlations and percentages of agreement decreased to less than acceptable levels (r < 0.80, κ < 0.70, and percentage of agreement <90%).
Intervention
A permuted block design was used, and patients were randomly assigned to usual care with the DMP (experimental group) or usual care without the DMP (control group).27 For the first 18 months of the study, a 2:1 scheme (experimental:control) was used. To maintain a full caseload for both of the advanced practice nurses, we changed to a 4:1 scheme for the final 14 months of the study. Subjects in the DMP group were assigned an advanced practice nurse who had clinical expertise in the care and management of chronically critically ill patients. The effectiveness of using advanced practice nurses to provide and manage posthospital care has been substantiated by others.28,29 The major goals of the nurses were to coordinate follow-up services for patients, facilitate communication between the patients’ families and healthcare providers, and provide supportive services for the family members. Each advanced practice nurse had access to a pulmonologist and a geriatrician for guidance and collaboration.
Several days before a patient’s discharge, an advanced practice nurse met with the patient and the patient’s family to review the hospital course, assess both patient and caregiver, establish a plan of care, and discuss discharge plans. The nurse consulted with the hospital care team about the patient’s care needs and completed a discharge summary that included the plan of care for the patient after discharge, the patient’s goals, the presence of advance directives, and an assessment of the family’s coping skills. This summary was sent on the day of discharge to all relevant out-of-hospital healthcare providers (eg, staff at the extended care facility, family physician, consulting specialist, home care agency).
All DMP patients were visited by an advanced practice nurse within 48 hours of discharge and a second time within the first week. Visits were made at least weekly for the next 3 weeks and then at least every other week for the last 4 weeks, for a minimum total of 8 visits. A visit also was made whenever the location of care changed (eg, discharge home, transfer from one level of care to another, hospital readmission) to ensure continuity in care. Patients living more than 30 miles (48 km) from the study site were contacted by telephone.
One hallmark of the DMP was that the advanced practice nurses performed case management activities regardless of a patient’s location. During the 8-week intervention, the case management activities varied with the patient’s condition, location, and presence of family support. Typical activities included attending team meetings at extended care facilities, helping patients’ families prepare for the patients’ return home, providing emotional support for family members, counseling family members about end-of-life options, coordinating services among multiple providers, arranging for follow-up care from specialists, and monitoring patients’ condition and medications. Patients and their families had access, via pager, to an advanced practice nurse 24 hours a day. In addition, the advanced practice nurses consulted the geriatrician and pulmonologist as needed for advice regarding medication management and strategies addressing a specific patient’s problems. This collaboration generally took place over the telephone and occurred once or twice a month.
The disease management program included case management by an advanced practice nurse.
Patients in the usual care (control) group had no contact with the advanced practice nurses before or during the study period. These patients were interviewed by research nurses within 2 weeks of discharge for completion of study instruments, then at 2 months after discharge for data collection. If patients or family members in the usual care group asked for advice or information from the interviewers, they were referred back to their primary care provider, staff at the extended care facility, or the home care agency.
Instruments
Demographic data were collected on both patients and caregivers, and descriptive clinical data were abstracted from patients’ medical records. The Acute Physiology and Chronic Health Evaluation (APACHE) III is a severity-of-illness tool used to measure mortality risk on the basis of physiological and chronic health data obtained during the first 24 hours of ICU admission. Scores range from 0 to 299; higher scores indicate a higher risk of death.30 The reliability of the tool has been reported.30
The Medical Outcomes Short Form 8 (SF-8) is designed to measure HRQOL.31 It consists of 8 items and yields 2 subscale scores. Scores on the physical subscale range from 14.1 to 64.0; scores on the mental subscale range from 6.8 to 70.4. For both subscales, higher scores indicate better functioning for that domain. At the time of discharge from the hospital, patients (or their proxies) were asked to complete the SF-8 in reference to the patients’ health status for the week before hospitalization. Reliability and validity of the SF-8 have been reported.31
After patients who died, dropped out, or were lost to follow up were accounted for, a significantly greater percentage of patients in the experimental group than in the control group showed improvement in physical quality of life.
The Outcomes and Assessment Information Set (OASIS) was used to assess activities of daily living and instrumental activities of daily living. The OASIS is a 79-item tool used by home care agencies. The range of scores is 0 to 66; higher scores indicate increased dependency in performing specific activities. Interrater reliability and construct validity have been reported.32
Resource use was assessed by using standardized charges, a metric for resource use that is both interpretable and standardized across settings and time.33 We used billing data from patients during the year 2001 to determine a “standardized mean charge” for resources used. Standardized mean charges were calculated for 1 day of care for rehospitalization, a long-term acute care facility, a rehabilitation facility, and a skilled nursing home facility. We also used a resource use diary to obtain data on use of home health resources from patients who were residing at home. Medicare reimbursement was assigned to each home resource used (eg, skilled nursing visit, home physical therapy) to derive a total charge for home resource use for all patients who used any resources at home during the study period after discharge. Standardized charges then were summed for each category of resource use (hospital readmission, home care, rehabilitation facility, long-term acute care, nursing home) for the study period, and all categories of resource use were summed to compute a total charge for all resources used.23,34
To examine cost-effectiveness related to the intervention, we computed the cost of administering the intervention: the cost of the advanced practice nurses was added to the total postdischarge charges for the patients who received the intervention. The salary plus benefit costs (fiscal year 2001) for 2 full-time advanced practice nurses for 35 months (intervention duration) plus 25% of the salary/benefit costs for a project manager were $486 441. The 25% salary/benefit cost for the project manager was added to account for the administrative duties necessary to coordinate care and oversee communication between the advanced practice nurses and the healthcare providers associated with the study. We divided the total costs of delivering the intervention by the number of subjects who received the intervention (n = 231) and applied that amount ($2106) to the total charges for the study period for all experimental subjects. This new “total” reflected the charges for services used during the study period as well as a charge for the service of an advanced practice nurse.
Statistical Analysis
Experimental and control groups were compared by using analysis of variance for nonskewed continuous variables, the Mann-Whitney test for skewed continuous variables, and χ2 tests for categorical variables. Comparisons between experimental and control groups for variables over time were made by using repeated measures analysis of variance; unequal sample sizes had no effect on the analyses. Time to death was compared by using survival analytic techniques, and logistic regression was used to determine variables predictive of death. With the following assumptions, power analysis was used to calculate the sample size needed35,36(p255): α = .05, directional hypotheses, small effect size, and desired power of 90%. On the basis of these assumptions, we determined that a total sample size of 300 was needed. No oversampling was required to obtain the sample size.
Results
Figure 1 shows the distribution of the total sample. Of the 1041 patients enrolled in the study, 393 (37.8%) died in the hospital. The distribution yielded a final sample of 334 patients who were randomized to experimental or control groups. The 28.5% refusal rate (185/648) is similar to previously reported rates with this population and was most often related to a patient’s or family member’s report of feeling “overwhelmed.”6
Figure 1.
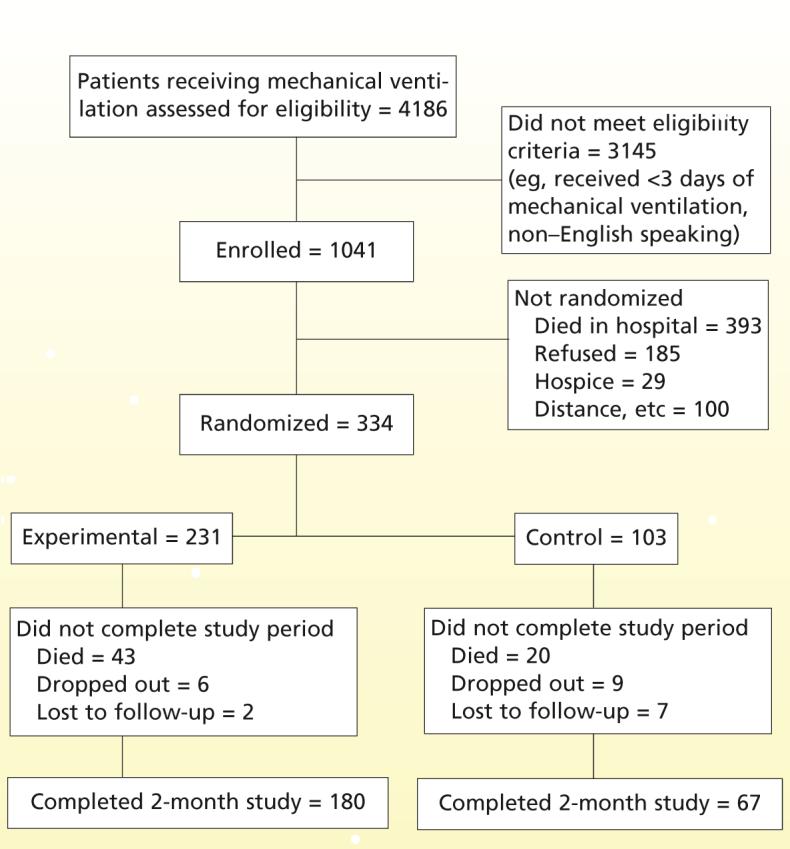
Distribution of the sample.
Demographic and Clinical Characteristics
Most subjects included in the sample were older, female, and white (Table 1). Most patients in the sample had several chronic conditions before this hospitalization, but the majority were living at home independently before admission. The study groups were statistically similar across all demographic and clinical measures except for a significant difference between groups in APACHE III scores. Although the mean APACHE III score at admission differed between the groups, no significant differences in key hospital discharge variables such as disposition or scores for activities of daily living or instrumental activities of daily living were detected.
Table 1.
Comparison of demographic and clinical variables between patients in experimental and control groups (n = 334)
| Experimental groupa (n = 231) |
Control group (n = 103) |
|||||||
|---|---|---|---|---|---|---|---|---|
| Variable | Mean | SD | Confidence interval | Mean | SD | Confidence interval | Z | P |
| Age, y | 60.7 | 16.6 | 58.7-62.9 | 61.4 | 16.1 | 58.3-64.6 | -0.22 | .82 |
| Score on Acute Physiology and Chronic Health Evaluation III | 56.6 | 26.3 | 63.9-70.9 | 63.8 | 24.3 | 69.6-79.6 | -2.67 | .007 |
| Score on Glasgow Coma Scale | 8.4 | 13.6 | 6.6-10.2 | 8.8 | 13.1 | 6.2-11.4 | -0.29 | .77 |
| No. of comorbid conditions before admission | 5.5 | 3.3 | 5.1-5.9 | 5.6 | 3.4 | 4.9-6.3 | -0.34 | .74 |
| No. of medications before admission | 4.7 | 3.8 | 4.2-5.2 | 4.9 | 4.6 | 4.1-5.9 | -0.22 | .83 |
| Length of hospital stay, d | 24.3 | 14.1 | 22.5-26.2 | 23.5 | 16.4 | 20.3-26.7 | -1.14 | .25 |
| Duration of mechanical ventilation, d | 11.8 | 10.6 | 10.5-13.3 | 11.9 | 11.2 | 9.8-14.2 | -0.18 | .85 |
| Stay in intensive care unit, d | 17.3 | 12.9 | 15.6-18.9 | 16.9 | 14.9 | 13.9-19.8 | -0.97 | .33 |
| No. | % | No. | % | χ2 | P | |||
| Female sex | 131 | 56.7 | 56 | 54.4 | 0.16 | .69 | ||
| White race | 146 | 63.5 | 60 | 58.3 | 6.00 | .19 | ||
| At home before admission | 211 | 91.3 | 92 | 89.3 | 5.64 | .34 | ||
| Reason for mechanical ventilation | 3.61 | .31 | ||||||
| Postoperative status | 61 | 26.4 | 22 | 21.4 | ||||
| Respiratory insufficiency | 107 | 46.3 | 57 | 55.3 | ||||
| Airway protection | 48 | 20.8 | 21 | 20.4 | ||||
| After cardiac arrest | 15 | 6.5 | 3 | 2.9 | ||||
| Primary diagnosisb | 5.15 | .16 | ||||||
| Pulmonary disease | 51 | 22.1 | 31 | 30.1 | ||||
| Coronary artery disease | 54 | 23.4 | 19 | 18.4 | ||||
| Neurological abnormalities | 46 | 19.9 | 13 | 12.6 | ||||
| Other (eg, gastrointestinal problem, cancer) | 80 | 34.6 | 40 | 38.8 | ||||
Of the 231 patients in the experimental group, 52 (22.5%) received telephone follow-up rather than in-person visits because they lived more than 30 miles (48 km) from the study site. We found no significant differences in characteristics or outcomes between these patients and the 179 who received in-person visits, and therefore the groups were combined for purposes of analysis.
Based on the International Classification of Diseases, Ninth Revision.
Survival
Figure 2 displays survival curves (Kaplan-Meier) over time, from discharge from the hospital to the end of the observation period (death, drop out, or 2 months after discharge from the hospital) for all randomized patients. The survival rates did not differ between the 2 groups (P = .79); mortality after discharge was 18.7% for patients in the experimental group and 19.4% for patients in the control group.
Figure 2.
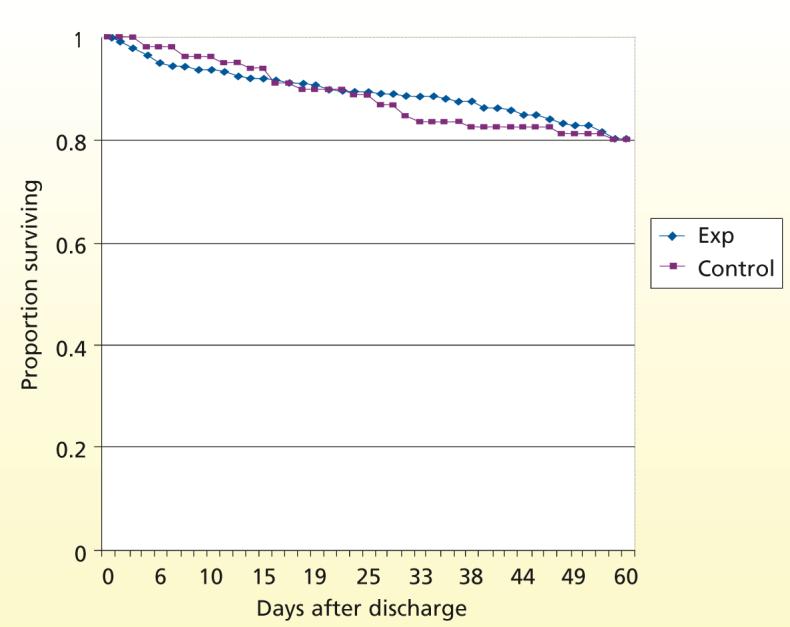
Survival over time after discharge from the hospital for patients in the experimental (Exp) and control groups (n = 334).
Predictors of Death
Using logistic regression, we examined the influence of variables shown to relate to risk for death for chronically critically ill patients.10,37-39 Independent variables included as covariates were age, duration of mechanical ventilation, HRQOL-physical status before hospital admission, APACHE III score, and presence of diabetes. Examination of variables indicated no concerns regarding multicollinearity. The model with all of the variables in the equation was statistically significant for predicting death (P = .001), and the correct classification for death and no death (from enrollment to end of study period) occurred 82.2% of the time (R2 = 0.156 [Nagelkerke test]). Of the 5 independent variables, 3 made significant contributions to the prediction of death: age (odds ratio, 0.96; 95% confidence interval [CI], 0.941-0.983; P = .001), duration of mechanical ventilation (odds ratio, 0.95; 95% CI, 0.931-0.980; P = .001), and history of diabetes (odds ratio, 2.0; 95% CI, 1.04-3.87; P = .04).
The disease management program significantly reduced hospital charges for patients who were readmitted.
Discharge Outcomes
As shown in Table 2, most patients were discharged from the hospital to an extended care facility. Only 22.8% of the patients in the sample were able to return directly home; 79.9% of the patients in the experimental group and 72.8% of patients in the control group were discharged to an extended care facility. By the end of the study period, 41.8% of patients in the experimental group and 41.2% in the control group were still residing in an extended care facility (long-term acute care facility, rehabilitation center, or nursing home). Patients who could be discharged directly home were younger (mean, 50.8 years vs 64.2 years; P = .001), had fewer days of mechanical ventilation (mean, 5.8 days vs 12.1 days; P = .001), and had fewer total number of comorbid conditions before admission than did patients who were discharged to an extended care facility (mean, 4.92 vs 5.63; P = .02). Approximately half of the patients were receiving oxygen when they were discharged from the hospital, and 17.2% required mechanical ventilation. More than one-third of the patients in each group had cognitive impairment at the time of discharge. Discharge HRQOL for the physical domain differed significantly between groups; the mean physical score at discharge was higher for the control group than for the experimental group (Table 2). No other variables differed significantly between groups.
Table 2.
Comparison of discharge variables between patients in experimental and control groups (n = 334)
| Experimental group (n = 231) |
Control group (n = 103) |
|||||||
|---|---|---|---|---|---|---|---|---|
| Variable at discharge | No. | % | No. | % | χ2 | P | ||
| Disposition | ||||||||
| Long-term acute care facility | 48 | 20.8 | 20 | 19.4 | 5.67 | .23 | ||
| Rehabilitation | 48 | 20.8 | 20 | 19.4 | ||||
| Nursing home | 87 | 37.7 | 35 | 34.0 | ||||
| Home | 48 | 20.8 | 28 | 27.2 | ||||
| Oxygen | 115 | 49.8 | 52 | 50.5 | 0.01 | .91 | ||
| Tracheostomy | 80 | 34.6 | 34 | 33.0 | 0.89 | .34 | ||
| Ventilatory support | 39 | 16.9 | 18 | 17.5 | 0.77 | .68 | ||
| Cognitive impairment | 87 | 38.0a | 37 | 38.9b | 0.03 | .87 | ||
| Died after discharge | 43 | 18.6 | 20 | 19.4 | 0.72 | .79c | ||
| Mean | SD | CI | Mean | SD | CI | Z | P | |
| Physical functioningd | 30.6 | 8.7 | 29.2-32.0 | 35.8 | 10.5 | 33.0-38.6 | -3.00 | .003 |
| Mental functioninge | 41.9 | 12.8 | 39.8-44.1 | 42.9 | 13.3 | 39.5-46.5 | -0.53 | .59 |
| Patient’s ADL/IADLf | 24.5 | 11.6 | 22.9-25.9 | 22.5 | 13.5 | 19.8-25.2 | -0.97 | .33 |
Abbreviations: ADL, activities of daily living; IADL, independent activities of daily living; CI, confidence interval.
Two cases had missing data for this variable.
Eight cases had missing data for this variable.
Relative risk = 0.92, 95% CI: 0.51, 1.67.
Higher scores on physical subscale of Short Form 8 indicate better physical functioning. Proxy data not included in analyses. Number of patients for these analyses were 141 for the experimental group and 56 for the control group.
Higher scores on mental subscale of Short Form 8 tool indicate better mental functioning.
ADL and IADL from the Outcomes and Assessment Information Set tool. Higher numbers indicate higher degree of dependence in ADL and IADL activities.
Effects of Intervention on HRQOL and Functional Status
HRQOL (physical and mental) and functional status (activities of daily living and instrumental activities of daily living) were evaluated at the beginning and end of the study period. Patients with no cognitive impairment were interviewed for the SF-8. At discharge, the control group had higher HRQOL (physical) scores than did the experimental group, and that difference continued during the intervention period. Using analysis of covariance, we assessed whether the intervention had an effect on HRQOL (physical) after we controlled for baseline (discharge) HRQOL (physical) and APACHE III scores (the APACHE III score was significantly different between groups during hospitalization). We found no significant difference (P = .40) in physical scores at 2 months after discharge once baseline scores and APACHE III scores were controlled for.
We also had asked patients at the time of discharge from the hospital to estimate their HRQOL during the 4 weeks before their ICU admission. Although the experimental and control groups had similar scores for physical HRQOL before hospitalization, by 2 months after discharge the control group was closer to returning to baseline than was the experimental group (Figure 3). Using repeated measures analysis of variance, we found no significant difference between the 2 groups over time (P = .12). We used the same approach to examine the mental component of HRQOL; the pattern was similar to that of the physical component (P = .22).
Figure 3.
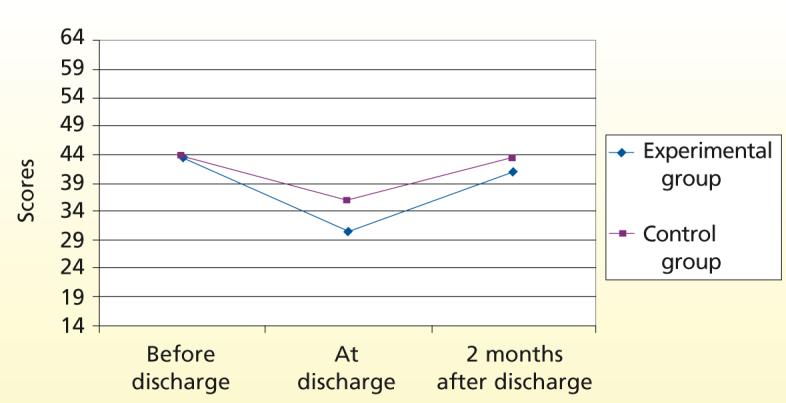
Comparison of health-related quality of life (physical) over time for experimental (n = 141) and control (n = 57) groups. Data are reported for those patients who had no cognitive impairment at hospital discharge and had completed the Short Form 8.
Because 18.9% of the 334 patients in the study died during the study period, we were concerned that patients with better health status would be overrepresented in our analyses. Because patients were no longer included in the study after they died, we decided to use an analysis approach that involved creating a category for death.40 Each patient was assigned to 1 of 3 categories on the basis of the direction and magnitude of change between base-line and 2-month physical scores (improved, stayed the same, became worse). With patients who died, dropped out, and were lost to follow-up included (Figure 4), 29.2% of patients in the control group and 36.3% of patients in the experimental group were classified as having improved. Using a χ2 goodness-of-fit test, we found that significantly more patients in the experimental group than in the control group (what was expected) had an improved physical HRQOL (χ2 = 5.95; P = .02).
Figure 4.
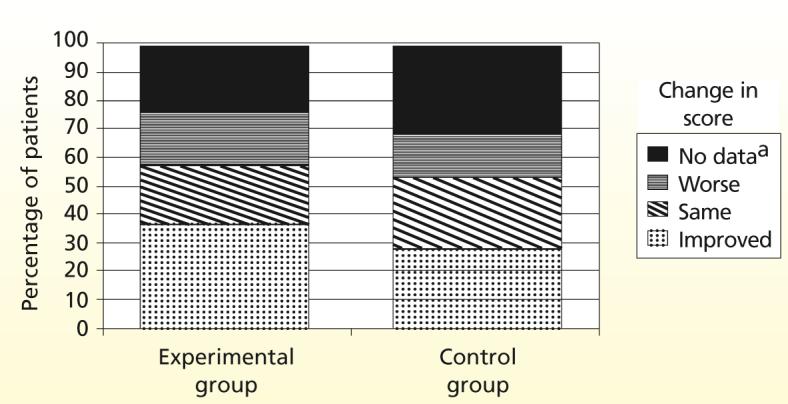
Comparison of categories of change in patients’ health-related quality-of-life score during the study period for patients in the experimental group (n = 179) and patients in the control group (n = 65). Sample sizes represent patients who had no cognitive impairment at discharge (experimental = 136 and control = 45) plus those who died during the study period (experimental = 43 and control = 20).
aSolid black represents the percentage of patients who died, dropped out of the study, or were lost to follow-up (did not provide data).
In contrast, when patients who died, dropped out, and were lost to follow-up were not accounted for, 47.8% of patients in the experimental group and 42.2% of patients in the control group were classified as having improved their physical HRQOL. Using the χ2 goodness-of-fit test, we found that the increase in the percentage of subjects in the experimental group who had an improved score for physical HRQOL (when death was not accounted for) was not significantly greater than the increase in the control group (what was expected) (χ2 = 2.32; P = .53). The same approach was taken when examining changes in mental/emotional HRQOL for the experimental and control groups. We found no significant difference in mental HRQOL score both when we included and did not include patients who died, dropped out, and were lost to follow-up.
Cost-effectiveness
For patients who survived the study period, the mean charges for care after discharge were $53 499 (SD, $53 219; 95% CI, $47 110-$59 887), with no significant differences between experimental and control groups. Mean charges for postdischarge care for nonsurvivors were only slightly lower at $47 880 (SD, $49 637; 95% CI $35 274-$60 485), with no differences between the 2 groups (P = .43). In addition, we found no significant differences between groups for any areas of resource use except for readmission charges (Table 3). Charges for all other categories of services (except rehabilitation and nursing home) were lower (yet not significantly lower) for patients in the experimental group. For patients who survived the study period and were readmitted, those in the experimental group (n = 68) had a mean of 5.77 fewer days of hospitalization for readmission than did patients in the control group (n = 25).
Table 3.
Comparison of charges ($) after discharge between patients in the experimental and control groups who received long-term mechanical ventilation and completed the study 2 months after discharge
| Experimental group (n = 231) |
Control group (n = 103) | ||||||
|---|---|---|---|---|---|---|---|
| Variablea | Mean | SD | Confidence interval | Mean | SD | Confidence interval | P |
| Readmission | 39 322 | 35 008 | 29 983-48 662 | 59 011 | 47 733 | 43 607-74 414 | .03 |
| (n = 68) | (n = 25) | ||||||
| Long-term acute care facility | 100 699 | 48 959 | 83 543-117 855 | 115 151 | 58 003 | 84 115-146 188 | .42 |
| (n = 36) | (n = 11) | ||||||
| Rehabilitation | 23 717 | 14 669 | 19 632-27 801 | 21 785 | 16 607 | 13 246-30 324 | .65 |
| (n = 52) | (n = 17) | ||||||
| Nursing home | 19 897 | 12 358 | 17 231-22 563 | 19 683 | 13 202 | 14 108-25 257 | .94 |
| (n = 85) | (n = 24) | ||||||
| Home care services | 2441 | 2525 | 1957-2925 | 3072 | 5459 | 1392-4753 | .33 |
| (n = 107) | (n = 43) | ||||||
| Total charges: survivorsb | 52 693 | 52 109 | 45 029-60 358 | 55 475 | 58 450 | 41 217-69 732 | .13 |
| (n = 180) | (n = 67) | ||||||
| Charges to produce a survivorc | 64 906 | 51 701 | 58 204-71 608 | 68 329 | 55 516 | 57 424-79 233 | .59 |
| (n = 231) | (n = 102) | ||||||
Mean charges are represented for only those patients who used that particular service (readmission, nursing home, long-term acute care facility, home care services, rehabilitation facility).
Mean total charges for care after discharge represent the total charges incurred for all 247 patients who completed the 2-month study after discharge.
This variable was computed by adding total charges for all patients (those who survived and those who died) and dividing that sum by the number of patients who survived. Note: charges for the intervention have been added to total charges for each patient in the experimental group.
A greater percentage of patients who participated in the disease management program than control patients had improvement in physical quality-of-life scores.
With this reduction in hospital days at a mean hospital charge of $3415/day, the average savings were $19 705 per patient. If similar savings were realized for each of the 93 patients in the study who were readmitted, the total reduction in hospital charges would be $1 832 523. The charges after discharge to produce a survivor for the sample were $65 955 (SD, $52 839; 95% CI, $60 259-$71 650). With the cost of delivering the intervention accounted for, the charges to produce a survivor did not differ significantly between groups.
Discussion
DMPs improve outcomes and decrease costs associated with such chronic conditions as asthma, diabetes, and heart failure.13,41,42 This report is the first description of such an intervention in patients with multiple comorbid conditions, such as chronically critically ill patients.
Our results show several patterns. First, chronically critically ill patients with a history of diabetes are at twice as much risk as patients without diabetes of dying either in the hospital or up to 2 months after discharge from the hospital. This difference may be due to more preexisting comorbid conditions (mean, 7.3 vs 5.1) and use of more medications (mean, 7.1 vs 4.4) in the patients with diabetes. Second, a greater percentage of patients in the experimental group showed improvement in their physical HRQOL scores than did patients in the control group. Possibly, patients in the experimental group would have shown greater improvement had we examined their HRQOL at a later time after discharge, as others have done.15,16 Third, our results, and those of others,8,9,20,23,25 suggest the need for attention to the management of care after discharge from the hospital for chronically critically ill patients who remain at high risk for death and readmission. Patients who are younger, have fewer days of mechanical ventilation, and have fewer comorbid conditions before hospitalization are more likely to be discharged home, without needing additional institutional care.
A meta-analysis of DMP research indicated that DMPs are more effective economically with severely ill patients than with patients who are not severely ill, with a mean effect size of 0.311 (95% CI, 0.272-0.350) reported.43 We expected to see positive results of a DMP program with patients who had a long ICU stay, but our study did not yield such results; our effect size of 0.005 was much less than the 95% CI reported in other studies. One possible explanation is that improvements in physical HRQOL scores may be more obvious at 6 months after discharge from the hospital than at 2 months after discharge, the time we used in our study. Because of the poor scores on physical HRQOL of many of the patients at the time of discharge from the hospital and the need for most to use extended care facilities after discharge, it may be unreasonable to think that this intervention could have resulted in sufficient improvements in HRQOL in such a short period.
Our results also may be confounded by the current pattern of early discharge to extended care facilities. This practice pattern may entail the need to measure outcomes for a longer period after discharge. We recommend that our study be replicated with a more longitudinal time frame for evaluation of outcomes.
Implications and Limitations
Our findings have several implications for practice. First, chronically critically ill patients are at risk for death or readmission after discharge from the hospital. In addition, chronically critically ill patients who have diabetes are at even higher risk for death after discharge. Such information should be disseminated to patients’ families and to healthcare providers who care for these patients after discharge. Second, discharge planning discussions must be realistic and must attend to the risks for mortality and morbidity associated with chronic critical illnesses. Such discussions can help patients and their families prepare for the risk for mortality and morbidity as well as the likelihood for a long rehabilitation period that may not result in regaining preadmission levels of HRQOL. Incorporating the values and goals of patients and their families in light of potential poor outcomes can aid in developing realistic, patient-centered plans of care.
Chronically critically ill patients are at risk for death and readmission after discharge from the hospital.
Finally, healthcare clinicians and administrators should note that we showed that an intensive, supportive care coordination program (DMP) could be provided by advanced practice nurses without increasing overall charges. By reducing readmission-related charges by almost $2 million, the DMP more than paid for itself. Our results suggest that the charges associated with institutional care after discharge from the hospital are significant, with a mean charge of $26 749/month for patients who survive 2 months after discharge. Such findings are consistent with those of others who have studied the effects of using advanced practice nurses to deliver services after discharge from the hospital28,29 and indicates the monetary value of using advanced practice nurses to provide non-hospital-based services to chronically critically ill patients.
Our study had some limitations. First, because definitions of what constitutes long-term mechanical ventilation vary, it is difficult to compare our results with those of other studies because the samples have not been derived by using the same criterion of days of mechanical ventilation. Second, although we did not detect any demographic or clinical differences between the patients who consented to participate in the study and the patients who refused to be included, our high refusal rate may have had an effect on external validity. Consent rates of at least 70% are recommended to minimize threats to external validity.44 Although our refusal rate is acceptable by these standards, a lower refusal rate would have resulted in a larger sample size and enhanced generalizability of study results. Third, assessing the impact of the intervention 2 months after discharge may have affected our findings. Replicating this study with a longer intervention period may show an enhanced effect of the intervention.
Conclusion
Organizations that care for chronically critically ill patients in nonhospital settings (eg, long-term acute care facilities, rehabilitation facilities, pulmonary practice groups) can benefit from the use of this intervention. By using advanced practice nurses to coordinate care and provide support to chronically critically ill patients and the patients’ caregivers, these organizations can provide an intervention that reduces the cost of care after discharge from the hospital without increasing an organization’s own costs of delivering care.
Acknowledgments
FINANCIAL DISCLOSURES
This study was funded by grant RO1-NR0-0527 from the National Institute of Nursing Research.
REFERENCES
- 1.Chelluri L, Mendelsohn AB, Belle SH, et al. Hospital costs in patients receiving prolonged mechanical ventilation: does age have an impact? Crit Care Med. 2003;31(6):1746–1751. doi: 10.1097/01.CCM.0000063478.91096.7D. [DOI] [PubMed] [Google Scholar]
- 2.Spillman BC, Lubitz J. The effect of longevity on spending for acute and long-term care. N Engl J Med. 2000;342(19):1409–1415. doi: 10.1056/NEJM200005113421906. [DOI] [PubMed] [Google Scholar]
- 3.Lassman D, McDonald E.Revenue for health care and social assistance up 4 percent, Census Bureau reports US Dept of Commerce News; Published February 7, 2001. http//www.census.gov/Press-Resease/www/2001/cb01-21.html Accessed June 29, 2007 Washington, DC [Google Scholar]
- 4.Wagner DP. Economics of prolonged mechanical ventilation. Am Rev Respir Dis. 1989;140(2 pt 2):S14–S18. doi: 10.1164/ajrccm/140.2_Pt_2.S14. [DOI] [PubMed] [Google Scholar]
- 5.Ely EW, Evans GW, Haponik EF. Mechanical ventilation in a cohort of elderly patients admitted to an intensive care unit. Ann Intern Med. 1999;131:96–104. doi: 10.7326/0003-4819-131-2-199907200-00004. [DOI] [PubMed] [Google Scholar]
- 6.Douglas SL, Daly BJ, Gordon N, Brennan PF. Survival and quality of life: short-term versus long-term ventilator patients. Crit Care Med. 2002;30:2655–2662. doi: 10.1097/00003246-200212000-00008. [DOI] [PubMed] [Google Scholar]
- 7.Friedrich JO, Wilson G, Chant C. Long-term outcomes and clinical predictors of hospital mortality in very long stay intensive care unit patients: a cohort study. Crit Care. 2006;10(2):1–9. doi: 10.1186/cc4888. [DOI] [PMC free article] [PubMed] [Google Scholar]
- 8.Chatila W, Kreimer D, Criner G. Quality of life in survivors of prolonged mechanical ventilatory support. Crit Care Med. 2001;29:737–742. doi: 10.1097/00003246-200104000-00007. [DOI] [PubMed] [Google Scholar]
- 9.Scheinhorn DJ, Chao DC, Stearn-Hassenpflug M. Liberation from prolonged mechanical ventilation. Crit Care Clin. 2002;18:569–595. doi: 10.1016/s0749-0704(02)00016-7. [DOI] [PubMed] [Google Scholar]
- 10.Elpern EH. Prolonged ventilator dependence: economic and ethical considerations. Crit Care Nurs Clin North Am. 1991;3:601–608. [PubMed] [Google Scholar]
- 11.Thompson L. Issues briefs on Challenges for the 21st Century: Chronic and Disabling Conditions. No. 4. Center on an Aging Society, Institute for Health Care Research and Policy, Georgetown University; Washington, DC: Disease management programs: improving health while reducing costs? Published January 2004. http://hpi.georgetown.edu/agingsociety/pubhtml/management/management.html. Accessed June 29, 2007. [Google Scholar]
- 12.Goetzel RZ, Ozminkowski RJ, Villagra VG, Duffy J. Return on investment in disease management: a review. Health Care Financ Rev. 2005;26(4):1–19. [PMC free article] [PubMed] [Google Scholar]
- 13.LaBresh KA, Ellrodt AG, Gliklich R, Liljestrand J, Peto R. Get with the guidelines for cardiovascular secondary prevention: pilot results. Arch Intern Med. 2004;164:203–209. doi: 10.1001/archinte.164.2.203. [DOI] [PubMed] [Google Scholar]
- 14.Harrison MB, Browne GB, Roberts J, Tugwell P, Gafni A, Graham JD. Quality of life of individuals with heart failure: a randomized trial of the effectiveness of two models of hospital-to-home transition. Med Care. 2002;40:271–282. doi: 10.1097/00005650-200204000-00003. [DOI] [PubMed] [Google Scholar]
- 15.Smith B, Forkner E, Zaslow B, et al. Disease management produces limited quality-of-life improvements in patients with congestive heart failure: evidence from a randomized trial in community-dwelling patients. Am J Manag Care. 2005;11(11):701–713. [PubMed] [Google Scholar]
- 16.Engelhardt JB, McClive-Reed KP, Toseland RW, Smith TL, Larson DG, Tobin DR. Effects of a program for coordinated care of advanced illness on patients, surrogates, and healthcare costs: a randomized trial. Am J Manag Care. 2006;12:93–100. [PubMed] [Google Scholar]
- 17.Stanek EJ, Oates MB, McGhan WF, Denofrio D, Loh E. Preferences for treatment outcomes in patients with heart failure: symptoms versus survival. J Card Fail. 2000;6(3):225–232. doi: 10.1054/jcaf.2000.9503. [DOI] [PubMed] [Google Scholar]
- 18.Donabedian A. The quality of care: how can it be assessed? JAMA. 1988;260:1743–1748. doi: 10.1001/jama.260.12.1743. [DOI] [PubMed] [Google Scholar]
- 19.MacIntyre NR, Epstein SK, Carson S, et al. Management of patients requiring prolonged mechanical ventilation: report of a NAMDRC consensus conference. Chest. 2005;128(6):3937–3954. doi: 10.1378/chest.128.6.3937. [DOI] [PubMed] [Google Scholar]
- 20.Chelluri L, Pinsky MR, Donahoe MP, et al. Long-term outcome of critically ill elderly patients requiring intensive care. JAMA. 1993;269:3119–3123. [PubMed] [Google Scholar]
- 21.Douglas SL, Daly BJ, Kelley CG, O’Toole E, Montenegro H. Impact of a disease management program upon caregivers of chronically critically ill patients. Chest. 2005;28:3925–3936. doi: 10.1378/chest.128.6.3925. [DOI] [PubMed] [Google Scholar]
- 22.Seneff MG, Zimmerman JE, Knaus WA, et al. Predicting the duration of mechanical ventilation. Chest. 1996;110:469–479. doi: 10.1378/chest.110.2.469. [DOI] [PubMed] [Google Scholar]
- 23.Douglas SL, Daly BJ, Brennan PF, Gordon NH, Uthis P. Hospital readmission among long-term ventilator patients. Chest. 2001;120:1278–1286. doi: 10.1378/chest.120.4.1278. [DOI] [PubMed] [Google Scholar]
- 24.Im K, Belle SH, Schulz R, Mendelsohn AB, Chelluri L. QOL-MV Investigators. Prevalence and outcomes of caregiving after prolonged (≥48 hours) mechanical ventilation in the ICU. Chest. 2004;125(2):597–606. doi: 10.1378/chest.125.2.597. [DOI] [PubMed] [Google Scholar]
- 25.Scheinhorn DJ, Chao DC, Stearn-Hassenpflug M, LaBree LD, Heltsley DJ. Post-ICU mechanical ventilation: treatment of 1,123 patients at a regional weaning center. Chest. 1997;111(6):1654–1659. doi: 10.1378/chest.111.6.1654. [DOI] [PubMed] [Google Scholar]
- 26.Katzman R, Brown T, Fuld P, Peck A, Schechter R, Schimmel H. Validation of a short orientation-memory-concentration test of cognitive impairment. Am J Psychiatry. 1983;140(6):734–739. doi: 10.1176/ajp.140.6.734. [DOI] [PubMed] [Google Scholar]
- 27.Rudy EB, Vaska PL, Daly BJ, Happ MB, Shiao P. Permuted block design for randomization in a nursing clinical trial. Nurs Res. 1993;42:287–289. [PubMed] [Google Scholar]
- 28.Naylor M, Brooten D, Jones R, Lavizzo-Mourey R, Mezey M, Pauly M. Comprehensive discharge planning for the hospitalized elderly: a randomized clinical trial. Ann Intern Med. 1994;120:999–1006. doi: 10.7326/0003-4819-120-12-199406150-00005. [DOI] [PubMed] [Google Scholar]
- 29.DePalma JA. Advanced practice nurses and improved outcomes. Home Healthcare Manage Pract. 2001;13(6):480–481. [Google Scholar]
- 30.Knaus K, Wagner D, Draper E, et al. The APACHE III prognostic system: risk prediction of hospital mortality for critically ill hospitalized adults. Chest. 1991;100(6):1619–1636. doi: 10.1378/chest.100.6.1619. [DOI] [PubMed] [Google Scholar]
- 31.Ware J, Kosinski M, Dewey J, et al. How to Score and Interpret Single-Item Health Status Measures: A Manual for Users of the SF-8 Health Survey. QualityMetric; Lincoln, RI: 2001. [Google Scholar]
- 32.Madigan EA, Fortinsky RH. Additional psychometric evaluation of the Outcomes and Assessment Information Set (OASIS) Home Health Care Serv Q. 2000;18:49–62. doi: 10.1300/j027v18n04_02. [DOI] [PubMed] [Google Scholar]
- 33.Katz PP, Showstack JA, Lake JR, et al. Methods to estimate and analyze medical care resource use: an example from liver transplantation. Int J Technol Assess Health Care. 1999;15(2):366–379. [PubMed] [Google Scholar]
- 34.Daly BJ, Douglas SL, Kelley CG, O’Toole E, Montenegro H. Trial of a disease management program to reduce hospital readmissions of the chronically critically ill. Chest. 2005;128:507–517. doi: 10.1378/chest.128.2.507. [DOI] [PubMed] [Google Scholar]
- 35.Elashoff J. nQuery Advisor. Statistical Solutions; Boston, MA: 2002. [Google Scholar]
- 36.Corty E. Using and Interpreting Statistics: A Practical Text for the Health, Behavioral, and Social Sciences. Mosby/Elsevier Publishers; Philadelphia, PA: 2007. p. 255. [Google Scholar]
- 37.Carson SS, Bach PB, Brzozowski L, et al. Outcomes after long-term acute care. Am J Respir Crit Care Med. 1999;159:1568–1573. doi: 10.1164/ajrccm.159.5.9809002. [DOI] [PubMed] [Google Scholar]
- 38.Engoren M, Buderer NF, Zacharias A. Long-term survival and health status after prolonged mechanical ventilation after cardiac surgery. Crit Care Med. 2000;28:2742–2749. doi: 10.1097/00003246-200008000-00010. [DOI] [PubMed] [Google Scholar]
- 39.Bach PB, Carson SS, Leff A. Outcomes and resource utilization for patients with prolonged critical illness managed by university-based or community-based subspecialists. Am J Respir Crit Care Med. 1998;158:1410–1415. doi: 10.1164/ajrccm.158.5.9804042. [DOI] [PubMed] [Google Scholar]
- 40.Diehr P, Patrick DL. Trajectories of health for older adults over time: accounting fully for death. Ann Intern Med. 2003;139:416–421. doi: 10.7326/0003-4819-139-5_part_2-200309021-00007. [DOI] [PubMed] [Google Scholar]
- 41.Akosah KO, Schaper AM, Havlik P, et al. Improving care for patients with chronic heart failure in the community. Chest. 2002;122:906–912. doi: 10.1378/chest.122.3.906. [DOI] [PubMed] [Google Scholar]
- 42.Armstrong EP, Sclar DA. Disease management: state of the art and future directions. J Clin Ther. 1999;21:593–609. doi: 10.1016/s0149-2918(00)88312-5. [DOI] [PubMed] [Google Scholar]
- 43.Krause DS. Economic effectiveness of disease management programs: a meta-analysis. Dis Manag. 2005;8(2):114–134. doi: 10.1089/dis.2005.8.114. [DOI] [PubMed] [Google Scholar]
- 44.Babbie E. Survey Research Methods. Wadsworth; Belmont, CA: 1973. [Google Scholar]