

Abstract
Obesity has been suggested to have a detrimental impact on kidney structure and function, leading to focal glomerulosclerosis and hypertension. It is also associated with hyperleptinemia and elevated renal sympathetic nerve activity. Prenatal undernutrition promotes postnatal obesity, hypertension, and an altered renal structure and function. In this study, we examined the effects of prenatal nutrient restriction and juvenile obesity in sheep. We found that juvenile obesity led to chronic hyperleptinemia and reduced renal function as assessed by nuclear scintigraphy. Additional factors include hypertension, glomerulosclerosis, and increased kidney apoptosis. Prenatal undernutrition, synchronous with early kidney development, coupled postnatally with juvenile obesity had no effect on systemic pathophysiological sequalae associated with obesity per se. Hypertension, hyperleptinemia, and poor renal function were all observed in this group. All indices of renal pathology such as increased expression of proinflammatory cytokines, angiotensin II, glucocorticoid receptors, and increased apoptosis and glomerulosclerosis were entirely absent in obese prenatally undernourished offspring. Our data indicate that juvenile obesity per se leads to systemic hypertension and renal structural and functional pathology. Prenatal undernutrition effectively abolishes any renal histopathology associated with juvenile obesity.
Keywords: obesity, fetal kidney development, maternal nutrition, glucocorticoids
The incidence of obesity (body mass index >30 kg/m3) in the UK and worldwide has increased markedly over the past two decades.1 As obesity is a risk factor for many pathologies, the incidence of a multitude of obesity-related diseases has paralleled this increase1 including renal and cardiovascular disease, for which systemic hypertension is a significant risk factor.2 A specific reduction in body-fat mass ameliorates both renal disease3 and hypertension,1 thus as obesity levels continue to rise it is possible that there will also be a parallel increase in renal disease over the next decade.3,2 Indeed, obesity-related glomerulopathy, characterized by glomerulomegaly and focal segmental glomerulosclerosis, has been described as an ‘emerging epidemic’.4 Early work in obesity-prone animal models predicted such renal-specific consequences of excess body-fat mass.5
The mechanism(s) that underpins obesity-related renal pathology has not been clearly delineated as obesity is often associated with hypertension, which will independently exacerbate renal disease.2 However, Haynes6 has produced a body of work implicating leptin as central to the inter-relationship between obesity, hypertension, and the kidney. Elevated body-fat mass leads to increased circulating leptin concentration,7,8 which elevates sympathetic nervous system activity producing increases in blood pressure.6,9,10 Importantly, selective leptin resistance appears to develop with obesity,11 that is preservation of sympathetic effects but downregulation of metabolic effects, with specific increases in the sympathetic tone to the kidney.8 Such an observation may, in part, explain a proportion of the increased incidence of renal disease with obesity. In addition, a direct mechanical contribution of increased perirenal adipose tissue in obese animals may serve to increase intrarenal pressure,12 exacerbating the hypertensive state and inducing further progressive renal damage. Other locally produced cytokines from perirenal adipose, in addition to leptin, may also have direct effects on the kidney and accentuate obesity-related glomerulosclerosis such as interleukin-6 and tumor necrosis factor (TNF)-α as obesity per se has been described as a proinflammatory state.13 Nevertheless, it is important to bear in mind that not all obese people suffer renal disease and it is highly possible that many other factors increase an individual’s susceptibility to renal disease.
One of these other factors may be the maternal environment. Mackenzie and Brenner14 first suggested that a reduction in nephron number was causal for the development of essential hypertension. In support of this concept, Keller et al.15 noted fewer glomeruli per kidney (using three-dimensional stereology) from patients with hypertension compared with normotensive controls. Reduced maternal nutrition in animal models has been shown to lower the nephron complement of the offspring at birth and in adulthood.16,17 In addition, babies born of low birth weight have fewer nephrons (see Mackenzie and Brenner14) and are subsequently at a greater risk of developing hypertension as adults (reviewed in Zandi-Nejad et al.18). Combined, these studies indicate that permanent changes in renal structure can accompany maternal undernutrition (which, depending on timing, can lead to low birth-weight) especially if the period of nutritional restriction occurs in synchrony with fetal nephrogenesis and therefore may potentially be key towards the ‘programming’ of renovascular hypertension. Further animal studies have been broadly supportive of a structural and molecular programming by maternal diet of the kidney,19,20 but although reduced nephron number may have a role18 it is not the causal link.21,22
In the sheep, the ovine pronephros develops and then degenerates by day 35 of gestation (term ∼145 days), around the time of implantation (days 18-30).23,24 The subsequent mesonephros is partially functional at this time but regresses by day 57-60. The mature ovine kidney (i.e., metanephros) develops over days 27-110 and comprises a mass of metanephric mesenchyme into which the ureteric bud grows and branches, forming new nephrons until ∼day 110 when the full mature nephron complement is completed.25 In three separate studies in the sheep, we have implemented maternal nutrient restriction during 0-30 days,26 30-80 days,16 or 0-95 days gestation27 and measured resting blood pressure on each occasion. Blood pressure was significantly elevated in only the latter study, which spanned the majority of nephrogenesis in the sheep. However, we cannot exclude an age-related interaction with the prenatal diet as this study was conducted on significantly older sheep (3 years) compared with the other two studies (1 year26 and 6 months16). Nevertheless, after maternal nutrient restriction from 30-80 days gestation, offspring exhibited increased renal mRNA abundance for the glucocorticoid receptor (GCR) and angiotensin-II receptor,20 possible early indicators of later, age-related renal dysfunction.
Clearly, both maternal nutritional exposure and obesity per se can significantly influence the development of the kidney and its function, respectively. One may hypothesize, therefore, that prenatal undernutrition coupled with postnatal obesity specifically exacerbates renal dysfunction and glomerulopathy leading to an early onset of hypertension. However, no study to date has examined any interaction between these two factors. Hence, in this study the combined effects of prenatal nutrient restriction with juvenile obesity was examined with adult end points being (1) plasma leptin concentration, (2) in vivo renal function, as assessed by radionuclide renography, (3) resting systolic and diastolic blood pressure, (4) key molecular markers within the kidney cortex for apoptosis (terminal deoxynucleotidyl transferase-mediated dUTP nick end-labelling (TUNEL) assay and caspase-3 mRNA expression), glomerulosclerosis (periodic acid Schiff’s staining) and severe proteinuria (tubular protein casts; commonly observed in cases of progressive renal disease28,29), and (5) renal endocrine sensitivity, that is mRNA for glucocorticoid and angiotensin-II receptors (angiotensin II receptor type 1 (AT1) and angiotensin II receptor type 2 (AT2) and TNF-α) at 1 year of age in sheep.
RESULTS
Physical activity and food intake
From weaning to 12 months of age, the restricted space offered barn-housed groups of sheep resulted in a significant (P<0.001) reduction in their average daily activity (obese control (OC), 115 674±11 593 and obese nutrient restricted (ONR), 100 927±7 189 accelerometry units) compared with the relatively unrestricted field environment (lean control (LC), 307 957±51 598 accelerometry units). Over this time, average daily food intake of individuals was also significantly higher in barn-housed sheep (6 months: OC and ONR, 21.6±1.8 vs LC, 16.5±2.0 MJ/day). At 12 months of age, at the time of renal and cardiovascular assessments the 24 h feed intake of OC and ONR sheep had reduced such that daily energy intake was not different from LC (OC, 15.9±1.3; ONR, 15.0±1.0 vs LC, 15.6±1.3 MJ/day).
Blood pressure and heart rate
Baseline systolic (OC, 116±3; ONR, 119±3; vs LC, 105±2 mm Hg) and diastolic (OC, 88.6±2.3; ONR, 86.0±2.2; vs LC, 78.1±1.5 mm Hg) blood pressures were significantly (P = 0.04 and 0.02, respectively) higher in obese relative to lean sheep. In addition, heart rate was also significantly elevated in obese sheep (OC, 98±2; ONR, 98±3 vs LC, 89±1 beats/min; P = 0.01).
Blood electrolytes, blood volume, plasma volume and leptin concentration
Obese sheep had elevated blood glucose and calcium concentrations relative to lean sheep (Table 1). No other measured variable differed in obese sheep. Estimated blood volume and plasma volume when corrected to lean body mass (ml/kg lean mass) were significantly less in obese groups (blood volume: OC, 135±11; ONR, 146±14; vs LC, 195±15; P = 0.01 and plasma volume: OC, 85±7; ONR, 93±9; vs LC, 129±10; P = 0.006). Hematocrit tended toward higher values in obese sheep, but this was not statistically significant (OC, 35.4±1.8; ONR, 37.2±1.3; vs LC, 33.7±1.3). Leptin concentration was significantly elevated in all obese relative to lean sheep (OC, 20.1±2.6; ONR, 23.1±2.0; vs LC, 2.1±0.2 L; P = 0.0001). In addition, plasma leptin was similar to these LC sheep in all lean nutrient-restricted offspring sampled at both 6 months and 3 years of age (data not shown).
Table 1.
Blood metabolites and electrolytes in lean and obese sheep
| LC | OC | ONR | P | |
|---|---|---|---|---|
| Glucose (mmol/l) | 3.40±0.17 | 4.21±0.19* | 4.11±0.15* | 0.001 |
| Lactate (mmol/l) | 1.83±0.46 | 2.03±0.47 | 2.64±0.20 | NS |
| Ca+ (mmol/l) | 1.15±0.05 | 1.29±0.01* | 1.27±0.01* | 0.001 |
| K+ (mmol/l) | 4.08±0.08 | 3.93±0.05 | 3.87±0.11 | NS |
| Cl- (mmol/l) | 105±0.30 | 105±0.70 | 106±0.43 | NS |
| Hemoglobin (g/dl) | 14.1±0.4 | 13.5±0.8 | 14.8±0.6 | NS |
LC, lean controls (n=8); OC, obese controls (n=8); ONR, obese nutrient restricted (n=11); NS, not significant.
Statistics are
P<0.01 LC vs OC and ONR.
Renography and glomerular filtration rate
The height of the left renogram curve in all sheep was significantly lower than that of the right curve, reflecting the attenuation of the γ rays owing to the deeper abdominal position of the left kidney vs the right kidney relative to the camera head. For the left and right kidney, the time to peak was 39 and 23% (left), 37 and 42% (right) longer in OC and ONR, respectively, relative to LC, but the effect was not statistically significant (Figure 1a). Both the upslope and downslope of the renogram, however, were significantly blunted in both of the obese groups in both kidneys (OC and ONR) relative to the LCs (LV; Figure 1b and c). Nevertheless, absolute glomerular filtration rate (GFR) tended (P = 0.08) to be higher in obese sheep (OC and ONR) relative to lean (LC) but when normalized to lean body mass tended to be lower (P = 0.07; Table 2).
Figure 1. The effect of obesity on in vivo renal function as assessed with radionuclide renography.
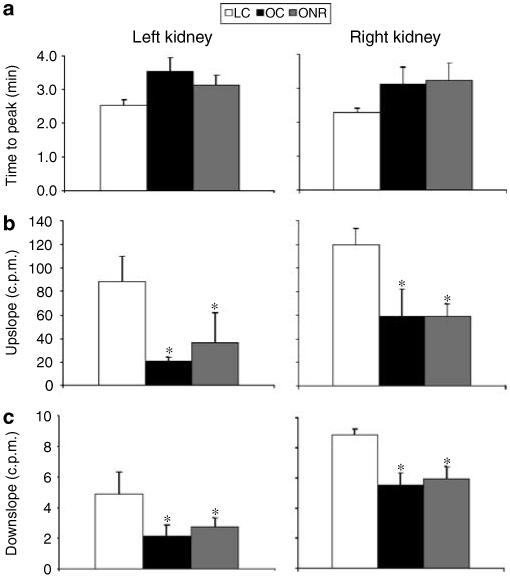
Data are expressed as mean±s.e.m. for LC (n = 6), OCs (n = 8), and ONR (n = 4). (a) Time to peak (min) is from bolus injection of technetium-99-diethylenetriaminepentaaceticacid to peak counts in the right kidney; (b) The upslope is defined, for the right kidney, as the positive slope of the renogram occurring before the peak and computed using the X and Y values of the renogram at 5 and 90% of the peak Y; (c) The downslope is defined, for the right kidney, as the negative slope of the renogram occurring after the peak and computed using the X and Y values of the renogram at the peak and at the half-peak value on the downslope side of the curve. *P<0.05, OC and ONR vs LC.
Table 2.
Glomerular filtration rate in lean and obese sheep
| LC | OC | ONR | P | |
|---|---|---|---|---|
| GFR (ml/min) | 93.5±9.9 | 138±15 | 114±17 | 0.08 |
| GFR (ml/min/g kidney) | 0.84±0.09 | 0.81±0.06 | 0.68±0.07 | NS |
| GFR (ml/min/kg lean mass) | 4.02±0.30 | 3.24±0.27 | 3.11±0.59 | 0.07 |
GFR, glomerular filtration rate; LC, lean controls (n=6); OC, obese controls (n=8); ONR, obese nutrient restricted (n=4); NS, not significant.
Glomerular filtration rate as assessed using technetium-99-diethylenetriaminepenta-acetic acid. See Materials and Methods for details.
Body composition
At 12 months of age both OC and ONR sheep were significantly heavier than LC (Table 3). Excluding the carcass, the wet weight of all organs, with the exception of the pancreas and lungs, was significantly heavier in obese relative to lean sheep (OC and ONR vs LC; Table 3). In particular, the left, but not right, ventricle and septum were significantly enlarged in obese (OC and ONR) groups relative to LC. However, when expressed relative to body weight, the brain, heart, lungs, and pancreas were significantly smaller in OC and ONR relative to LC (Table 3). The spleen was relatively small when compared with LC, in OC only. As expected, total visceral fat mass was also significantly elevated in obese sheep (15.1±0.5 and 13.6±0.59 kg in OC and ONR, respectively, vs LC, 5.0±0.5 kg; P<0.001). Carcass composition analysis (excluding all wool and viscera) indicated significantly increased adiposity (46±2 and 49±1% in OC and ONR, respectively, vs 24±2% in LC; P<0.001), significantly reduced moisture content (38.3±1.6 and 36.4±1.3% in OC and ONR, respectively, vs 53.6±1.6% in LC; P<0.001), and significantly reduced protein content (N*6.25; 11.5±0.4 and 10.7±0.3 kg in OC and ONR, respectively, vs LC, 16.8±0.6 kg) in obese vs lean sheep. Thus, lean body mass (body weight-total fat mass) expressed on a dry weight basis (lean body mass-moisture) was significantly greater in obese vs lean sheep (38.9±0.8 and 36.5±3.1 kg in OC and ONR, respectively, vs 22.9±1.8 kg in LC; P<0.001).
Table 3.
Absolute and relative organ weights in lean and obese sheep
| LC | OC | ONR | P | |
|---|---|---|---|---|
| Body weight (kg) | 58.6±92.4 | 88.7±2.6* | 85.8±1.5* | 0.001 |
| Brain (g) | 104±3 | 89±3* | 93±2* | 0.005 |
| Kidney (g) | 117±9 | 155±7* | 164±7* | 0.001 |
| Liver (g) | 602±36 | 897±59* | 875±50* | 0.001 |
| Spleen (g) | 102±9 | 92±16 | 163±27 | 0.07 |
| Lungs (g) | 567±44 | 508±34 | 505±30 | NS |
| Pancreas (g) | 53.0±3.4 | 60.2±6.3 | 62.4±4.4 | NS |
| Heart (g) | 237±10 | 309±12* | 271±16 | 0.02 |
| Left ventricle (mm) | 13.5±2.1 | 21.1±2.4* | 19.5±1.4* | 0.02 |
| Right ventricle (mm) | 6.3±1.1 | 6.4±1.5 | 7.2±1.1 | NS |
| Septum (mm) | 13.5±1.9 | 19.8±1.1* | 20.7±1.3* | 0.004 |
| Brain:body (g/kg) | 1.84±0.13 | 0.99±0.04* | 1.07±0.02* | 0.001 |
| Kidney:body (g/kg) | 2.04±0.14 | 1.71±0.04 | 1.87±0.10 | NS |
| Liver:body (g/kg) | 10.4±0.3 | 9.9±0.6 | 10.2±0.5 | NS |
| Spleen:body (g/kg) | 1.77±0.13 | 1.02±0.18* | 1.78±0.31 | 0.01 |
| Lungs:body (g/kg) | 9.83±0.52 | 5.59±0.31* | 5.78±0.41* | 0.001 |
| Pancreas:body (g/kg) | 0.93±0.06 | 0.66±0.06* | 0.72±0.06* | 0.01 |
| Heart:body (g/kg) | 4.15±0.12 | 3.42±0.13* | 3.07±0.19* | 0.001 |
LC, lean controls (n=8); OC, obese controls (n=8); ONR, obese nutrient restricted (n=11).
Statistics are
P<0.05 LC vs OC and/or ONR.
Glomerulosclerosis, protein casts and renal expression of GCR, AT1, AT2, and TNF-α
Glomerulosclerosis was significantly increased in OC relative to both LC and ONR (P<0.001 for both cases; Figure 2a-c) and protein casts were evident in OC only (data not shown). In addition, OC kidneys had significantly increased expression of GCR (Figure 3a), AT1 (Figure 3b), TNF-α (Figure 3c), and AT2 (OC, 3.59±0.6; ONR, 1.72±0.36; vs LC, 1.29±0.31 × 10⁻⁶ AT2/18S; LC vs OC P = 0.0001) relative to ONR and LC.
Figure 2. Glomerulosclerosis in obese sheep.
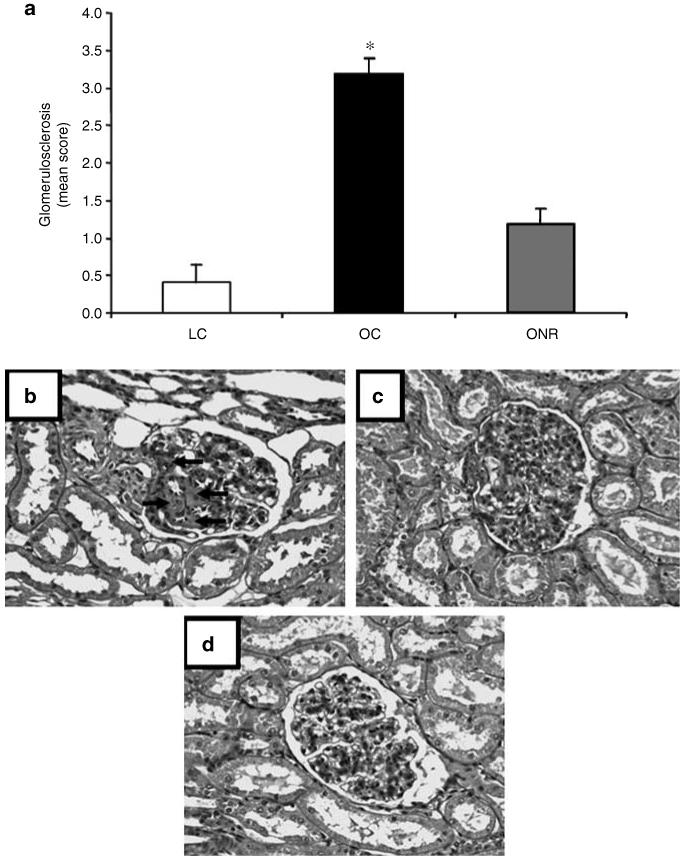
(a) The effect of prenatal nutrient restriction and postnatal obesity on renal glomerulosclerosis score as assessed by periodic acid Schiff’s staining (see Materials and Methods for details). Data are expressed as mean±s.e.m. for LCs (n = 8), OCs (n = 8), and ONR (n = 11). Statistics are *, P<0.01 OC vs LC and ONR. Photographs depicting the degree of glomerulosclerosis as assessed through periodic acid Schiff’s staining at original magnification × 200. (b) OC, (c) ONR, (d) LC. Arrows indicate areas of glomerulosclerosis, which were significantly more prevalent in OC vs ONR and LC (P<0.01).
Figure 3. Data are expressed as mean±s.e.m.
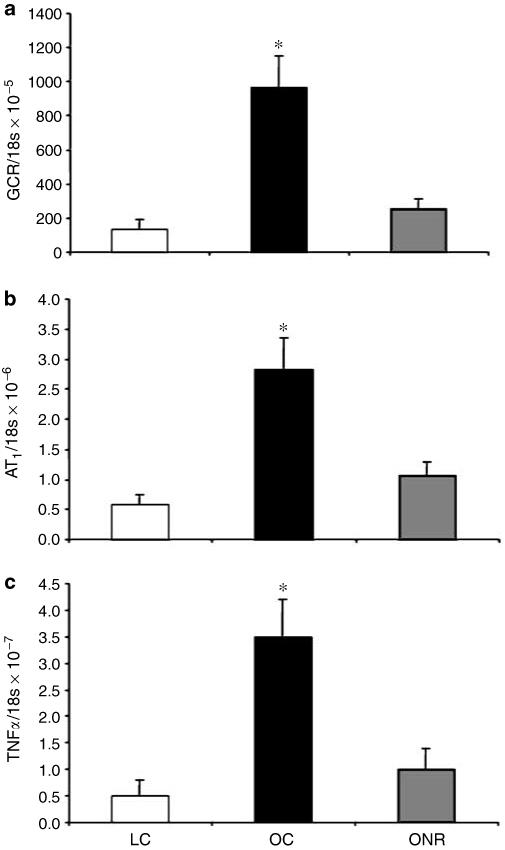
The effect of prenatal nutrient restriction and postnatal obesity on renal expression of (a) GCR, (b) AT1, and (c) TNF-α. All data are expressed as a ratio to 18s concentration. LC (n = 8), OC (n = 8), and ONR (n = 11). Statistics are *P<0.01 OC vs LC and ONR.
No evidence of glomerulosclerosis or luminal protein casts were found in all kidney sections from either control or nutrient-restricted offspring that did not become obese postnatally, when sampled at 3 years of age (data not shown). Similarly, there was no significant difference in mRNA abundance for GCR, AT1, AT2, or TNF-α between kidneys of these control and nutrient-restricted offspring (e.g., at 6 months of age GCR: C 0.51±0.28; NR 0.33±0.16 × 10⁻³ GCR/18S; AT1: C 0.63±0.21; NR 0.69±0.19 × 10⁻⁶ AT1/18S; AT2: C 0.56±0.31; NR 0.68±0.26 × 10⁻⁶ AT2/18S; TNF-α: C 0.45±0.17; NR 0.18±0.08 × 10⁻⁷ TNF-α/18S).
Index of renal apoptosis: TUNEL and caspase 3 labelling
The proportion of TUNEL-positive cells was higher in the renal medulla vs cortex for all nutritional groups (Figure 4a). However, there was a markedly higher proportion of TUNEL-positive cells in both the renal cortex and medulla in OC relative to LC and ONR (P<0.001 for both cases; Figure 4a). A similar pattern emerged when using caspase 3 immunostaining for apoptosis, higher levels in the medulla vs cortex and significantly increased (P = 0.01) staining in OC vs both LC and ONR (Figure 4b). Again, in lean nutrient-restricted and control animals (i.e., not subjected to juvenile obesity) there was no evidence of apoptosis in any of the kidneys examined from either control or nutrient-restricted offspring at 3 years of age (data not shown).
Figure 4. The effect of prenatal nutrient restriction and postnatal obesity on renal apoptosis in the cortex (solid bars) or medulla (hatched bars) as assessed by TUNEL (data expressed as mean semiquantitative grading score±s.e.m.) or caspase-3 immunolabelling (data expressed as mean positive cell count per original magnification × 200 field±s.e.m.).
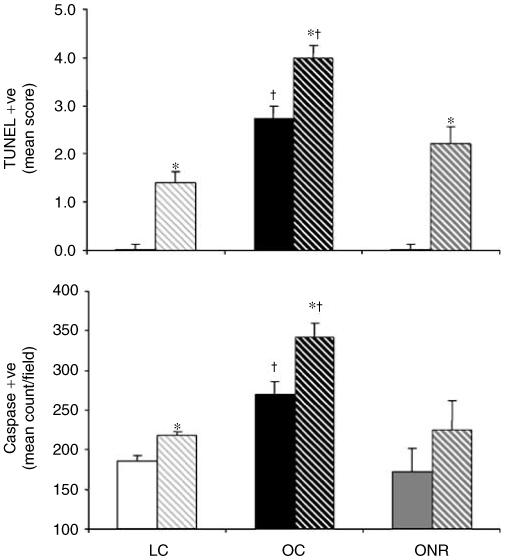
LCs (n = 8), OCs (n = 8), and ONR (n = 11). Statistics are *P<0.05, cortex vs medulla; †P<0.01 OC vs LC and ONR.
DISCUSSION
Juvenile sheep exposed to an environment that promotes physical inactivity and increased food intake rapidly become obese and exhibit hypertension as young adults, regardless of prenatal diet. These obese, hyperglycemic, hyperleptinemic young adult sheep also display reduced renal uptake of technetium-99-diethylenetriaminepentaacetic acid and blunted intrarenal passage of the tracer, indicating reduced renal functional capacity. In these obese sheep, marked renal histopathology was also present as indicated by increased cortical apoptosis, glomerulosclerosis, luminal protein casts, and increased renal expression of GCR, AT1, and TNF-α; combined, the data suggest a propensity for a rapid age-related decline in renal function with obesity. Juvenile obesity per se is particularly indicated given no evidence of renal pathology in any animal that did not become obese postnatally. Surprisingly, prenatal undernutrition during the major period of nephrogenesis in the sheep (group ONR) prevented all of the obesity-induced renal histopathological changes, but did not alter the systemic dysfunction; hypertension, blunted renograms, and elevated blood calcium were all similar to OCs. The data indicate a particularly deleterious effect of juvenile obesity on renal function that is associated with hypertension and renal histopathology by 1 year of age, but a surprising ‘protective’ effect of prenatal undernutrition on renal histopathology only.
In this study, the level of obesity or increased fat mass was significant, being 47% of the carcass weight in the sheep as compared with 22% in controls. In human terms, these sheep were certainly in the obese body mass index category (>30 g/m3). It is of note however, that this degree of obesity was produced primarily through a restriction of spontaneous physical activity rather than gross overfeeding during a period (adolescence) when such activity would be expected. The LC sheep allowed greater space for activity, expended ∼3.5-fold more energy engaged in low-moderate activity, but only ate 25% less food than the obese sheep over this time. By 12 months of age, however, food intake was similar between all groups but the overweight individuals remained relatively physically inactive, even in an equivalent environment as the LCs (data not shown). Thus, the obese groups, as young adults, remain susceptible to further weight gain. This perhaps reflects a consequence of increased body weight and/or is a latent effect of a physically inactive adolescence, but nevertheless perpetuates the deleterious effects of excess adiposity acquired during early life.
Plasma leptin is known to increase with increased adiposity30 and in this study the levels of leptin were ∼10-fold greater in the obese sheep at 1 year of age. Concurrent with the increase in leptin was a higher resting blood concentration of glucose (4.2 vs 3.4 mm) and calcium (∼1.28 vs 1.15 mm) in obese vs lean individuals. Resting hyperglycemia is indicative of global insulin resistance and developing type II diabetes can induce diabetic nephropathy, leading, in theory, to altered renal calcium handling.31 Elevated plasma calcium has been observed in morbidly obese patients with hyperparathyroidism32 and although parathyroid hormone levels were not measured in this study it is possible that a similar clinical state exists in the obese sheep, leading to the observed increases in resting plasma [Ca2+]. Certainly, the coexistence of hypertension with hyperleptinemia and altered glucose and calcium handling in the obese animals will exacerbate any age-related decline in renal functional capacity.33 It is of note that this is the first study to generate significantly hypertensive sheep (i.e., an increase of ∼10-15 mm Hg) at 1 year of age, virtually entirely through acquisition of excess body-fat mass during adolescence and young adulthood. There was no interaction with the prenatal diet on the degree of hypertension observed as a young adult in this study, in contrast to previous data in non-obese laboratory species.34
It has been suggested that, together with metabolic abnormalities, elevated production of the protein products of adipose tissue including leptin, adipokines, and angiotensinogen, for example, contribute significantly toward the progression of end-stage renal disease.33 In the OCs of this study, leptin was indeed markedly increased as was the renal expression of GCR, TNF-α, and AT1, indicating the potential for enhanced GC sensitivity, local proinflammatory cytokine activity, and local vasoconstriction, respectively. Taken together, it is envisaged that the OCs of this study would indeed be susceptible to obesity-induced renal failure. Increased renal angiotensin II sensitivity (reflected by increased AT1 in OC, but not ONR or LC) may well underpin the increased renal apoptosis and widespread pathology observed, as has been shown in rats.35 However, prenatal nutrient restriction occurring synchronous with nephrogenesis prevented all local molecular changes and any signs of regional apoptosis, glomerulosclerosis, or presence of protein casts despite similarly high plasma leptin, plasma calcium, and blood pressure as OCs. Parallel changes between the AT1 and AT2 receptors have been reported previously in several injury models,36 but in this study prenatal undernutrition dissociated this effect and prevented the pathology from occurring. Thus, in this study, it would appear that for the early signs of renal failure to develop in the face of high plasma leptin and hypertension, the local molecular changes within the kidney (increased GC sensitivity, proinflammatory cytokine activity, and AT1-mediated vasoconstriction) are a prerequisite. One further explanation as to why the kidneys of offspring born to nutrient-restricted mothers are less susceptible to apoptosis may be related to increased insulin-like growth factor-I receptor abundance37 that would be predicted to promote cell survival38 rather than apoptosis. The extent to which apoptosis precedes the kidney damage we have described, however, remains to be established.
Hypertension is twice as common in overweight vs average-sized individuals1 although the precise relationship between obesity and cardiovascular control is not fully understood. Clearly, excess body mass places a greater burden on the heart, which is unable to fully compensate (i.e., proportionately enlarge) in the way other metabolic organs do (e.g., liver, kidney). Thus, left ventricular hypertrophy develops to generate the greater force needed to effectively perfuse the greater body mass, as reproduced in this study. Extrapolating from these observations, an increased left ventricular mass will reduce intraventricular volume, reducing stroke volume and thus increased heart rate is necessary to maintain cardiac output. The obese groups in this study had elevated resting heart rate and this most probably reflects either increased sympathetic sensitivity to extrinsic stimuli or greater autonomically driven sympathetic tone. Although this study cannot isolate which of these influences predominates, it is of note to consider the volume of data generated by Haynes, Mark, and co-workers with regard to the effect high-circulating plasma leptin has on sympathetic activity,8-11,39 specifically on the sympathetic output to the kidney.2,10,12 Indeed, it has been shown that renal denervation prevents obesity-induced hypertension.40
Thus, the theoretical ontogeny of obesity-related hypertension in this study may be hypothesized as follows: gradual acquisition of excess body fat throughout adolescence leads to greater production of leptin and gradual leptin resistance. The elevated plasma leptin specifically activates sympathetic activity, in particular the renal branch,12 and together with the greater demand that excess body weight places on the heart leads to hypertension. High blood pressure, high leptin, and increased renal sympathetic activity gradually progress the kidney toward early-stage renal failure, characterized by cortical nephron apoptosis and glomerulosclerosis. These end-stage processes are exacerbated by, and dependent on, concurrently increased local glucocorticoid, renin-angiotensin system, and inflammatory processes. Prenatal nutritional restriction during nephrogenesis, although limiting total nephron number in many studies41-43 stimulating single nephron hypertrophy and hyperfiltration, in this study at least, prevents or perhaps only delays the end-stage renal pathology observed in OC animals.
In conclusion, we have demonstrated for the first time, in a large animal species, significant early life hypertension and early indices of renal failure that are entirely related to excess adiposity acquired during adolescence. Demonstrable indices of end-stage renal failure such as increased cortical apoptosis, glomerulosclerosis, and presence of protein casts only occur if the above clinical symptoms are concurrent with increased expression of renal glucocorticoid, renin-angiotensin, and inflammatory markers. Prenatal undernutrition prevents increased expression of these markers in the kidney and prevents the early development of renal apoptosis and glomerulosclerosis despite being similarly hyperleptinemic, hyperglycemic, and hypercalcemic at 1 year of age. Whether the pathological renal sequalae of juvenile-adult obesity are simply postponed to later in life in prenatally programmed animals cannot be determined, but certainly obesity per se is strongly contraindicated with respect to maintaining normal renal function and avoiding renal disease.
MATERIALS AND METHODS
Animals and experimental design
All procedures were performed in accordance with the UK animals (Scientific Procedures) Act, 1986. At day 30 of gestation, 26 Welsh Mountain ewes were randomly allocated to receive either a control (C; 7 MJ/day: n = 16) or nutrient-restricted diet (NR; 50% of C, n = 11) until day 80 of gestation. Thereafter, all sheep were fed 100% calculated metabolizable energy requirements to term (12-13 MJ/day near term).44 Offspring were delivered spontaneously and were reared by their mothers to weaning (10 weeks). After birth, all mothers were fed a diet of hay ad libitum together with a fixed amount of concentrate pellets sufficient to fully meet their own metabolizable requirements, plus that needed to maintain lactation. All diets contained adequate minerals and vitamins. From weaning to 12 months of age, offspring were either group-housed in a barn (restricted activity), at a stocking rate of 17 animals per 50 m2 with ad lib access to hay and concentrate pellets to promote increased fat deposition (OC, n = 8; ONR, n = 11) or pasture grazed at a stocking rate of 17 animals per 3000 m2 (unrestricted activity; LC, n = 8) with ad lib access to grass and concentrate pellets. Over this time the gross metabolic budget (energy expenditure vs energy intake) of all sheep was assessed as follows: energy expenditure by measurement of low-moderate physical activity with accelerometry (‘Actiwatch’, Linton Instrumentation, Diss, UK) and energy intake as total food intake over a 24-h period. For energy expenditure, an unaxial accelerometer was attached to a collar on the sheep perpendicular to the plane of forward movement and a record logged every 30 sec for a 24-h period. Data were then downloaded to an Excel spreadsheet for further analysis. Activity data reflected 5760 data points in total for each individual sheep.
At 1 year of age, that is as young adults, all sheep were group-housed indoors for 1 week before surgical implantation of arterial and venous catheters. Over this time both energy expenditure and energy intake were again assessed. All food, but not water, was withdrawn from the animals for 24 h before surgery. Anesthesia was induced with propofol (rapinovet; 6 mg/kg) and maintained with 3-4% isoflurane in O2 3-4 l/min. Carotid and jugular catheters were inserted into each sheep and the incision closed. All sheep received a course of antibiotic (10 mg/kg intramuscularly procaine penicillin, ‘duphapen’; Fort Dodge Animal Health Ltd, Southampton, UK) and analgesia (2 mg/kg intramuscularly flunixin meglumine; ‘finadyne’; Schering-Plough, Kenilworth, UK) for 3 days postoperatively. Catheter patency was maintained by daily flushing with heparinized saline (50 IU heparin/ml). All sheep had established normal feeding patterns within 0.5-1 h after surgery and showed no visible signs of discomfort for the duration of the experimental period.
Additional groups of control and early-mid gestational nutrient-restricted sheep were also used to investigate the impact of nutrient restriction on molecular and histological effects on the kidney. These included 12 sheep of the same age and breed and fed the same diets as described above. Six of the 12 animals were nutrient restricted between 28-80 days gestation and six were fed a control diet. All offspring were born normally at term and each remained with their mother until 10 weeks of age. The offspring were then reared out at pasture under environmental conditions that were identical to that described for the LCs above, that is forming a ‘lean nutrient restricted’ group. All offspring were then tissue sampled (6 months) after birth for which molecular results from the lung have already been published.45 In addition, renal tissue from a further group (n = 10) of lean nutrient-restricted (from 0-95 days gestation) offspring were sampled at 3 years of age for which hepatic molecular data have been published.46
Experimental protocols
In vivo experiments
Blood sampling and blood volume measurement
A period of 2-4 days postoperative recovery was allowed and the investigator was blinded to the dietary origin of the sheep before any experiment was performed. A baseline blood sample of 10 ml was taken from the jugular cannula of all offspring. A proportion of this blood was used to assess basal metabolites and electrolytes (blood glucose, lactate, hematocrit, and blood [Ca2+], [K+], [Cl−]). Following this, the sheep were injected with 5 ml Evans blue solution (3 mg/ml) and a blood sample (5 ml) collected exactly 15 min later.47 All blood was centrifuged at 3000 r.p.m. for 10 min and plasma decanted. Blood volume was calculated by measuring the concentration in 200 μl plasma against the individual’s standard curve (0-20 mg/l Evans blue in 200 μl plasma) using the baseline sample on a 96-well plate reader.
Blood pressure
Sheep were habituated to a metabolic crate and after at least an hour the arterial catheter was connected to precalibrated pressure transducers (SensorNor 840; S 4925) attached at heart level linked to a data acquisition system (Po-Ne-Mah; Version 3, Gould Instrument Systems Inc., LDS Test and Measurement Ltd, Royston, Herts, UK) and a baseline recording taken over a further hour. Analogue signals for real-time systolic, diastolic, mean arterial pressure, and heart rate were recorded at 1-sec intervals, digitized, and then stored on an Excel spreadsheet for further analysis.26
Renal scintigraphy and GFR
On a separate day, a proportion (n = 18) of the offspring comprising LC (n = 6), OC (n = 8), and ONR (n = 4) were individually placed in a metabolic crate but directly under a γ-camera head that was positioned horizontally above their kidneys. At time 0, 100 MBq technetium-99-diethylenetriaminepentaacetic acid (diethylenetriaminepentaaceticacid which is cleared only through the kidneys) in 0.5 ml NaCl was injected intravenously. Over the next 20 min, an image was captured on the γ camera every 20 s, producing a total of 60 frames from which a dynamic renogram was produced for each kidney that was automatically adjusted for background correction and bolus dose deconvolution and manually corrected post hoc for movement artifact.48 Specific measures of interest were time to peak (min) and upslope (cpm) - indicative of rate of uptake of tracer into the kidney, downslope (cpm) - indicative of rate of tracer clearance and area under the curve - reflecting the summated renal function curve. At 3, 4, and 5 h later, 5 ml blood was drawn from the contralateral jugular cannula into heparinized tubes and plasma collected for measurement of GFR. In brief, duplicate 1 ml plasma aliquots, with timed control samples, were counted on a γ counter and GFR determined by extrapolation from the decline in blood radioactivity over time.48-50
After all experiments, the sheep were humanely killed by electrocortical stunning and exsanguination. All major organs were rapidly excised, weighed, and a representative sample snap-frozen in liquid nitrogen before being stored at −80°C until further molecular analysis was performed. Additionally, a representative mid-line section of kidney was dissected (∼10 g), fixed in 10% (v/v) formalin, and embedded in paraffin wax for subsequent histological analysis as described previously.16 For body composition analysis, the wool was removed and the carcass sectioned down the midline with a half-carcass being minced. A proportion (500 g) was analyzed chemically (Eurofins Laboratories Ltd, Wolverhampton, UK) for moisture content, percentage protein (Kjedahl method × 6.25; i.e., total non-fat mass), and total fat (Soxhlot method).
Molecular biological analyses
Leptin assay
Plasma leptin concentration was determined using a validated double-antibody regulatory impact analysis as previously published.51 Plasma concentrations of leptin were assayed in duplicate 200 μl samples using a rabbit anti-ovine leptin primary antibody, iodinated ovine leptin, and sheep anti-rabbit secondary antibody. The limit of leptin detection was 0.1 ng/ml and the intra- and interassay coefficients of variation for the assay were 4.2 and 9.1%, respectively.
Preparation of mRNA
Total RNA was extracted from a known amount of kidney tissue (between 50-100 mg) using Tri-reagent (Sigma, Poole, UK). Following RNA extraction, 1 μg of each sample was reverse transcribed in a 20 μl reaction containing buffer (250 mm Tris-HCL, 40 mm MgCl2, 150 mm KCL, 5 mm dithioerythritol; pH 8.5), 2 mm deoxyribonucleotide triphosphates, 1 × hexanucleotide mix, 10 U RNase inhibitor, 10 U reverse transcriptase (RT) (Roche Diagnostics, Lewes, UK) in a Touchgene Gradient thermocycler (Techne, Barloworld Scientific Ltd, Stone, UK). The conditions used to generate first strand cDNA were 72°C (5 min), 4°C (2 min), 25°C (5 min), 25°C (10 min), 42°C (60 min), and 72°C (10 min). To ensure that there was no contaminating genomic DNA control, reactions without RT were included. RNA concentration and quality were verified by gel electrophoresis and spectrophotometrically using a standard conversion factor of one absorbance unit at 260 nm per 40 μg RNA/ml. All samples had an A260/A280 ratio greater than 1.96. Total RNA concentration varied from 0.21 to 0.33 μg/μl among all samples. RNA concentration was adjusted by dilution with nuclease-free water (Ambion Applied Biosystems, Warrington, UK) before cDNA synthesis to a standard concentration of 1 μg/μl. All samples were stored at −20°C until use.
Standard curve generation
Standards for GCR type II (GR), AT1, AT2, TNF-α, and for the housekeeping gene 18s ribosomal RNA were made from cDNA obtained from a randomly selected LC animal kidney using semiquantitative polymerase chain reaction (PCR). The method used oligonucleotide primers to GCR, AT1, AT2, TNF-α, and 18s genes generating specific intron-spanning products. 18s was chosen as the housekeeping gene as the alternatives (e.g., glyceraldehyde-3-phosphate dehydrogenase and β-actin) are nutritionally sensitive.52 The PCR program comprised an initial denaturation stage (95°C, 15 min), amplification (stage I, 94°C (30 s); stage II, annealing temperature (30 s); stage III, 72°C (1 min), and final extension (72°C, 7 min; 8°C ‘hold’). The PCR mixture (final volume 20 μl) contained 7 μl nuclease-free water (Ambion), 10 μl thermo-start PCR master mix (50 μl contains 1.25 U Thermo-Start DNA polymerase, 1 × thermo-start reaction buffer, 1.5 mm MgCl2 and 0.2 mm each of denatured adenotriphosphate, denatured 2′-deoxycytidine 5′-triphosphate, denatured 2′-deoxyguanosine 5′-triphosphate, and denatured 2′-deoxythymidine 5′-triphosphate (ABgene, Epsom, UK)), 1 μl forward primer, 1 μl reverse primer, and 1 μl RT (cDNA) product. The annealing temperature and cycle number of all primers were optimized and used in their linear range (Table 4). Agarose gel electrophoresis (2.0-2.5%) and ethidium bromide staining confirmed the presence of both the product and 18s at the expected sizes. All procedures were performed with appropriate negative and positive controls as well as a range of molecular weight markers (MBI Fermentas, York, UK). The resultant PCR product was extracted (QIAquick gel extraction kit, Qiagen®, cat no. 28704), sequenced, and results cross-referenced against the Genbank website to determine specificity of the target gene. After confirmation that the product was specific to the target gene, extracted PCR products were resuspended in nuclease-free water and a 10-fold serial dilution performed. Standards were stored at −20°C until use in quantitative PCR.
Table 4.
Primers sequences and optimal PCR conditions used
| Gene | Primer sequence | Annealing temp (°C) | Product size (bp) | Refs. |
|---|---|---|---|---|
| GCR | Forward 5′-ACTGCCCCAAGTGAAAACAGA-3′ | 59.0 | 150 | 53 |
| Reverse 5′-ATGAACAGAAATGGCAGACATT-3′ | ||||
| AT1 | Forward 5′-GGGCTGTCTACACTGCTATGGAA-3′ | 60.0 | 67 | 54 |
| Reverse 5′-CCGGAAGCGATCTTACATAGGTA | ||||
| AT2 | Forward 5′-TGTTCTGGCGTTCATCATTTG-3′ | 60.0 | 71 | 54 |
| Reverse 5′-CCATCCAAGCTAGAGCATCCA-3′ | ||||
| TNF-α | Forward 5′-GGTGCCTCAGCCTCTTCTC-3′ | 60 | 136 | 55 |
| Forward 5′-GAACCAGAGGCCTGTTGAAG-3′ | ||||
| 18s | Forward 5′-ATGCGGCGGCGTTATTCC-3′ | 56.0 | 125 | 53 |
| Reverse 5′-CTCCTGGTGGTGCCCTTCC-3′ |
AT1, angiotensin II receptor type 1; AT2, angiotensin II receptor type 2; GCR, glucocorticoid receptor; TNF, tumor necrosis factor.
Quantitative (real-time) PCR
Quantitative PCR was used to examine the expression of GCR, AT1, AT2 TNF-α, and 18s (Table 4). PCR reactions, set up in duplicate, were carried out in 20 μl volumes consisting of 1 × SYBR® PCR mastermix (with ROX passive reference dye) (Qiagen Ltd, Crawley, UK), 500 nm forward primer, 500 nm reverse primer, and 7 μl nuclease-free water. Real time PCR was performed in a Techne Quantica™ 14 real-time thermocycler (Techne, Barloworld Scientific Ltd) on all samples at 95°C (15 min) followed by 45 cycles of 95°C (15 s), annealing temperature (25 s), 72°C (25 s). Three negative control reactions were carried out with each set of samples analyzed: (1) no RNA template but RT and polymerase provided; (2) RNA and polymerase provided but no RT; and (3) RNA and RT provided but no polymerase.
Histological analysis
Serial sections of 5 μm were cut in the same orientation from paraffin-embedded tissue blocks (Sledge Microtome, Anglia Scientific, Norwich, UK) and mounted onto Superfrost plus glass microscope slides (Menzel-Glaser, Braunschweig, Germany). Sections were left to adhere to slides overnight at 37°C. Before use, sections were dewaxed by immersion in xylene followed by rehydration in descending concentrations of alcohol, 3 min each.
Periodic acid Schiff’s staining for glomerulosclerosis
Sections were incubated in periodic acid 0.5% solution for 5 min (Merck, Darmstadt, Germany), rinsed in running tap water and covered with Schiff’s reagent (Merck) for 15 min.56 Following rinsing in tap water, sections were counterstained with Harris’s hematoxylin before dehydration in ascending concentrations of alcohol. Glass coverslips (VWR International, Lutterworth, Leicestershire, UK) were mounted using DPX mountant (BDH, Poole, Dorset, UK).
Assessment of tubular injury from the presence of protein casts
This technique was identical to that described by Xia et al.57 with the number of protein casts in the outer medulla of five randomly selected fields being used to calculate the mean incidence of protein casts (±s.e.m. per original magnification × 200 field).
Detection of apoptosis with TUNEL and caspase 3 labelling
TUNEL
The TUNEL assay (Roche Diagnostics, Manheim, Germany) was carried out following the manufacturer’s protocol for formalin-fixed paraffin-embedded tissues. The sections were mounted using Vectashield mounting medium (Vector Laboratories, Peterborough, UK) and covered with glass coverslips (VWR International). The sections were stored at 4°C in the dark and were analyzed and photographed within 48 h. Two negative controls were performed by replacing 50 μl of TUNEL reaction mixture with 50 μl of label solution (containing no terminal deoxynucleotidyl transferase enzyme) in order to assess both nonspecific binding and the extent of autofluorescence within the tissue section. Positive controls were included, which were treated with deoxyribonuclease type I to produce fragmentation of chromosomal DNA. The deoxyribonuclease-positive control was washed separately to prevent any residual deoxyribonuclease activity affecting other sections in the assay.58
Caspase-3
As the TUNEL reaction is unable to discriminate apoptotic from necrotic cells, caspase-3, a marker of early apoptosis was localized using a rabbit anti-caspase 3 polyclonal antibody (Abcam plc, Cambridge, UK) diluted 1:50. Immunohistochemistry was performed on a commercially available computerized Bond™ automated immunohistochemistry system (Vision Biosystems Limited, Newcastle-upon-Tyne, UK) using a bond polymer refine detection kit. A negative control was performed for each test section by omitting incubation in the primary antibody. Tonsil was used as the positive control. Sections were dehydrated in ascending concentrations of alcohol and xylene before coverslips were mounted (DPX mountant, BDH).
Quantification of histological studies
TUNEL
All analysis was performed blind by the same assessor using reference slides to check consistency of grading assessment. For assessment of apoptosis, slides were analyzed using fluorescence microscopy using fluorescein isothiocyanate and UV filters to visualize green (fragmented DNA). A semiquantitative apoptosis index (0-4) was derived from a previously described method.43 Grade 0 = no positive labelling, 1 = 1-25%, 2 = 26-49%, 3 = 50-74%, and 4 = 75-100% of cells in nephron positively labelled. All glomeruli and 30 randomly chosen fields in the medullary region per kidney section were evaluated at original magnification × 200.
Sclerosis
Sampled glomeruli were given a semiquantitative sclerosis score between 0 and 4. Normal (no sclerosis) glomeruli were representative of 0. Glomeruli with 1-25% sclerosis were graded as 1, 26-50% as 2, 51-75% as 3, and 76-100% as 4.
Caspase-3
Quantitation was performed at original magnification × 200 using a 10 × 10 mm graticule. For each section, the number of positive cells in five randomly selected fields was used to calculate the mean positive cell count ±s.e.m. per original magnification × 200 field. To make a comparison of cell numbers within a similar area of tissue, fields containing large vessels were not included as the presence of these reduced the total tissue area in which cells could be counted.
Statistical analysis
All data are presented as mean±s.e.m. Tests of normality as determined by the Kolmogorov-Smirnoff test revealed that with the exception of GCR, the data was parametric, thus statistically significant differences between all groups were determined by one way analysis of variance with post hoc comparisons to determine individual differences between groups as appropriate. Bonferroni’s correction was applied in order to adjust for the multiple tests being performed. Data for GCR was analyzed by the Kruskal-Wallis test to identify treatment differences followed by Mann-Whitney U tests to determine individual difference between groups. Statistical analysis was carried out using SPSS version 14 software (SPSS Inc., Chicago, IL).
ACKNOWLEDGMENTS
We thank Elaine Blackshaw for her assistance with the radionuclide imaging and GFR studies. The work was supported by a British Heart Foundation Lectureship for DSG and the European Union Sixth Framework Programme for Research and Technical Development of the European Community - The Early Nutrition Programming Project (FOOD-CT-2005-007036).
REFERENCES
- 1.Poirier P, Giles TD, Bray GA, et al. Obesity and cardiovascular disease: pathophysiology, evaluation, and effect of weight loss: an update of the 1997 American Heart Association Scientific Statement on Obesity and Heart Disease from the Obesity Committee of the Council on Nutrition, Physical Activity, and Metabolism. Circulation. 2006;113:898–918. doi: 10.1161/CIRCULATIONAHA.106.171016. [DOI] [PubMed] [Google Scholar]
- 2.Hall JE. The kidney, hypertension, and obesity. Hypertension. 2003;41:625–633. doi: 10.1161/01.HYP.0000052314.95497.78. [DOI] [PubMed] [Google Scholar]
- 3.Agnani S, Vachharajani VT, Gupta R, et al. Does treating obesity stabilize chronic kidney disease? BMC Nephrol. 2005;6:7. doi: 10.1186/1471-2369-6-7. [DOI] [PMC free article] [PubMed] [Google Scholar]
- 4.Kambham N, Markowitz GS, Valeri AM, et al. Obesity-related glomerulopathy: an emerging epidemic. Kidney Int. 2001;59:1498–1509. doi: 10.1046/j.1523-1755.2001.0590041498.x. [DOI] [PubMed] [Google Scholar]
- 5.Kasiske BL, O’Donnell MP, Cleary MP, et al. Treatment of hyperlipidemia reduces glomerular injury in obese Zucker rats. Kidney Int. 1988;33:667–672. doi: 10.1038/ki.1988.51. [DOI] [PubMed] [Google Scholar]
- 6.Haynes WG. Interaction between leptin and sympathetic nervous system in hypertension. Curr Hypertens Rep. 2000;2:311–318. doi: 10.1007/s11906-000-0015-1. [DOI] [PubMed] [Google Scholar]
- 7.Aizawa-Abe M, Ogawa Y, Masuzaki H, et al. Pathophysiological role of leptin in obesity-related hypertension. J Clin Invest. 2000;105:1243–1252. doi: 10.1172/JCI8341. [DOI] [PMC free article] [PubMed] [Google Scholar]
- 8.Haynes WG, Morgan DA, Walsh SA, et al. Cardiovascular consequences of obesity: role of leptin. Clin Exp Pharmacol Physiol. 1998;25:65–69. doi: 10.1111/j.1440-1681.1998.tb02147.x. [DOI] [PubMed] [Google Scholar]
- 9.Mark AL, Correia M, Morgan DA, et al. State-of-the-art-lecture: Obesity-induced hypertension: new concepts from the emerging biology of obesity. Hypertension. 1999;33:537–541. doi: 10.1161/01.hyp.33.1.537. [DOI] [PubMed] [Google Scholar]
- 10.Rahmouni K, Haynes WG, Mark AL. Cardiovascular and sympathetic effects of leptin. Curr Hypertens Rep. 2002;4:119–125. doi: 10.1007/s11906-002-0036-z. [DOI] [PubMed] [Google Scholar]
- 11.Correia ML, Haynes WG, Rahmouni K, et al. The concept of selective leptin resistance: evidence from agouti yellow obese mice. Diabetes. 2002;51:439–442. doi: 10.2337/diabetes.51.2.439. [DOI] [PubMed] [Google Scholar]
- 12.Hall JE, Hildebrandt DA, Kuo J. Obesity hypertension: role of leptin and sympathetic nervous system. Am J Hypertens. 2001;14:103S–115S. doi: 10.1016/s0895-7061(01)02077-5. [DOI] [PubMed] [Google Scholar]
- 13.Wellen KE, Hotamisligil GS. Obesity-induced inflammatory changes in adipose tissue. J Clin Invest. 2003;112:1785–1788. doi: 10.1172/JCI20514. [DOI] [PMC free article] [PubMed] [Google Scholar]
- 14.Mackenzie HS, Brenner BM. Fewer nephrons at birth: a missing link in the etiology of essential hypertension? Am J Kidney Dis. 1995;26:91–98. doi: 10.1016/0272-6386(95)90161-2. [DOI] [PubMed] [Google Scholar]
- 15.Keller G, Zimmer G, Mall G, et al. Nephron number in patients with primary hypertension. N Engl J Med. 2003;348:101–108. doi: 10.1056/NEJMoa020549. [DOI] [PubMed] [Google Scholar]
- 16.Gopalakrishnan GS, Gardner DS, Dandrea J, et al. Influence of maternal pre-pregnancy body composition and diet during early-mid pregnancy on cardiovascular function and nephron number in juvenile sheep. Br J Nutr. 2005;94:938–947. doi: 10.1079/bjn20051559. [DOI] [PMC free article] [PubMed] [Google Scholar]
- 17.Langley-Evans SC, Welham SJ, Jackson AA. Fetal exposure to a maternal low protein diet impairs nephrogenesis and promotes hypertension in the rat. Life Sci. 1999;64:965–974. doi: 10.1016/s0024-3205(99)00022-3. [DOI] [PubMed] [Google Scholar]
- 18.Zandi-Nejad K, Luyckx VA, Brenner BM. Adult hypertension and kidney disease: the role of fetal programming. Hypertension. 2006;47:502–508. doi: 10.1161/01.HYP.0000198544.09909.1a. [DOI] [PubMed] [Google Scholar]
- 19.Alexander BT. Fetal programming of hypertension. Am J Physiol Regul Integr Comp Physiol. 2006;290:R1–R10. doi: 10.1152/ajpregu.00417.2005. [DOI] [PubMed] [Google Scholar]
- 20.Whorwood CB, Firth KM, Budge H, et al. Maternal undernutrition during early to midgestation programs tissue-specific alterations in the expression of the glucocorticoid receptor, 11β-hydroxysteroid dehydrogenase isoforms, and type 1 angiotensin II receptor in neonatal sheep. Endocrinology. 2001;142:2854–2864. doi: 10.1210/endo.142.7.8264. [DOI] [PubMed] [Google Scholar]
- 21.Hoppe CC, Evans RG, Moritz KM, et al. Combined prenatal and postnatal protein restriction influences adult kidney structure, function and arterial pressure. Am J Physiol Regul Integr Comp Physiol. 2006;292:R462–R469. doi: 10.1152/ajpregu.00079.2006. [DOI] [PubMed] [Google Scholar]
- 22.McMullen S, Langley-Evans SC. Sex-specific effects of prenatal low-protein and carbenoxolone exposure on renal angiotensin receptor expression in rats. Hypertension. 2005;46:1374–1380. doi: 10.1161/01.HYP.0000188702.96256.46. [DOI] [PMC free article] [PubMed] [Google Scholar]
- 23.Wintour EM, Alcorn D, Albiston A, et al. The renin-angiotensin system and the development of the kidney and adrenal in sheep. Clin Exp Pharmacol Physiol. 1998;25(Suppl):S97–100. doi: 10.1111/j.1440-1681.1998.tb02309.x. [DOI] [PubMed] [Google Scholar]
- 24.Wintour EM, Moritz KM. Comparative aspects of fetal renal development. Equine Vet J. 1997;(Suppl):51–58. doi: 10.1111/j.2042-3306.1997.tb05078.x. [DOI] [PubMed] [Google Scholar]
- 25.Moritz KM, Dodic M, Wintour EM. Kidney development and the fetal programming of adult disease. Bioessays. 2003;25:212–220. doi: 10.1002/bies.10240. [DOI] [PubMed] [Google Scholar]
- 26.Gardner DS, Pearce S, Dandrea J, et al. Peri-implantation undernutrition programs blunted angiotensin II evoked baroreflex responses in young adult sheep. Hypertension. 2004;43:1290–1296. doi: 10.1161/01.HYP.0000126991.67203.7b. [DOI] [PMC free article] [PubMed] [Google Scholar]
- 27.Gopalakrishnan GS, Gardner DS, Rhind SM, et al. Programming of adult cardiovascular function after early maternal undernutrition in sheep. Am J Physiol Regul Integr Comp Physiol. 2004;287:R12–R20. doi: 10.1152/ajpregu.00687.2003. [DOI] [PubMed] [Google Scholar]
- 28.Bowers MC, Katki KA, Rao A, et al. Role of calcitonin gene-related peptide in hypertension-induced renal damage. Hypertension. 2005;46:51–57. doi: 10.1161/01.HYP.0000168926.44648.ed. [DOI] [PubMed] [Google Scholar]
- 29.Suzuki H, Tokuriki T, Kamita H, et al. Age-related pathophysiological changes in rat oligomeganephronic hypoplastic kidney. Pediatr Nephrol. 2006;21:637–642. doi: 10.1007/s00467-006-0089-3. [DOI] [PubMed] [Google Scholar]
- 30.Schwartz MW, Peskind E, Raskind M, et al. Cerebrospinal fluid leptin levels: relationship to plasma levels and to adiposity in humans. Nat Med. 1996;2:589–593. doi: 10.1038/nm0596-589. [DOI] [PubMed] [Google Scholar]
- 31.Crook ED. Diabetic renal disease in African Americans. Am J Med Sci. 2002;323:78–84. doi: 10.1097/00000441-200202000-00004. [DOI] [PubMed] [Google Scholar]
- 32.Hamoui N, Anthone G, Crookes PF. Calcium metabolism in the morbidly obese. Obes Surg. 2004;14:9–12. doi: 10.1381/096089204772787211. [DOI] [PubMed] [Google Scholar]
- 33.Rutkowski P, Klassen A, Sebekova K, et al. Renal disease in obesity: the need for greater attention. J Ren Nutr. 2006;16:216–223. doi: 10.1053/j.jrn.2006.04.017. [DOI] [PubMed] [Google Scholar]
- 34.Vehaskari VM, Aviles DH, Manning J. Prenatal programming of adult hypertension in the rat. Kidney Int. 2001;59:238–245. doi: 10.1046/j.1523-1755.2001.00484.x. [DOI] [PubMed] [Google Scholar]
- 35.Ding G, Reddy K, Kapasi AA, et al. Angiotensin II induces apoptosis in rat glomerular epithelial cells. Am J Physiol Renal Physiol. 2002;283:F173–F180. doi: 10.1152/ajprenal.00240.2001. [DOI] [PubMed] [Google Scholar]
- 36.Ruiz-Ortega M, Ruperez M, Esteban V, et al. Angiotensin II: a key factor in the inflammatory and fibrotic response in kidney diseases. Nephrol Dial Transplant. 2006;21:16–20. doi: 10.1093/ndt/gfi265. [DOI] [PubMed] [Google Scholar]
- 37.Brennan KA, Gopalakrishnan GS, Kurlak L, et al. Impact of maternal undernutrition and fetal number on glucocorticoid, growth hormone and insulin-like growth factor receptor mRNA abundance in the ovine fetal kidney. Reproduction. 2005;129:151–159. doi: 10.1530/rep.1.00229. [DOI] [PubMed] [Google Scholar]
- 38.Rajah R, Valentinis B, Cohen P. Insulin-like growth factor (IGF)-binding protein-3 induces apoptosis and mediates the effects of transforming growth factor-beta1 on programmed cell death through a p53- and IGF-independent mechanism. J Biol Chem. 1997;272:12181–12188. doi: 10.1074/jbc.272.18.12181. [DOI] [PubMed] [Google Scholar]
- 39.Mark AL, Correia ML, Rahmouni K, et al. Selective leptin resistance: a new concept in leptin physiology with cardiovascular implications. J Hypertens. 2002;20:1245–1250. doi: 10.1097/00004872-200207000-00001. [DOI] [PubMed] [Google Scholar]
- 40.Kassab S, Kato T, Wilkins FC, et al. Renal denervation attenuates the sodium retention and hypertension associated with obesity. Hypertension. 1995;25:893–897. doi: 10.1161/01.hyp.25.4.893. [DOI] [PubMed] [Google Scholar]
- 41.Gilbert JS, Lang AL, Grant AR, et al. Maternal nutrient restriction in sheep: hypertension, decreased nephron number and altered renal RAS expression in offspring at nine months. J Physiol. 2005;565:137–147. doi: 10.1113/jphysiol.2005.084202. [DOI] [PMC free article] [PubMed] [Google Scholar]
- 42.Mitchell EK, Louey S, Cock ML, et al. Nephron endowment and filtration surface area in the kidney after growth restriction of fetal sheep. Pediatr Res. 2004;55:769–773. doi: 10.1203/01.PDR.0000120681.61201.B4. [DOI] [PubMed] [Google Scholar]
- 43.Wintour EM, Moritz KM, Johnson K, et al. Reduced nephron number in adult sheep, hypertensive as a result of prenatal glucocorticoid treatment. J Physiol. 2003;549:929–935. doi: 10.1113/jphysiol.2003.042408. [DOI] [PMC free article] [PubMed] [Google Scholar]
- 44.AFRC . An advisory manual prepared by the AFRC technical committee on responses to nutrients. 9th edn. Oxford: CAB International; 1993. Energy and protein requirements of ruminants; pp. 812–815. [Google Scholar]
- 45.Gnanalingham MG, Mostyn A, Dandrea J, et al. Ontogeny and nutritional programming of uncoupling protein-2 and glucocorticoid receptor mRNA in the ovine lung. J Physiol. 2005;565:159–169. doi: 10.1113/jphysiol.2005.083246. [DOI] [PMC free article] [PubMed] [Google Scholar]
- 46.Hyatt MA, Gopalakrishnan GS, Bispham J, et al. Maternal nutrient restriction in early pregnancy programs hepatic mRNA expression of growth-related genes and liver size in adult male sheep. J Endocrinol. 2007;192:87–97. doi: 10.1677/joe.1.06801. [DOI] [PubMed] [Google Scholar]
- 47.Dandrea J, Cooper S, Ramsay MM, et al. The effects of pregnancy and maternal nutrition on the maternal renin-angiotensin system in sheep. Exp Physiol. 2002;87:353–359. doi: 10.1113/eph8702320. [DOI] [PubMed] [Google Scholar]
- 48.Twardock AR, Krawiec DR, Itkin RJ. Handbook of Veterinary Nuclear Medicine. Raleigh: North Carolina University; 1993. Chapter 15, Renal Imaging 1: functional renal scintigraphy; pp. 122–130. [Google Scholar]
- 49.Fleming JS, Zivanovic MA, Blake GM, et al. Guidelines for the measurement of glomerular filtration rate using plasma sampling. Nucl Med Commun. 2004;25:759–769. doi: 10.1097/01.mnm.0000136715.71820.4a. [DOI] [PubMed] [Google Scholar]
- 50.Gleadhill A, Marlin D, Harris PA, et al. Use of a three-blood-sample plasma clearance technique to measure GFR in horses. Vet J. 1999;158:204–209. doi: 10.1053/tvjl.1999.0385. [DOI] [PubMed] [Google Scholar]
- 51.Delavaud C, Bocquier F, Chilliard Y, et al. Plasma leptin determination in ruminants: effect of nutritional status and body fatness on plasma leptin concentration assessed by a specific RIA in sheep. J Endocrinol. 2000;165:519–526. doi: 10.1677/joe.0.1650519. [DOI] [PubMed] [Google Scholar]
- 52.Symonds ME, Phillips ID, Anthony RV, et al. Prolactin receptor gene expression and foetal adipose tissue. J Neuroendocrinol. 1998;10:885–890. doi: 10.1046/j.1365-2826.1998.00275.x. [DOI] [PubMed] [Google Scholar]
- 53.Gnanalingham MG, Mostyn A, Gardner DS, et al. Developmental regulation of the lung in preparation for life after birth: hormonal and nutritional manipulation of local glucocorticoid action and uncoupling protein-2. J Endocrinol. 2006;188:375–386. doi: 10.1677/joe.1.06530. [DOI] [PubMed] [Google Scholar]
- 54.Dodic M, Hantzis V, Duncan J, et al. Programming effects of short prenatal exposure to cortisol. FASEB J. 2002;16:1017–1026. doi: 10.1096/fj.01-1045com. [DOI] [PubMed] [Google Scholar]
- 55.Budhia S, Haring LF, McConnell I, et al. Quantitation of ovine cytokine mRNA by real-time RT-PCR. J Immunol Methods. 2006;309:160–172. doi: 10.1016/j.jim.2005.12.006. [DOI] [PubMed] [Google Scholar]
- 56.Jiang T, Liebman SE, Lucia MS, et al. Role of altered renal lipid metabolism and the sterol regulatory element binding proteins in the pathogenesis of age-related renal disease. Kidney Int. 2005;68:2608–2620. doi: 10.1111/j.1523-1755.2005.00733.x. [DOI] [PubMed] [Google Scholar]
- 57.Xia CF, Bledsoe G, Chao L, et al. Kallikrein gene transfer reduces renal fibrosis, hypertrophy, and proliferation in DOCA-salt hypertensive rats. Am J Physiol Renal Physiol. 2005;289:F622–F631. doi: 10.1152/ajprenal.00427.2004. [DOI] [PubMed] [Google Scholar]
- 58.Lepault E, Celeste C, Dore M, et al. Comparative study on microvascular occlusion and apoptosis in body and limb wounds in the horse. Wound Repair Regen. 2005;13:520–529. doi: 10.1111/j.1067-1927.2005.00073.x. [DOI] [PubMed] [Google Scholar]